14\Yearpublication2008\Yearsubmission2008\Month07\Volume\Issue
—
What do dynamical cluster masses really tell us about dynamics?
Abstract
The diagnostic age versus mass–to–light ratio diagram is often used in attempts to constrain the shape of the stellar initial mass function, and the stability and the potential longevity of extragalactic young to intermediate-age massive star clusters. Here, we explore the pitfalls associated with this approach and its potential for use with Galactic open clusters. We conclude that for an open cluster to survive for any significant fraction of a Hubble time (in the absence of substantial external perturbations), it is a necessary but not a sufficient condition to be located close to the predicted photometric evolutionary sequences for ‘normal’ simple stellar populations.
keywords:
open clusters and associations: general — open clusters and associations: individual (Westerlund 1) — binaries: general — stellar dynamics1 A diagnostic diagram?
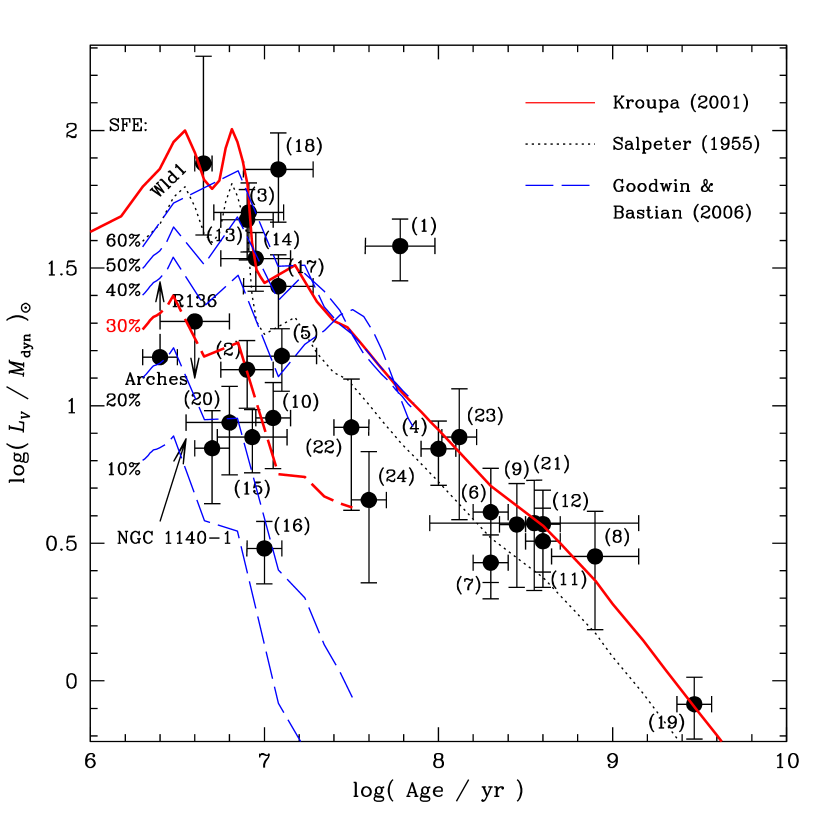
Over the past few years, detailed studies of the stellar content and longevity of extragalactic massive star clusters have increasingly resorted to the use of the age versus mass-to-light () ratio diagram as a diagnostic tool (see Fig. 1 for an up-to-date version), where one usually compares dynamically determined ratios with those predicted by the evolution of ‘simple’ stellar populations (SSPs; e.g., Smith & Gallagher 2001; Mengel et al. 2002; McCrady et al. 2003, 2005; Larsen et al. 2004; Bastian et al. 2006; Goodwin & Bastian 2006; Moll et al. 2008; see de Grijs & Parmentier 2007 for a review). Based on high-resolution spectroscopy to obtain the objects’ integrated velocity dispersions, , and on high spatial resolution imaging to obtain accurate projected half-light radii, , most authors then apply Spitzer’s (1987) equation,
| (1) |
to obtain the dynamical cluster masses, ( is the gravitational constant and is a dimensionless parameter which is usually assumed to be constant; but see Fleck et al. 2006; Kouwenhoven & de Grijs 2008).
Despite a number of simplifying assumptions (see, e.g., de Grijs & Parmentier 2007 for a review; Moll et al. 2008), one can get at least an initial assessment as to whether a given cluster may be (i) significantly out of virial equilibrium, in particular ‘super-virial’, (ii) significantly over- or underabundant in low-mass stars, or (iii) populated by a significant fraction of binary and higher-order multiple systems. This has led to suggestions that, in the absence of significant external perturbations, young massive clusters (YMCs) located in the vicinity of the SSP models and aged yr may survive for a Hubble time and eventually become old globular cluster (GC)-like objects (e.g., Larsen et al. 2004; Bastian et al. 2006; de Grijs & Parmentier 2007).
In this contribution we will first highlight the uncertainties associated with a few of the YMCs (Section 2) – and thus question the use of the velocity dispersion as a tracer of their gravitational potential – and then proceed to apply the same diagnostic approach to a small sample of Galactic open clusters (Section 3). In Section 4 we will provide a summary, emphasising the pitfalls associated with the use of dynamical mass estimates as a proxy for cluster longevity.
2 Closer inspection
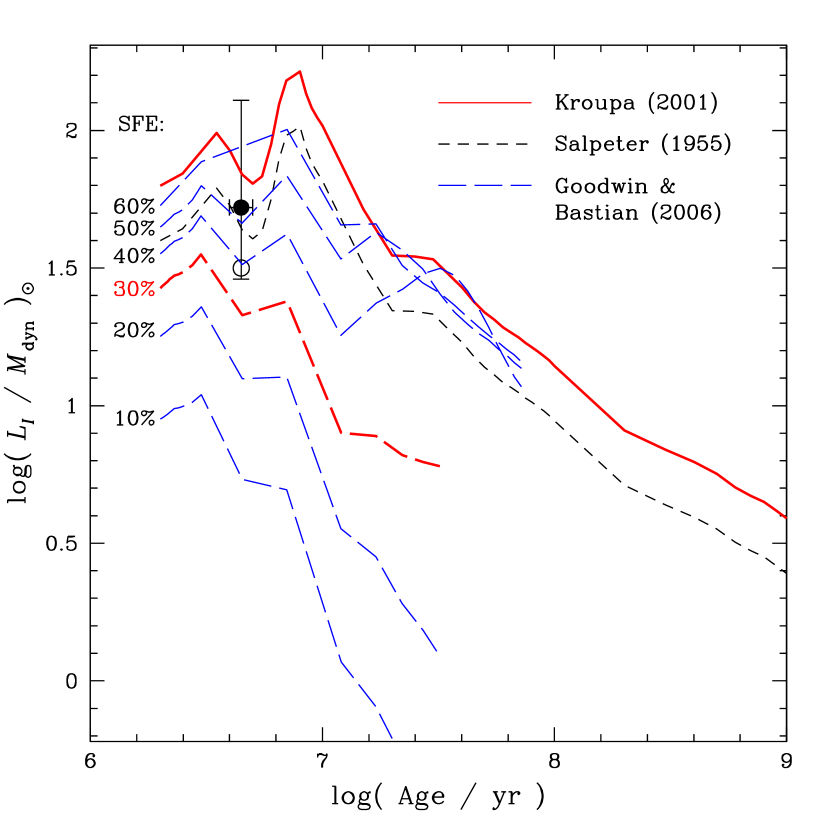
Let us now examine a few of the YMCs from Fig. 1 in more detail. Using the dynamical mass estimate from Mengel & Tacconi-Garman (2007), combined with the integrated photometry of Piatti et al. (1998), in de Grijs & Parmentier (2007) we concluded that the Galactic YMC Westerlund 1 appears to be consistent with a normal Kroupa (2001) or Salpeter (1955)-type initial mass function (IMF), despite the significant uncertainties in the observables. Since in the band, on which the Piatti et al. (1998) photometry was based, the confusion between the cluster members and the Galactic field stellar population is substantial (because of the significant extinction along this sightline), we obtained imaging observations in the band, where this confusion is significantly reduced (de Grijs et al. 2008).
The combined integrated magnitude of the three brightest red supergiants, yellow hypergiants, and blue supergiants is some 40% of the cluster’s total integrated -band flux (see de Grijs et al. 2008 for details). These nine sources stand out from the overall stellar luminosity function, which appears to otherwise have been drawn from a ‘normal’ IMF. Each of these sources is in a rare, short-lived phase and so the luminosity of the cluster might be expected to vary significantly on short time-scales. Thus, this serves as a clear caution that stochasticity in the cluster’s IMF (e.g., Brocato et al. 2000; Barker et al. 2008), as well as stochasticity in the numbers of stars in unusually luminous post-main-sequence evolutionary stages (e.g., Cerviño & Valls-Gabaud 2003; Cervinño & Luridiana 2006) may contribute significantly to variations in a cluster’s ratio.
Thanks to Bastian & Goodwin (2006) and Goodwin & Bastian (2006), we are now confident that we understand why some of the YMCs deviate significantly from the expected evolution – for a ‘standard’ IMF – of the stellar ratio at ages of up to a few yr. However, the location of the massive cluster F in M82 remains to be understood, despite having been the subject of a considerable number of recent studies (see, e.g., Bastian et al. 2007 for an overview).
Smith & Gallagher (2001) concluded that, assuming that their age ( Myr), mass () and luminosity ( mag; ) measurements for the object were correct, it must either have a low-mass cut-off of its mass function at , or a shallow mass function slope, for a mass function including stellar masses down to . McCrady et al. (2003) suggested, based on near-infrared population synthesis modeling, that Smith & Gallagher (2001) had overestimated their ages as well as the half-mass radius of the cluster; they derived the latter more accurately based on higher-resolution imaging. However, in a recent paper Bastian et al. (2007) used optical spectroscopy, confirming the YMC’s age to be in the range of 50–70 Myr. However, contrary to the earlier studies, Bastian et al. (2007) conclude that M82-F is subject to a large amount of differential extinction, thus rendering earlier luminosity estimates based on the assumption of foreground-screen extinction very uncertain. They conclusively show that the apparently large degree of mass segregation in the cluster, derived by McCrady et al. (2005) based on the variation of as a function of wavelength, is in fact caused by this differential extinction. Applying their spatially resolved extinction corrections to Hubble Space Telescope imaging data, Bastian et al. (2007) also suggest that the original cluster size reported by Smith & Gallagher (2001) was underestimated. Using their updated (larger) size estimate, the discrepant M82-F data point moves closer to the SSP predictions, hence suggesting that the cluster may be less enigmatic than previously thought.
Finally, we single out YMC NGC 1140-1 (Hunter et al. 1994; de Grijs et al. 2004; Moll et al. 2008) for a closer look. There are various potential explanations for the difference between its observed and the SSP model ratio. Assuming that this difference is due solely to the cluster being out of virial equilibrium, its effective star-formation efficiency (eSFE; Goodwin & Bastian 2006) is around 10–20%. The eSFE is a measure of the extent to which a cluster is out of equilibrium after gas expulsion, on the basis that the virial ratio immediately before gas expulsion was (eSFE), where and are the kinetic and potential energy of the stars, respectively, and a system in virial equilibrium has . The eSFE corresponds to the true SFE if the stars and gas were initially in virial equilibrium. Goodwin & Bastian (2006) predict that a cluster with an eSFE of 10% will lose 80% of its mass in 20 Myr and not remain bound. As such, the cluster would disperse over a relatively short time-scale and, therefore, not evolve into a second-generation GC. More likely, however, the crowded nature of the region may have caused the cluster velocity dispersion (and hence the ratio) to be overestimated. The broadening of the red-supergiant features seen in the knot spectra may not have been due solely to the virial motions of the brightest cluster within the knot, as was assumed, but may have had contributions from the motions of nearby contaminating clusters instead (cf. Moll et al. 2008).
3 Galactic open clusters
We will now explore whether we can also use the same diagnostic diagram to assess the stability, formation conditions, binarity and longevity of those open clusters in the Milky Way for which the requisite observational data exist in the literature. Using the observational data compiled in de Grijs et al. (2008), we applied Spitzer’s (1987) equation, Eq. (1), to derive the dynamical masses for each of our sample clusters, and then calculated their ratios. The clusters’ loci in the diagnostic diagram are shown in Fig. 3.
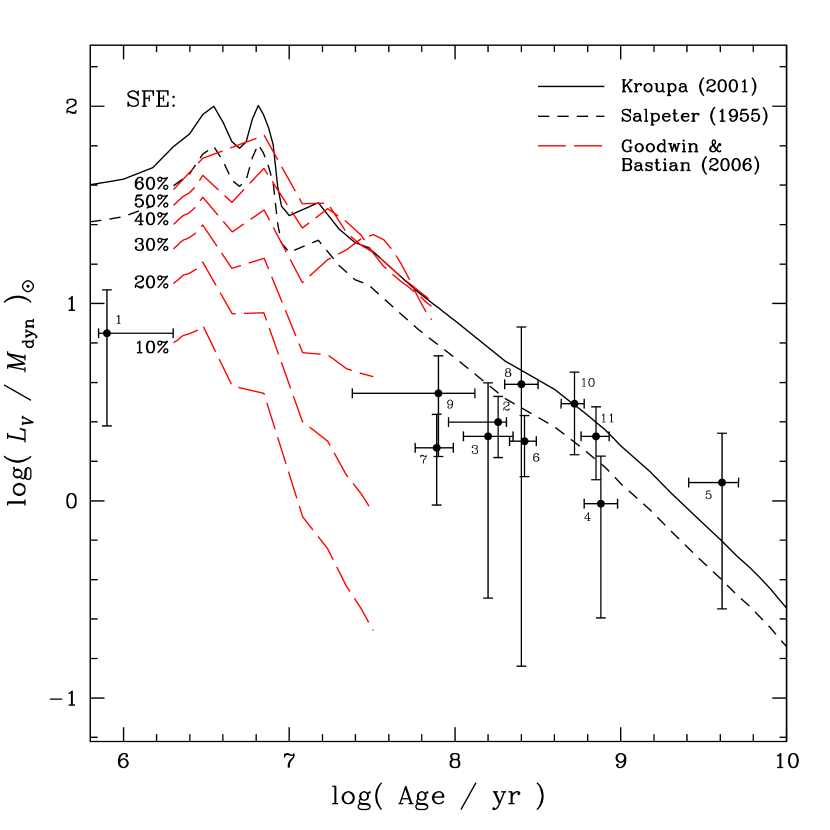
We have also included the expected evolution of clusters formed with a variety of eSFEs. Owing to the nature of our sample, only111Despite the extent of the error bar associated with the age estimates of the Pleiades, Kroupa et al. (2001) showed this cluster to have re-virialised by an age of 50 Myr, so that it is unlikely affected by the aftermath of the gas-expulsion phase. the Orion Nebula Cluster (ONC; cluster 1 in Fig. 3) is young enough so as to possibly be affected by the effects of rapid gas expulsion, as shown by the extent (in terms of age) of the long-dashed lines in Fig. 3. The majority of our sample clusters are old enough ( Myr) to have re-virialised after gas expulsion. The dynamical state of these objects is therefore dominated by the combined effects of (internal) two-body relaxation, binary motions, and external perturbations.
We note that, despite the sometimes significant uncertainties (parameter ranges) associated with the individual quantities required to calculate the dynamical ratios, the sample clusters follow the general trend predicted by the SSP models rather closely. The fact that these clusters lie close to (although systematically somewhat below) the SSP predictions should not be a suprise. Clusters significantly below the SSP lines are dynamically ‘hot’ and expected to dissolve rapidly, whilst clusters significantly above the lines will be dynamically ‘cold’ and should (re-)virialise over a few crossing times to move closer to the canonical SSP lines.
Most of the sample clusters are found somewhat below the SSP model curves. Errors in the core radii are expected to be random, and unbiased by the mass of a cluster. However, the use of the core velocity dispersions and radii may introduce a systematic bias in the dynamical mass estimates. The majority of the star clusters in the sample are older than yr, which implies that they have ages greater than their (initial) half-mass relaxation times (cf. Danilov & Seleznev 1994). Therefore, these clusters are expected to be close to energy equipartition, and thus are significantly mass segregated. Equipartition reduces the global velocity dispersion of high-mass stars relative to low-mass stars, causing high-mass stars to migrate to the cluster core. Therefore, we might expect the core velocity dispersion of low-mass cores to underestimate the dynamical mass and thus produce colder clusters – as observed.
Alternatively, the effect of binaries within clusters may well account for most of the displacement of the observed cluster positions below the model curves. Kouwenhoven & de Grijs (2008) pointed out that if the velocity dispersion of binary systems was similar to the velocity dispersion of the cluster as a whole, the observationally measured velocity dispersion would overestimate the mass of a cluster. Based on a comparison with Kouwenhoven & de Grijs (2008), it appears that the vast majority of the sample clusters are indeed expected to be binary dominated (see de Grijs et al. 2008 for details).
We also note that the cluster masses may well have been overestimated by factors of a few through the universal use of Eq. (1). In particular, for highly mass-segregated clusters containing significant binary fractions, a range of stellar IMF representations, and for combinations of characteristic relaxation time-scales and cluster half-mass radii, the adoption of a single scaling factor introduces systematic offsets. To correct for these, we would need to adopt smaller values of (e.g., Fleck et al. 2006; Kouwenhoven & de Grijs 2008), and this would thus lead to dynamical mass overestimates if were assumed.
In addition, the mass functions (MFs) of clusters will be altered due to the preferential loss of low-mass stars during two-body relaxation. This will result in an increasingly ‘top-heavy’ MF in clusters, which will raise them to lower ratios than would be expected from the canonical SSP models. The degree to which the MF will change depends on the two-body relaxation time which, to first order, depends on the mass of the cluster (and also on its size; however, we ignore this for now). Thus, low-mass clusters are expected to have top-heavy MFs as compared to high-mass clusters. Therefore, one would expect low-mass clusters to lie some way above the canonical SSP models, and high-mass clusters to lie slightly above these lines. However, the effect of binaries in clusters is to increase the observed velocity dispersion and so overestimate the masses of clusters, shifting them back down towards, and even below, the canonical SSP lines.
4 Concluding remarks
In this contribution we have explored the usefulness of the diagnostic age versus -ratio diagram in the context of YMCs and Galactic open clusters. This diagram is often used in the field of extragalactic young to intermediate-age massive star clusters to constrain the shape of their stellar IMF, as well as their stability and the likelihood of their longevity. Using the massive young Galactic cluster Westerlund 1 as a key example, we caution that stochasticity in the IMF introduces significant additional uncertainties. Therefore, the stability and long-term survival chances of Westerlund 1 remain inconclusive. Similarly, we have highlighted observational issues associated with M82-F and NGC 1140-1 which render the use of their velocity dispersions as a diagnostic tool questionable at best.
For low-mass open clusters it seems clear that the effect of binaries, mass segregation, and the dynamical alteration of mass functions by two-body relaxation are important factors that cannot be ignored. Most importantly, however, we conclude that for an open cluster to survive for any significant length of time (in the absence of substantial external perturbations), it is a necessary but not a sufficient condition to be located close to the predicted photometric evolutionary sequences for ‘normal’ SSPs. This is based on two of the sample clusters, the Coma Berenices cluster (number 10 in Fig. 3) and the Hyades (11), which are known to be in a late stage of dissolution, yet lie very close indeed to either of the evolutionary sequences defined by the Salpeter (1955) or Kroupa (2001) IMFs.
Acknowledgements.
We are grateful for helpful criticism from and useful discussions with Pavel Kroupa and Mark Gieles. MK gratefully acknowledges the organising committee for financial support to attend the meeting. We also acknowledge research support and hospitality at the International Space Science Institute in Bern (Switzerland), as part of an International Team programme.References
- [1] Barker, S., de Grijs, R., Cerviño, M., 2008, A&A, 484, 711
- [2] Bastian, N., Goodwin S. P. 2006, MNRAS, 369, L9
- [3] Bastian, N., Saglia, R. P., Goudfrooij, P., Kissler-Patig, M., Maraston, C., Schweizer, F., Zoccali, M. 2006, A&A, 448, 881
- [4] Bastian, N., Konstantopoulos, I., Smith, L. J., Trancho, G., Westmoquette, M. S., Gallagher, J. S., 2007, MNRAS, 379, 1333
- [5] Brocato, E., Castellani, V., Poli, F. M., Raimondo, G. 2000, A&AS, 146, 91
- [6] Cerviño, M., Valls-Gabaud, D. 2003, MNRAS, 338, 481
- [7] Cerviño, M., Luridiana, V. 2006, A&A, 451, 475
- [8] Danilov, V. M., Seleznev, A. F., 1994, A&AT, 6, 85
- [9] de Grijs, R., Parmentier, G. 2007, ChJA&A, 7, 155
- [10] de Grijs, R., Smith, L. J., Bunker, A., Sharp, R. G., Gallagher, J. S., Lançon, A., O’Connell, R. W., Parry, I. R., 2004, MNRAS, 352, 263
- [11] de Grijs, R., Goodwin, S. P., Kouwenhoven, M. B. N., Kroupa, P., 2008, A&A, submitted (arXiv:0803.1991)
- [12] Fleck, J.-J., Boily, C. M., Lançon, A., Deiters, S. 2006, MNRAS, 369, 1392
- [13] Goodwin, S. P., Bastian, N. 2006, MNRAS, 373, 752
- [14] Hunter, D. A., O’Connell, R. W., Gallagher, J. S. iii, 1994, AJ, 108, 84
- [15] Kouwenhoven, M. B. N., de Grijs, R. 2008, A&A, 480, 103
- [16] Kroupa, P. 2001, MNRAS, 322, 231
- [17] Kroupa, P., Aarseth, S., Hurley, J. 2001, MNRAS, 321, 699
- [18] Larsen, S. S., Brodie, J. P., Hunter, D. A. 2004, AJ, 128, 2295
- [19] Maraston, C. 2005, MNRAS, 362, 799
- [20] McCrady, N., Gilbert, A. M., Graham, J. R. 2003, ApJ, 596, 240
- [21] McCrady, N., Graham, J. R., Vacca, W. D. 2005, ApJ, 621, 278
- [22] Mengel, S., Lehnert, M. D., Thatte, N., Genzel, R. 2002, A&A, 383, 137
- [23] Mengel, S., Tacconi-Garman, L. E. 2007, A&A, 466, 151
- [24] Moll, S. L., Mengel, S., de Grijs, R., Smith, L. J., Crowther, P. A. 2008, MNRAS, 382, 1877
- [25] Piatti, A. E., Bica, E., Clariá, J. J. 1998, A&AS, 127, 423
- [26] Salpeter, E. E. 1955, ApJ, 121, 161
- [27] Smith, L. J., Gallagher, iii, J. S. 2001, MNRAS, 326, 1027
- [28] Spitzer, L., Jr. 1987, Dynamical Evolution of Globular Clusters, Princeton: Princeton University Press