0 [
]On the nature of HD 207331: a new Scuti variable
L. Fox Machado1, W. J. Schuster1, C. Zurita2, J. L. Ochoa1, and J. S. Silva1
1 Observatorio Astronómico Nacional, Instituto de
Astronomía, Universidad Nacional Autónoma de México,
Ensenada B.C., Apdo. Postal 877,
Mexico,
2 Instituto de Astrofísica de Canarias, E-38205 La Laguna,
Tenerife, Spain
Abstract
While testing a Strömgren spectrophotometer attached to the 1.5-m telescope at the San Pedro Mártir observatory, Mexico, a number of A-type stars were observed, one of which, HD 207331, presented clear indications of photometric variability. CCD photometric data acquired soon after, confirmed its variability. In order to determine its pulsation behaviour more accurately, differential photoelectric photometry was carried out for three nights. As a result of the period analysis of the light curves we have found a dominant pulsation mode at 21.1 cd-1 with an amplitude of 6 mmag. This strongly suggests that HD 207331 is a new Scuti-type pulsating star.
Individual Objects: HD 207331, BD42 4208, TYC 3196-1243-1, HD 208310, HD 209113
Introduction
The Scuti-type pulsators are stars with masses between 1.5 and 2.5 located at the intersection of the classical Cepheid instability strip with the main sequence. These variables, pulsating with radial and nonradial modes excited by the mechanism, are considered to be excellent laboratories for probing the internal structure of intermediate mass stars. Thus, any new detection of a Scuti star can be a valuable contribution to asteroseismology.
HD 207331 ( SAO 51294, BD42 4207, HIP 107557) is classified in the SIMBAD database as a normal A0 star with apparent magnitude of 8.31 mag. The Hipparcos catalogue (Perryman et al. 1997), on the other hand, lists an of 8.3970 0.0022 mag (median error), 0.019 mag (scatter), a of 8.335 0.009 mag (standard error), and a of 0.217 0.011 mag (standard error). Although it may present a possible variability given that mag and mag reported in this catalogue, no period nor classification of variability had been assigned to date.
In the present paper, a study of the photometric variability of HD 207331 is reported.
1 Observations and data reduction
The observations were carried out at the Observatorio Astronómico Nacional, San Pedro Mártir, Baja California, Mexico. The photometric variability of HD 207331 was established on the night of September 27, 2007, using the six-channel spectrophotometer attached to the H.L. Johnson 1.5-m telescope. The few data clearly show indications of photometric variability for this star.
| Star | RA | Dec | V | SpTyp | |
|---|---|---|---|---|---|
| (2000.0) | (2000.0) | (mag) | |||
| Target | HD 207331 | 21 47 02 | 43 19 19 | 8.3 | |
| Comparison | BD42 4208 | 21 47 12 | 43 19 51 | 9.4 | |
| Check | TYC 3196-1243-1 | 21 47 06 | 43 18 58 | 10.9 | - |
CCD differential photometry
CCD photometric observations of HD 207331 confirming its variability were carried out on the night of September 30, 2007, with the 0.84-m telescope. A CCD camera was used with a plate scale of /pixel. About 4 h of data were obtained using a Johnson filter.
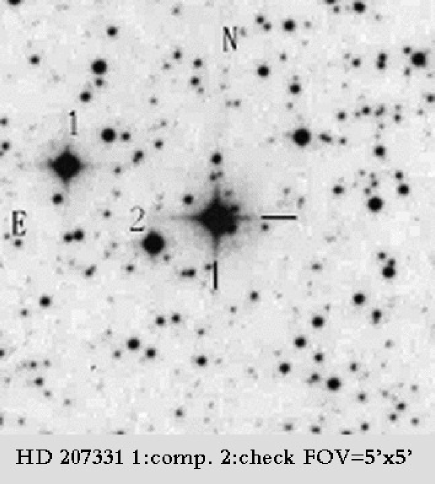
Fig. 1 shows the finding chart of HD 207331. The coordinates, magnitudes and identifications of the stars marked as 1 and 2 in Fig. 1 are listed in Table 1. The acquired images were reduced in the standard way using the IRAF package. Aperture photometry was applied to extract the instrumental magnitudes of the stars. The differential magnitudes were normalized by subtracting the mean of differential magnitudes for the night.
The differential light curve HD 207331 - Comparison is illustrated in Fig. 2. An exposure time of about 15 s was applied (these data are depicted with dots in Fig. 2). The 3 min binned data are shown by asterisks. As can be seen, the oscillations of HD 207331 are clearly inferred. The magnitude differences between the comparison and check stars were also derived in order to confirm their constancy. No indications of photometric variability for these stars were found.

differential photometry
The star was also observed during three nights in November 2007. The observations were performed with the 1.5-m telescope and the six-channel Strömgren spectrophotometer (Schuster & Nissen 1988). The observing routine consisted of five 10 s integrations of the star from which five times one 10 s integration of sky was subtracted. Two constant comparison stars were observed as well. The star was monitored for about 3.5 h on November 11, for about 4 h on November 18, and 3.5 h on November 19. A set of standard stars was also observed each night to transform instrumental observations onto the standard system. Figure 3 shows the differential light curves in the filter of HD 207331 for the three nights of our observations. The comparison star C1 is HD 208310 (BD44 3980, , spectral type A0), while the comparison star C2 corresponds to HD 209113 (BD44 4012, , spectral type A2). The light curves HD 207331 - C1 and HD 207331 - C2 are shown in the three top and three middle plots of Fig. 3 respectively, with appropriate correction for atmospheric extinction. A multiperiodic characteristic of the star with at least two beating periods can be inferred from these light curves. The CCD differential photometry already showed such behaviour for the light curve of HD 207331 (see Fig. 2).
The magnitude differences between the comparison stars, C1 - C2, were also derived in order to confirm their constancy. As can be seen in Figure 3 (the three bottom plots), no indications of photometric variability for these stars were found.

1 Absolute Strömgren photometry
Preliminary standard photometry of HD207331, taken on the same nights as the differential photometry, is the following (in mag): (, –, , ) = (8.329, 0.125, 0.150, 1.018) with the standard errors of a single observation being (, 0.002, 0.002, 0.008) for 214 observations over the three independent nights.
To deredden this photometry, the index is not very useful since HD207331 falls in the spectral range A0-A3, near the maximum of the hydrogen-line absorption, where this index is not very sensitive, changing from merely a temperature indicator for the latter stellar types to merely a luminosity indicator for the O- and B-type stars (Crawford 1978, 1979). So, a first estimate for the reddening, –, has been taken from the reddening maps of Schlegel et al. (1998) via the web-page calculator of the NED (NASA/IPAC Extragalactic Database). This reddening is then reduced by a factor , where and are the Galactic latitude and distance, respectively, assuming that the Galactic dust layer has a scale height pc. According to SIMBAD for HD207331, and for a first estimate of this star’s distance the Hipparcos parallax is used to give pc. Then, – mag, and so – mag. However, Arce & Goodman (1999) caution that the Schlegel et al. (1998) reddening maps overestimate the reddening values when the color excess – is more than mag. Hence, according to Schuster et al. (2004), a slight revision of the reddening estimate has been adopted via an equation, –– when –, otherwise ––, where – indicates the adopted reddening estimate. This leads to – mag for HD207331, and – mag, from the relation –– of Crawford (1975). Then, according to the relations: –, –, and – (Strömgren 1966, Crawford 1975), a first estimate for the dereddened photometry of HD207331 is obtained: (, –, , ) = (7.930, 0.032, 0.178, 0.999). From Table II of Crawford (1978) this leads to , and from his Table V, mag, assuming that HD207331 is of luminosity class V, leading to an improved distance of pc. This process has then been iterated twice more to a consistent solution: – mag, – mag, (, –, , ) = (7.980, 0.044, 0.174, 1.002), , mag, and pc. These final intrinsic colors of HD207331 are very consistent with the spectral type of A0 given by SIMBAD, according to Table II of Crawford (1978).
At the effective temperature of an A0-type star, the line blanketing due to metallic atomic absorption lines is negligible, and so the index of the Strömgren system is no longer useful for providing stellar metallicity measures. So, for HD207331 a solar metallicity has been assumed for the following analyses.
| Freq. | A | S/N | Var. | ||
|---|---|---|---|---|---|
| (Hz) | (mmag) | (rad) | % | ||
| 244.7 | 6.0 | -1.2 | 4.5 | 52 | |
| 311.1 | 2.9 | 0.9 | 3.7 | 20 | |
| 250.0 | 2.5 | 0.1 | 2.0 | 17 |
2 Frequency analysis
The amplitude spectra of the differential time series were obtained by means of an iterative sine wave fit (ISWF; Ponman 1981) and the software package Period04 (Lenz & Breger 2005). In both cases, the frequency peaks are obtained by applying a non-linear fit to the data. Both procedures allow to fit all the frequencies simultaneously in the magnitude domain. Since both packages yielded similar results, we present the spectral analysis only in terms of ISWF. The amplitude spectrum of the differential light curve HD 207331 - C1 is shown in the top panel of Figure 4. The subsequent panels in the figure, from top to bottom, illustrate the prewhitening process of the frequency peaks in each amplitude spectrum. The same procedure was followed as explained in Alvarez et al. (1998). In particular, according to these authors, a peak is considered as significant when the signal-to-noise ratio in amplitude is larger than 3.7. The oscillation frequencies detected in HD 207331 are listed in Table 2. S/N is the signal-to-noise ratio after the prewhitening process. Also shown is the fraction of the total variance contributed by each peak.
The highest amplitude peak is located at 244.7 Hz (21.1 cd-1), and the next significant frequency is located at 311.1 Hz (26.9 cd-1) . We note, however, that the second frequency is at the limit of our detection level. Given our poor window function, with only three nights of observations, it is not possible to detect more frequencies in HD 207331. Nevertheless, in the residual amplitude spectrum, after prewhitening , another peak at Hz seems to be present but with only a of 2.0.

3 Conclusions
We have presented an analysis of CCD observations and differential photometry of the new Scuti star HD 207331, which has been found to be a multiperiodic pulsator with at least two modes of oscillations. A first estimate for the interstellar reddening has been taken from the reddening maps of Schlegel et al. (1998) via the web-page calculator of the NED database. The resulting interstellar excess is mag, and the dereddened photometry is consistent with the classification of an early A star.
To date, our observations represent the most extensive work on HD 207331. Beyond this, more observations, better distributed in time, are needed for an improved understanding of this interesting object.
Acknowledgements.
We would like to thank the assistance of the staff of the OAN-SPM during the observations. This paper was partially supported by Papiit IN108106, and by CONACyT project 49434-F. We thank the anonymous referee for his valuable comments which helped us to improve the manuscript. ReferencesAlvarez, M., Hernández, M. M., Michel, E., et al. 1998, A&A ,340, 149
Arce, H. G., & Goodman, A. A. 1999, ApJ, 512, L135
Crawford, D. L. 1975, PASP, 87, 481
Crawford, D. L. 1978, AJ, 83, 48
Crawford, D. L. 1979, AJ, 84, 1858
Lenz, P., & Breger, M. 2005, CoAst, 146, 53
Perryman, M. A. C., Lindegren, L., Kovalevsky, J., et al. 1997, A&A, 323, L49
Ponman, T. 1981, MNRAS, 196, 583
Schlegel, D. J., Finkbeiner, D. P., & Davis, M. 1998, ApJ, 500, 525
Schuster, W. J., Beers, T. C., Michel, R., Nissen, P. E., & García, G. 2004, A&A, 422, 527
Schuster, W. J., & Nissen, P. E. 1988, A&AS, 73, 225
Strömgren, B. 1966, Ann. Rev. Astron. Astrophys., 4, 433