Orientations of very faint galaxies in the Coma cluster ††thanks: Based on observations obtained with MegaPrime/MegaCam, a joint project of CFHT and CEA/DAPNIA, at the Canada-France-Hawaii Telescope (CFHT) which is operated by the National Research Council (NRC) of Canada, the Institut National des Sciences de l’Univers of the Centre National de la Recherche Scientifique (CNRS) of France, and the University of Hawaii. This work is also partly based on data products produced at TERAPIX and the Canadian Astronomy Data Centre as part of the Canada-France-Hawaii Telescope Legacy Survey, a collaborative project of NRC and CNRS. Based on observations obtained with MegaPrime/MegaCam, a joint project of CFHT and CEA/DAPNIA, at the Canada-France-Hawaii Telescope (CFHT) which is operated by the National Research Council (NRC) of Canada, the Institute National des Sciences de l’Univers of the Centre National de la Recherche Scientifique of France, and the University of Hawaii.
Abstract
Context. Models of large scale structure formation predict the existence of preferential orientations for galaxies in clusters.
Aims. We have searched for preferential orientations of very faint galaxies in the Coma cluster (down IVega-11.5).
Methods. By applying a deconvolution method to deep u∗ and I band images of the Coma cluster, we were able to recover orientations down to very faint magnitudes, close to the faintest dwarf galaxies in the Coma cluster.
Results. No preferential orientations are found in more than 95 of the cluster area, and the brighter the galaxies, the fewer preferential orientations we detect. The minor axes of late type galaxies are radially oriented along a northeast - southwest direction and are oriented in a north - south direction in the western X-ray substructures. For early type galaxies, in the western regions showing significant preferential orientations, galaxy major axes tend to be oriented perpendicularly to the north - south direction. In the eastern significant region and close to NGC 4889, galaxy major axes also tend to point toward the two cluster dominant galaxies. In the southern significant regions, galaxy planes tend to be tangential with respect to the clustercentric direction, except close to (=194.8, =27.65) where the orientation is close to deg. Early and late type galaxies do not have the same behaviour regarding orientation.
Conclusions. Considering various models, we give an interpretation which can account for the existence of preferential orientations for galaxies (e.g. the tidal torque model or interactions with the intra cluster medium). Part of the orientations of the minor axes of late type galaxies and of the major axes of early type galaxies can be explained by the tidal torque model applied both to cosmological filaments and local merging directions. Another part (close to NGC 4889) can be accounted for by collimated infalls. For early type galaxies, an additional region () shows orientations that probably result from local processes involving induced star formation.
Key Words.:
galaxies: clusters: individual (Coma)1 Introduction
Large-scale structures are one of the major predictions of cosmological models, which reproduce well the observed galaxy filamentary structures and clusters (e.g. de Lapparent et al. 1986) are well reproduced by numerical simulations in cold dark matter models. Within these structures (filaments and clusters) galaxies evolve following several possible behaviors, influenced by the surrounding matter. One interesting characteristic of these galaxies linked with the surrounding dark matter is their orientation (e.g. Aubert et al. 2004, Pereira et al. 2008). The origin of their angular momentum and the influence of the large scale matter distribution on this angular momentum is still widely debated.
In clusters, for example, it is generally admitted that the major axis of the central galaxy tends to be aligned with the cluster axis and with the main infall direction onto the cluster (e.g. Binggeli 1982, West 1989, Trevese et al. 1992, Fuller et al. 1999, Torlina et al. 2007). This implies collimated infalls (e.g. West 1994, Dubinski 1998), linking the cluster and the central galaxy growth.
Another prediction of simulations is that the rotation axis of disk galaxies in large scale structures is perpendicular to the minor axis of the surrounding structure (e.g. Navarro et al. 2004). Considering filaments, this means that disk galaxies would be perpendicular to the filament axis (see also Kitzbichler et al. 2003). This is related to the acquisition of angular momentum through tidal torques (e.g. Peebles 1969, Coutts 1996, Navarro et al. 2004). This model predicts a merging of infalling galaxies following an axis perpendicular to the infalling direction, inducing therefore a resulting angular momentum toward the infalling direction.
Turbulence models (e.g. Shandarin 1974, Ozernoy 1978, Efstathiou & Silk 1983) predict coherent orientations of galaxies in clusters. The planes of these galaxies should be parallel to the major planes of the closest large scale structures (e.g. the closest sheet of galaxies). Another model (the hedgehog model, Godlowski et al. 1998) predicts that the galaxy planes are perpendicular to the direction pointing toward the cluster center, leading to a spherical-like infall.
In such structures, primordial alignments could be rapidly erased by strong dynamical interactions (e.g. Plionis et al. 2003) and it is not clear whether or not we should detect preferential galaxy alignments in clusters of galaxies. Galaxy orientation searches in clusters (e.g. Hawley & Peebles 1975) have indeed led to a wide variety of results: some clusters show preferential galaxy orientations (e.g. Kitzbichler et al. 2003, Plionis et al. 2003, Aryal et al. 2007 and other Aryal et al. references therein), while some others do not (e.g. Bukhari et al. 2003, Torlina et al. 2007).
Even when such alignments are detected, the results are not always similar. Studies can show alignments of galaxies towards the dominant galaxy (e.g. Yang et al. 2006, Agustsson et al. 2006), rotation axes along the direction of the surrounding large scale structure (e.g. Aryal et al. 2005a, Hu et al. 2006, Trujillo et al. 2006), or rotation axes perpendicular to the direction of the surrounding large scale structure (e.g. Aryal et al. 2005b).
The presence or not of preferential alignments and their direction seems to be related to the cluster type (see Baier et al. 2003 or Aryal et al. 2007). It also probably depends on the galaxy types (Aryal et al. 2005b) and magnitudes (Torlina et al. 2007), showing the need for a well defined sample and for a galaxy type determination before searching for preferential orientations. It is also highly desirable to have the information on the large scale structures surrounding the cluster and on the cluster building history. All these data are available only for a few clusters and we chose to concentrate here on Coma.
The Coma cluster has been widely studied in the literature (see e.g. Biviano et al. 1998 for a review), including galaxy orientation determinations. For example, Wu et al. (1997) found parallel orientations of part of the Coma spiral galaxy disks with the large scale filament joining Abell 1367 and the Coma cluster. Kitzbichler et al. (2003) detected preferential alignments for Coma galaxies located in substructures, while Torlina et al. (2007) found no significant alignments except for the dominant galaxies of the cluster. However, these studies were limited to relatively bright galaxies and we want to investigate in the present paper the faint galaxy behavior, because low mass galaxies could have been formed in halos around larger galaxies and in this case should not show any preferred alignment on a scale beyond that of the giant galaxies. For this, we analyzed a large set of galaxies in the Coma cluster, correlating the orientation information with the multicolor type of the galaxies (estimated using broad band spectral fits and called in the following spectromorphological type), the location of the X-ray gas (Neumann et al. 2003) and the known infall directions around this cluster (Adami et al. 2005). We also dedicated special care to the orientation estimate, using a deconvolution technique and a comparison with HST-ACS data.
The redshift of Coma is 0.023, and we will assume a distance to Coma of 100 Mpc, H0 = 70 km s-1 Mpc-1, , , distance modulus = 35.00. The scale is 0.46 kpc arcsec-1. All magnitudes are given in the Vega system.
2 Data and methods
2.1 Imaging data
Our data were obtained at the CFHT with the CFH12K and Megacam cameras and were fully described by Adami et al. (2006) and Adami et al. (2008), so we give here only a brief description.
The CFH12K B, V, R, and I images cover a common area of 4252 arcmin2 centered on the two major galaxies of the Coma cluster (NGC 4874 and NGC 4889). The images are made of two CFH12K pointings. The whole field was observed in four bands (B, V, and I with similar depth). The R band is slightly deeper and is complete down to R24. We excluded galaxies brighter than R=18, as well as all the areas located within 2 times the radius of R18 galaxies, in order to avoid saturation effects. This excludes in particular the regions very close to the two major galaxies.
The Megacam u∗ image covers a 11 deg2 field in a single pointing, encompassing the CFH12K field of view. It is 90 complete approximately at the same magnitude as the R band image.
In order to compute orientations for faint galaxies, we chose to limit our analysis to the two extreme bands: u∗ (with a seeing of 1.1” and which had the most homogeneous data reduction because of the single field observation) and I (which had the best seeing: 0.8” for the south and 1” for the north data). This allowed us also to investigate the wavelength dependence of the orientation determination.
2.2 Preliminary data analysis and possible biases
Before trying to compute galaxy orientations it is crucial to estimate cluster membership. Nearly all published studies are based on spectroscopic information and are therefore limited to relatively bright magnitudes. Here, we want to study galaxies as faint as M. This is obviously much too faint to allow a spectroscopic redshift measurement for the whole galaxy sample. We therefore chose to apply the photometric redshift techniques described in Ilbert et al. (2006) and Bolzonella et al. (2000), based on the spectral fitting of synthetic templates on the u∗, B, V, R, and I data. This allowed us to discriminate between galaxies at redshift greater and lower than 0.2 along the Coma cluster line of sight. We refer the reader to Adami et al. (2008) for a more detailed discussion on the accuracy of redshift estimates based on the comparison with spectroscopic redshifts.
Of course, this does not mean we completely avoid including in our sample galaxies that are at z0.2 (in the field or in loose groups) but are not part of the Coma cluster.
If we consider the field galaxy luminosity function computed by Ilbert et al. (2006) from similar data, we find that the field contribution represents about 15 of the Coma cluster galaxies down to R=24. This contribution is spread over the whole field and will act as a background contribution of randomly oriented galaxies. We could argue that filaments at z0.2 could provide preferential orientations for their galaxy populations. However, even taking the largest known cosmic bubble sizes, at least a dozen of such bubbles are superimposed between Coma and z=0.2, probably making the projected orientations close to random.
Similarly, we estimated that the contribution of galaxies in loose groups is concentrated in precise locations and represents 5 of the Coma cluster galaxies down to R=24 (Adami et al. 2008). Preferential orientations coinciding with these regions are therefore suspect, but we will show in the following that the places where such orientations are detected do not coincide with the positions of loose background groups at z0.2.
The last possible bias comes from non Coma member galaxies at z0.2 lensed by the Coma cluster mass. The redshift interval where galaxies are the most likely to be lensed is not z0.2, but we still estimate that the lensing amplitude in this redshift range is between 50 and 90 of the predicted shear for z1 galaxies. However, the amplitude of the shear remains moderate. It adds a tangential ellipticity (defined here as the minor to major axis ratio) ranging from 0.05 for objects very close to the cluster centre (1’ from the center) to less than 0.01 in the field edges. This means that for background galaxies, lensing will slightly increase our ability to detect tangential orientations while it will slightly lower our ability to detect radial orientations.
In the cluster center, this will have a strong effect only on galaxies that are not part of Coma (15 of field galaxies + 5 of loose group galaxies) with an axis ratio higher than 0.95 (less than 20 of the total sample). So lensing will affect only (15 + 5)20 5 of the total sample in the cluster center.
In the cluster outskirts, lensing will affect only the galaxies with an axis ratio higher than 0.99 (less than 2 of the total sample), so less than (15 + 5)2 1 of the total sample in the cluster outskirts.
2.3 PSF deconvolution
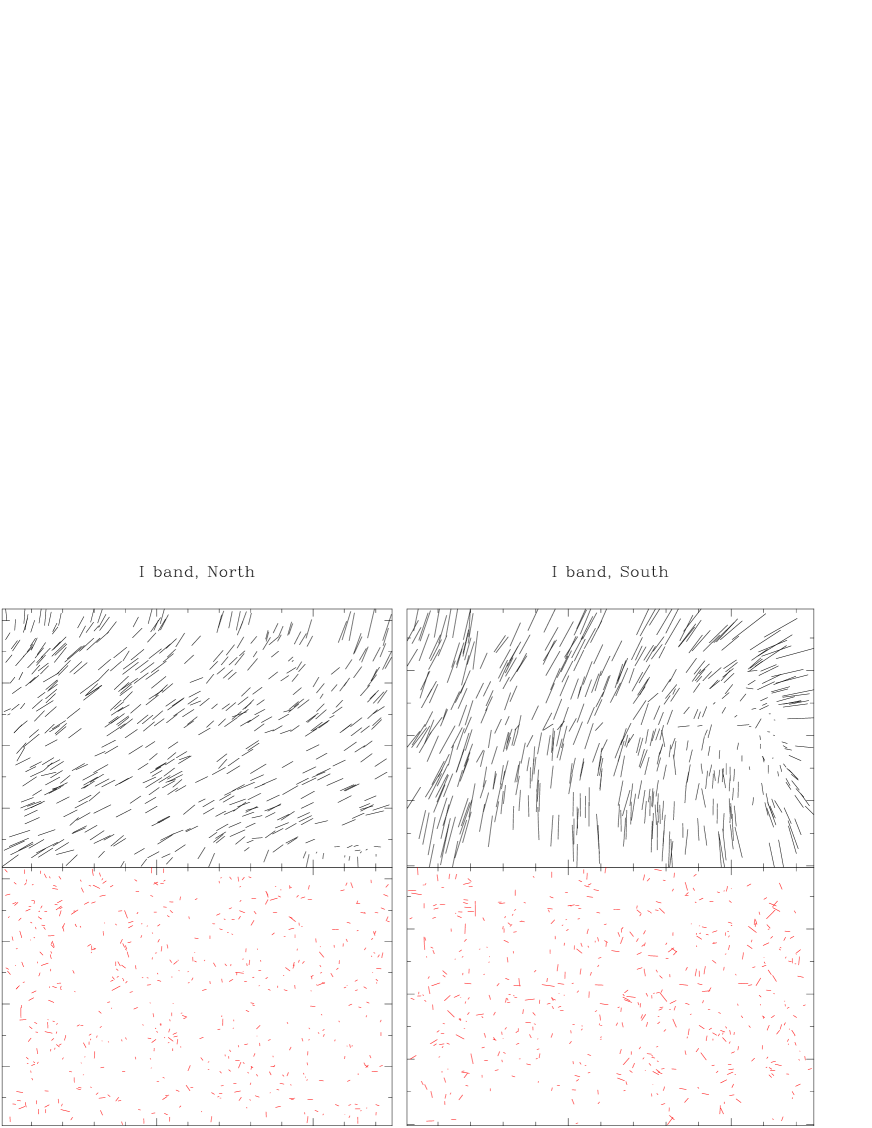
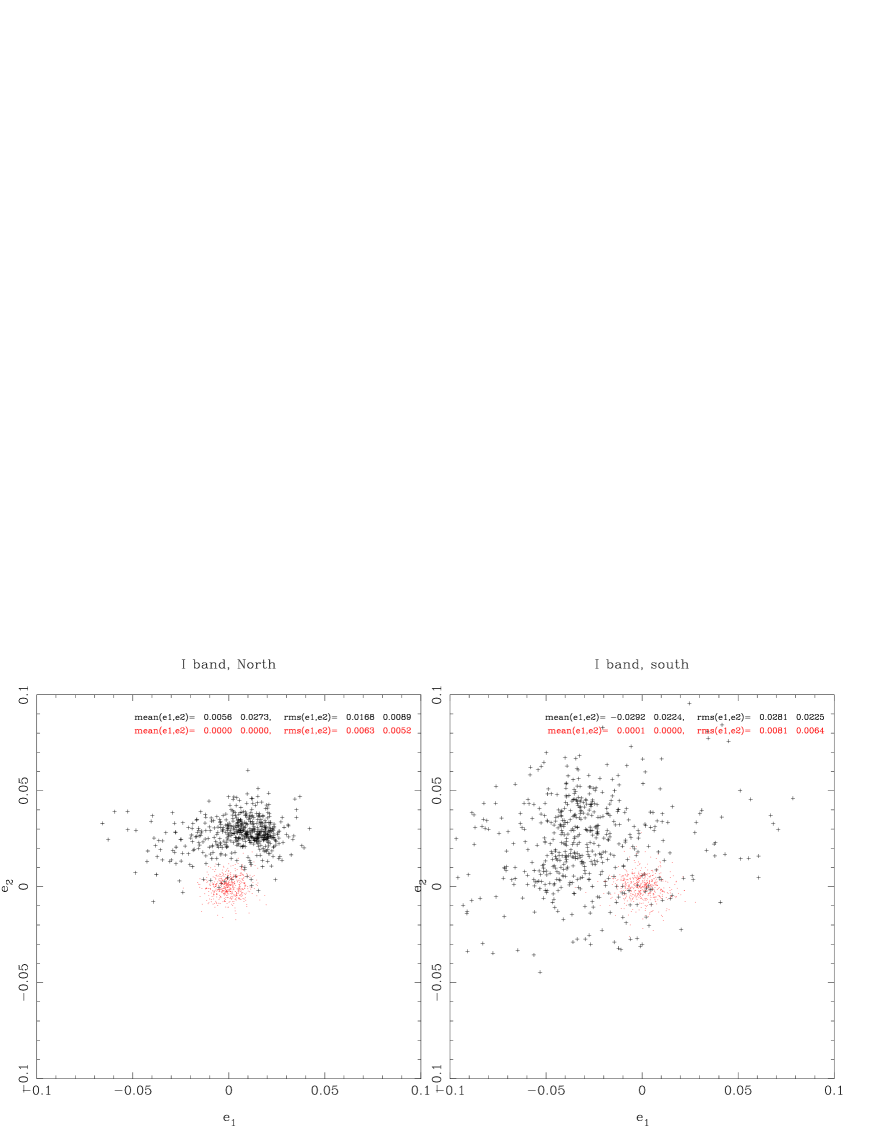
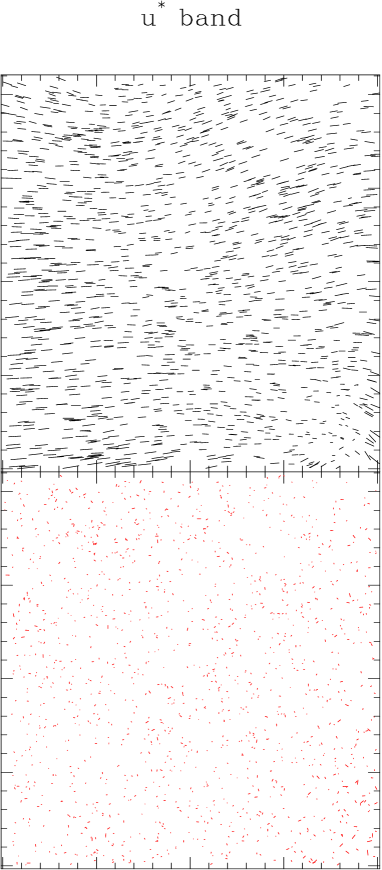
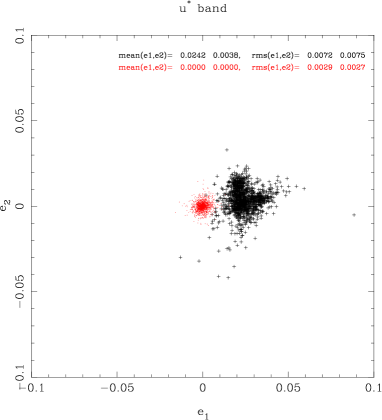
Given the magnitude range we are considering, the galaxy sizes are comparable to the seeing and therefore any attempt to measure shapes will require a correction for smearing by the Point Spread Function (PSF). The problem is very much the same as deconvolution for weak gravitational lensing measurements for which several techniques have been developed in the last 15 years. Heymans et al. (2006) and Massey et al. (2007), as part of the Shear Testing Program (STEP), proposed a comprehensive quantitative study of the merits of the currently favored methods. The one we implement here is built on the so-called KSB techniques (Kaiser et al. 1995), further complemented by Hoekstra et al. (1998). In this method, the shape (elongation, orientation) is measured through weighted moments of the surface brightness distribution of a given object on stars and galaxies. The deconvolution is performed by requiring that stellar ellipticities have no preferential orientation. The blurring effect of the PSF is also corrected for through the shear polarisability tensor (see Kaiser et al. 1995 for details). The PSF correction performed here was previously applied to CFH12K data (Gavazzi et al. 2004) as well as Megacam exposures of the CFHTLS deep survey (Gavazzi & Soucail 2007) with the aim of measuring weak gravitational lensing. The strong requirements usually imposed by weak lensing applications guarantee that PSF smearing is properly corrected for in the sample of galaxies we are considering. Although the main focus of the present work is the shape of Coma member galaxies, a detailed study of the weak lensing shear signal carried by background galaxies will be presented in a forthcoming paper along with the details of the PSF correction (Gavazzi et al. 2008, in preparation). However, in order to give a brief view of the level of control of systematic instrumental distorsions we show in Figs. 1 and 2 the shape of stars before and after PSF correction.
2.4 Orientation validity
We need to quantify the accuracy of the deconvolution method that we apply to recover orientations. This method is supposed to give a correct value for the orientation whatever the observation conditions and the instrument.
We therefore first used HST-ACS data for a small subfield (public data in the HST database, P.I. D. Carter) in order to compare non-deconvolved orientation estimates with ours. The ACS orientations were simply computed using the SExtractor package (Bertin Arnouts 1996). Our estimates in the u∗ and I bands were compared to the F475W and F814W HST filters respectively. We tested the influence of the sample magnitude limit, of the projected ellipticity on the sky and of the orientation uncertainty (given by our method) on the quality of our orientation estimates (using CFH12K and Megacam data).
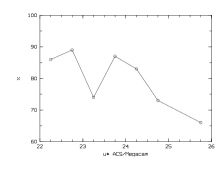
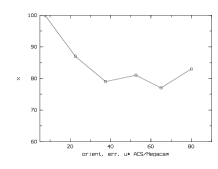
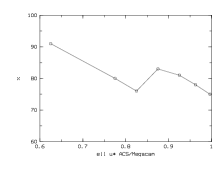
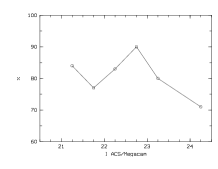
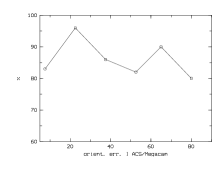
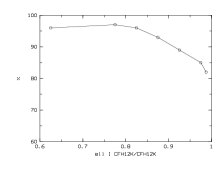
Results are given in Fig. 3 and we see that for the u∗ band, for u25 and whatever the ellipticity and the orientation uncertainty, we never have more than 30 of galaxies with orientations differing by more than 26 deg from the ACS estimates (this value of 26 deg has been chosen arbitrarily as the half of the width of a gaussian function fit to a uniform orientation distribution between and +90 deg). Considering our whole sample and simply limiting the magnitude to u∗=25 leads to 87 of our u∗ orientation estimates within 26 deg of the ACS estimates.
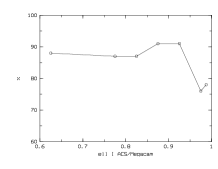
For the I band, 86 of our I orientation estimates are similar to the ACS estimates for I23.5.
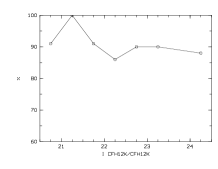
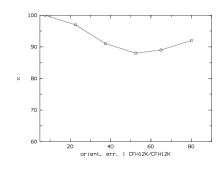
However, the HST-ACS camera is not perfect, and the previous results are an overestimate of the method uncertainties because including some intrinsic dispersion due to HST-ACS camera instrumental effects. We therefore also apply an internal comparison. If we consider the central area of the I band image that was observed twice with the CFH12K camera, we have two estimates of the orientations in this region, allowing to compute the statistical difference. This method only gives a lower value of the uncertainty due to the method, as it only tests the ground observing conditions (that vary slightly between two observations) and the CFH12K response inhomogeneities (the central field was not covered by the same parts of the camera during the two observations). On the other hand, this method does not test for example the general effect of the atmosphere. Keeping this in mind, Fig. 4 shows that the difference between the two I orientation estimates is never greater than 26 deg for more than 82 of the sample, whatever the magnitude, the ellipticity, and the orientation uncertainty. For the whole sample, we find that 91 of our I orientation estimates are similar in the two I band observations.
We therefore conclude than about 90 (a good compromise between the 86, 87 and 91 previously estimated) of our orientations are correct within 26 deg.
3 Results
In the following, orientations are counted counterclockwise from west. Each value is between +90 deg and deg.
3.1 Global settings
We search for preferential orientations of the galaxy axes with a physical meaning: the major axis for early type galaxies (prolate like objects) and the minor axis for late type galaxies (oblate like objects).
We examine possible orientations of these axes in the u∗ and I bands. The u∗ band is more sensitive to recent star formation episodes and to recently established preferential orientations while the I band is mainly sensitive to the old star population and detects preferential orientations established for a longer time. We will concentrate on galaxies fainter than I=18, beyond the usual limit for galaxy orientation studies based on spectroscopic redshifts. To our knowledge, it is the first time that a multicolor approach is applied in such a faint magnitude range.
Given the fact that preferential galaxy orientations seem to depend both on galaxy type (e.g. Aryal et al. 2005b) and magnitude (Torlina et al. 2007), we split our sample in two parts (type 1: elliptical galaxies, and types 2+3+4+5: early spiral + late spiral+irregular+starburst galaxies) based on the spectro-morphological types from Ilbert et al. (2006). We also split the samples in three magnitude bins for each of the two filters (I23.5: faint I sample, I22: bright I sample, I20: very bright I sample, u25: faint u* sample, u23.5: bright u* sample, and u22: very bright u* sample). We stress that our multicolor types are based on a color classification in a 5 magnitude space and are not real morphological types.
3.2 Detection of significant preferential galaxy orientations
The search for significant preferential galaxy orientations (whatever the axis considered, major or minor) is made in several steps for a given sample of galaxies (i.e. for a given spectro-morphological type and a given magnitude bin).
- First, considering minor or major axes, we compute a smoothed map of the galaxy orientations of the sample (the mean map in the following), using an adaptative kernel technique (e.g. Adami et al. 1998a and references therein). Each pixel of the map is set to the mean orientation value at these coordinates. The adaptative kernel technique represents a good balance between the spatial resolution and the number of individual galaxies considered to compute the mean value of the orientation in a given pixel.
- Second, using a bootstrap technique with 1000 resamplings (for a given pixel, this is equivalent to generating 1000 subsamples obtained by removing one object from the total galaxy sample contributing to this pixel) and a Kolmogorov-Smirnov test, we estimate in each pixel the mean probability (over the 1000 resamplings) for the orientation distribution in this pixel to be different from a completely random orientation distribution (with the same number of galaxies). This allows to generate maps of Kolmogorov-Smirnov probabilities to be different from random orientation distributions.
- Third, we need to quantify the probability cutoff to apply to these probability maps in order to recover the real signal (regions with preferential orientations) without adding wrong detections (regions with random galaxy orientations). The optimal probability cutoff proved to be directly related to the number of galaxies available. To assess this point, we generated fake samples of galaxy orientations using the same number of galaxies as in the real samples (within a given magnitude range and spectromorphological type range). Orientations were randomly distributed, except in 4 square regions where we imposed orientation distributions with a mean value of 0 deg and dispersions of 13, 17, 26 and 52 degrees (52 degrees being the dispersion of a uniform orientation distribution modelled by a gaussian function). In each of these 4 square regions, we added 15 of randomly distributed field galaxies in order to mimic the z0.2 field galaxies which we have in our data and which are not part of the Coma cluster. The goal is then to evaluate the optimal probability cutoff to apply in order to recover the 13, 17, and 26 degree dispersion orientation distributions, without detecting the 52 degree one (which cannot be distinguished from a completely random distribution using only the dispersion of the modelled gaussian function). Fig. 5 shows a few examples of such distributions with the recovered ones when using the optimal probability cutoffs. These cutoffs are given in Table 1. As a result, we are able to optimally recover regions with preferential orientations for the early spectromorphological types (types 1) and for the spectromorphological types 2+3+4+5.
| Sample | Bright | Faint |
|---|---|---|
| Whole | 83 | 88 |
| Types 1 | 82 | 83 |
| Types 2+3+4+5 | 82 | 82 |
3.3 Results for early spectro-morphological types.
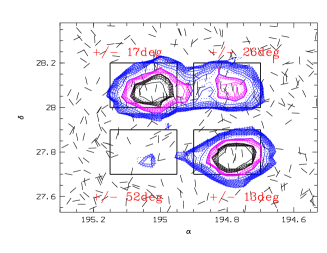
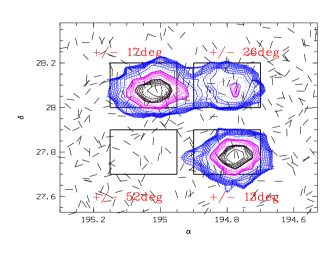
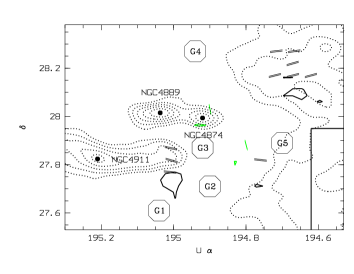
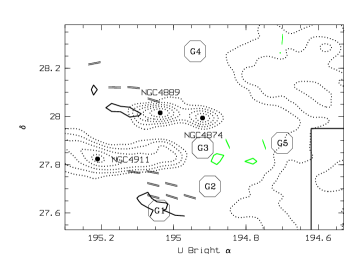
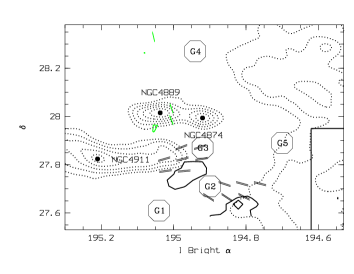
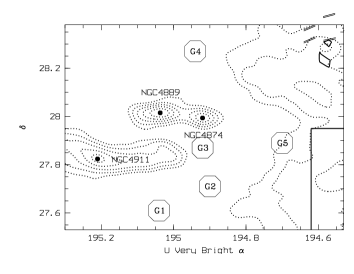
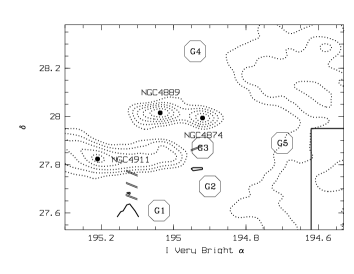
Results are displayed in Figures 6, 7, and 8. These figures show the direction of the major axis for early spectromorphological types. We only detect a few regions with significant preferential orientations, mainly south of the cluster, east of NGC 4889 and in the western X-ray substructures. In total, less than 5 of the cluster area shows preferential orientations. The very bright sample is the one that shows the least numerous regions with significant preferential orientations. For this very bright sample, we only tested the whole sample without discriminating into early and later galaxy types because the number of available galaxies was too limited to allow significant detections using the Kolmogorov-Smirnov method. However, at I the number of late type objects is limited (% from e.g. Adami et al. 1998b) and we can consider that the very bright sample is largely dominated by early type objects.
3.3.1 Western X-ray substructures and NGC 4889 vicinity.
Some regions show radial orientations of the galaxy major axis relatively to the clustercentric direction. This is mainly the case in the western X-ray substructure regions (this trend is mainly detected in the u* band data but is also marginally visible in the I band data for the faintest galaxies), in the regions east of NGC 4889 (with an orientation value close to the one provided by Kitzbichler et al. 2003 on a much brighter galaxy sample) and in the immediate vicinity of NGC 4889.
In the western regions (except for the very bright sample), the orientations of the galaxy major axes are also perpendicular to the line joining the two X-ray infalling groups detected in Neumann et al. (2003). This orientation does not agree with the tidal torque model applied to the western (towards Abell 779 and Abell 1367) or eastern (from Abell 2199) infalling cosmological directions. This orientation is probably related to the presence of the two western infalling X-ray groups. A scenario explaining this orientation would be the ongoing collapse of the two infalling groups, imposing a north - south infall direction to the tidal torque model (e.g. Navarro et al. 2004). In the eastern regions, only the NGC 4911 infalling group can explain this radial orientation, if we assume an ongoing merger of this group with the Coma cluster group number 7 detected in Adami et al. (2005).
Close to NGC 4889, this radial orientation (similar to the direction joining NGC 4889 and NGC 4874) can be explained by the collimated infalls proposed by Torlina et al. (2007).
Collimated infalls applied to local mass concentrations can also predict radial alignments of galaxy major axis toward these mass concentrations. Using the X-ray substructures as tracers of these mass concentrations, we could also interpret the orientations of the galaxies in the region close to (194.95, 27.75) as a radial orientation relative to the NGC 4911 location. However, we propose another explanation in subsection 3.3.3., involving this time tangential orientations.
3.3.2 The () region.
Several other regions in the south of the cluster show tangential galaxy major axis orientations. For example, the orientations of the galaxies in the region close to (194.95, 27.75) are tangential relative to the clustercentric direction, and in good agreement with the tidal torque model applied to a radial infall toward the Coma cluster center. This trend appears for all I magnitude ranges and for the faint galaxy sample in u*.
3.3.3 The () region.
The orientations of the major axes of the galaxies in the region close to (194.8, 27.65) are neither tangential nor radial. This region located at the south-east edge of the western X-ray subtructures shows orientations of the galaxy major axes close to deg that do not fit with any grand design model (e.g. tidal torques or collimated infalls), thus favouring a local process.
This region of preferential orientations only shows up in the I band data. Since the orientation of a given galaxy is traced by the distribution of stars preferentially emitting in a given wavelength interval, the u∗ star distribution will indicate the direction of the recently formed stars while the I band will show the direction of the old star distribution. Assuming that star formation will be induced for example by tidal forces, by dynamical friction, or by the intracluster medium pressure, we could expect to have bursts of star formation toward the direction of the motion (due to dynamical friction or to the intracluster medium pressure effect). If these bursts are strong enough, they can increase the luminosity of the galaxies along the motion directions, and therefore modify the galaxy orientation estimates. On the one hand, our data do not show preferential orientations in this region in the u∗ image; consequently, dynamical friction and the pressure effect of the intracluster medium are not strong enough to dominate the determination of the orientation. On the other hand, there are preferential orientations detected in the I band; so intracluster processes acting on galaxies must be strong enough to suppress in the young star population the orientations seen in the old star population.
3.3.4 Other regions.
We also have tangential orientations in regions close to the G1 and G4 loose groups. However, this is perhaps not related to processes acting inside the Coma cluster itself, as we do not know if the preferential orientations are due to the Coma cluster or to the loose group galaxies.
3.4 Results for late spectro-morphological types.
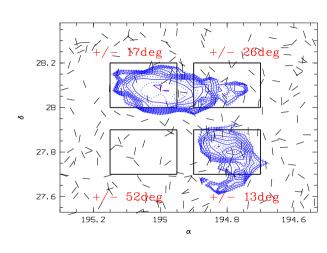
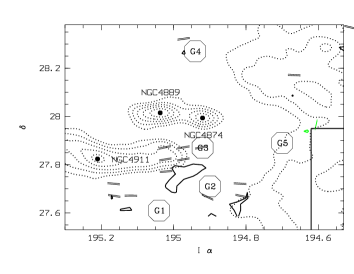
We detect preferential orientations of the minor axis only in a few regions. Along a northeast - southwest direction minor axes show radial orientations. The tidal torque model applied to the NGC 4839 cosmological infalling direction can explain this. In addition, we detect north - south orientations of minor axes in some places of the western X-ray substructures. In this case, the tidal torque model needs to be applied to a local merging direction joining the two components of the X-ray substructure.
4 Conclusions
We have analysed deep optical images of the Coma cluster and searched for preferential galaxy orientations, which are predicted by models of cluster formation. Our deconvolution method allows to recover valid orientations down to very faint magnitudes, close to the faintest dwarf galaxies in the Coma cluster.
Our main result is that more than 95 of the cluster area does not show any preferential galaxy orientations, probably due to a rapid isotropisation of the orientations. This negative result is fully consistent with the recent findings of Torlina et al. (2007) based on a H14.5 galaxy sample.
Late spectromorphological type orientations can be explained by the tidal torque model applied to the NGC 4839 infall direction and to a north - south merging direction between the two western substructures.
The occurence of regions showing significant preferential orientations for early type objects seems to increase with decreasing luminosity of the considered galaxy samples. In the western regions with significant galaxy orientations, galaxy major axes tend to be oriented perpendicularly to the north - south direction for early type galaxies and galaxy minor axes tend to be oriented along the north - south direction for late type galaxies. In the eastern region with significant galaxy orientations and close to NGC 4889 and NGC 4874, early type galaxy major axes also tend to point toward the two cluster dominant galaxies. In the southern regions with significant galaxy orientations, galaxy major axes of early type galaxies tend to be tangential regarding the clustercentric direction, except close to (=194.8, =27.65) where the orientation is close to deg. This last region shows a different behaviour in the u* and in the I band. Along a northeast - southwest direction, minor axes show radial orientations. The tidal torque model applied to infall from cosmological filaments seems to apply only in the southern regions. Applied to local merging processes, this model can explain orientations detected in the western X-ray substructures and east of NGC 4889. Finally, collimated infalls can account for orientations detected in the immediate vicinity of NGC 4889.
Most of the regions where significant preferential orientations are detected show different results for early or later type objects. This illustrates the need for a spectral or morphological classification when searching for preferential galaxy orientations. We have seen that a two band strategy (the first one being sensitive to star forming galaxies and the second to old stellar populations) also allows to infer strategic informations such as ongoing group mergings or disentangling old orientations imprinted in the old star population and recent star formation bursts acting on the young star distribution.
Acknowledgements.
We thank the referee for constructive and useful comments. We acknowledge financial support from the GDR Galaxies, INSU-CNRS. The authors are grateful to the CFHT and Terapix (for the use of QFITS, SCAMP and SWARP) teams, and to the French CNRS/PNG for financial support. MPU also acknowledges support from NASA Illinois space grant NGT5-40073 and from Northwestern University.References
- (1) Adami C., Ilbert O., Pelló R., et al., 2008, A&A submitted
- (2) Adami C., Picat J.P., Savine C.., et al., 2006, A&A 451, 1159
- (3) Adami C., Biviano A., Durret F., Mazure A., 2005, A&A 443, 17
- (4) Adami C., Mazure A., Katgert P., Biviano A., 1998, A&A 336, 63 (a)
- (5) Adami C., Biviano A., Mazure A., 1998, AA 331, 439 (b)
- (6) Agustsson I., Brainerd T.G., 2006, ApJ 644, L25
- (7) Aryal B., Paudel S., Saurer W., 2007, MNRAS 379, 1011
- (8) Aryal B., Saurer W., 2005a, MNRAS 360, 125
- (9) Aryal B., Saurer W., 2005b, AA 432, 841
- (10) Aryal B., Saurer W., 2005c, AA 432, 431
- (11) Aubert D., Pichon C., Colombi S., 2004, MNRAS 352, 376
- (12) Baier F.W., Godlowski W., Mac Gillivray H.T., 2003, A&A 403, 847
- (13) Bertin E., Arnouts S., 1996, A&AS 117, 393
- (14) Biviano A., 1998, Proc. ”A new vision of an old cluster: untangling Coma Berenices”, Marseille 17-20 June 1997, Mazure et al. Eds., p.1, World Scientific
- (15) Binggeli B., 1982, A&A 107, 338
- (16) Bolzonella M.., Miralles J.-M., Pelló R., 2000, AA 363, 476
- (17) Bukhari F.A., Cram L.E., 2003, ApSS 283, 173
- (18) Coutts A., 1996, MNRAS 278, 87
- (19) Dubinski J., 1998, ApJ 502, 141
- (20) Efstathiou G., Silk J., 1983, in The Formation of Galaxies, Fundamentals of Cosmic Physics 9, 1
- (21) Fuller T.M., West M.J., Bridges T.J., 1999, ApJ 519, 22
- Gavazzi et al. (2004) Gavazzi, R., Mellier, Y., Fort, B., Cuillandre, J.-C., & Dantel-Fort, M. 2004, A&A, 422, 407
- Gavazzi & Soucail (2007) Gavazzi, R., & Soucail, G. 2007, A&A, 462, 459
- (24) Godlowski W., Baier F., MacGillivray H., 1998, A&A 339, 709
- (25) Hawley D.L., Peebles P.J.E., 1975, AJ 80, 477
- Heymans et al. (2006) Heymans, C., Van Waerbecke L., Bacon D., et al. 2006, MNRAS, 368, 1323
- Hoekstra et al. (1998) Hoekstra, H., Franx, M., Kuijken, K., & Squires, G. 1998, ApJ, 504, 636
- (28) Hu F.X., Wu G.X.., Song G.X., Yuan Q.R., Okamura S., 2006, ApSS 302, 43
- (29) Ilbert O., Arnouts S., Mac Cracken H.J., et al., 2006, AA 457, 841
- Kaiser et al. (1995) Kaiser, N., Squires, G., & Broadhurst, T. 1995, ApJ, 449, 460
- (31) Kitzbichler M.G., Saurer W., 2003, ApJ 590, L9
- (32) de Lapparent V., Geller M., Huchra J., 1986, ApJ 302, L1
- Massey et al. (2007) Massey, R., Heymans, C., Bergé, J., et al. 2007, MNRAS, 376, 13
- (34) Navarro J.F., Abadi M.G., Steinmetz M., 2004, ApJ 613, L41
- (35) Neumann D.M., Lumb D.H., Pratt G.W., Briel U.G., 2003, AA 400, 811
- (36) Ozernoy L., 1978, in Longair M.S., Einasto J. (eds.) The Large Scale Structure of the Universe, Proc. IAU Symp. No. 79. Reidel, Dordrecht, p. 427
- (37) Peebles P.J.E., 1969, ApJ 155, 393
- (38) Pereira M.J., Bryan G.L., Gill, S.P.D., 2008, ApJ 672, 825
- (39) Plionis M., Benoist C., Maurogordarto S., Ferrari C., Basilakos S., 2003, ApJ 594, 144
- (40) Shandarin S., 1974, SvA 18, 392
- (41) Torlina L., De Propris R., West M.J., 2007, ApJ 660, L97
- (42) Trevese D., Cirimele G., Flin P., 1992, AJ 104, 935
- (43) Trujillo I., Carretero C., Patiri S.G., 2006, ApJ 640, L111
- (44) West M.J., 1994, MNRAS 268, 79
- (45) West M.J., 1989, ApJ 344, 535
- (46) Wu G., Hu F., Su H., Liu Y., 1997, A&A 323, 317
- (47) Yang X., van der Bosch F.C., Frank C., et al., 2006, MNRAS 369, 1293