High Redshift Galaxies in the Hubble Ultra Deep Field
Abstract
My dissertation presents results from three recent investigations in the Hubble Ultra Deep Field (HUDF) focusing on understanding structural and physical properties of high redshift galaxies. Here I summarize results from these studies.
Thesis work conducted at: Arizona State University, Tempe, AZ 85287
Ph.D. Thesis directed by: Rogier Windhorst and Sangeeta Malhotra
Ph.D. Degree awarded: August 2008
Subject headings:
Dissertation Summary1. Summary
In the past decade, space-based and ground-based observations of high redshift galaxies have begun to outline the process of galaxy assembly. The details of that process at high redshifts, however, remain poorly constrained. There are two major — somewhat contradicting — scenarios of galaxy assembly and formation. Many observational and theoretical predictions favor a hierarchical picture of galaxy formation, in which galaxies we observe locally were built-up by a series of mergers from smaller building blocks (e.g., Ferguson et al. , 2004; Ryan et al. , 2007), while in an alternate ‘anti’-hierarchical scenario, the most massive galaxies assemble earlier than their less massive counterparts (e.g., Heavens et al. , 2004; Panter et al. , 2007). The only way to test these or similar scenarios, and to constrain their detailed predictions, is to obtain deep multi-color imaging and study distant galaxies while they undergo such processes.
This dissertation (Hathi, 2008c) reports results from three studies in the Hubble Ultra Deep Field (HUDF; Beckwith et al. , 2006), the deepest optical data yet — which at high redshifts () corresponds to rest-frame ultraviolet data — to understand these distant galaxies. These three studies focus on understanding structural and physical properties of galaxies at and at using HUDF images and deep grism spectroscopy from the GRism ACS Program for Extragalactic Science (GRAPES; Pirzkal et al. , 2004) using Advanced Camera for Surveys (ACS) on the Hubble Space Telescope (HST).
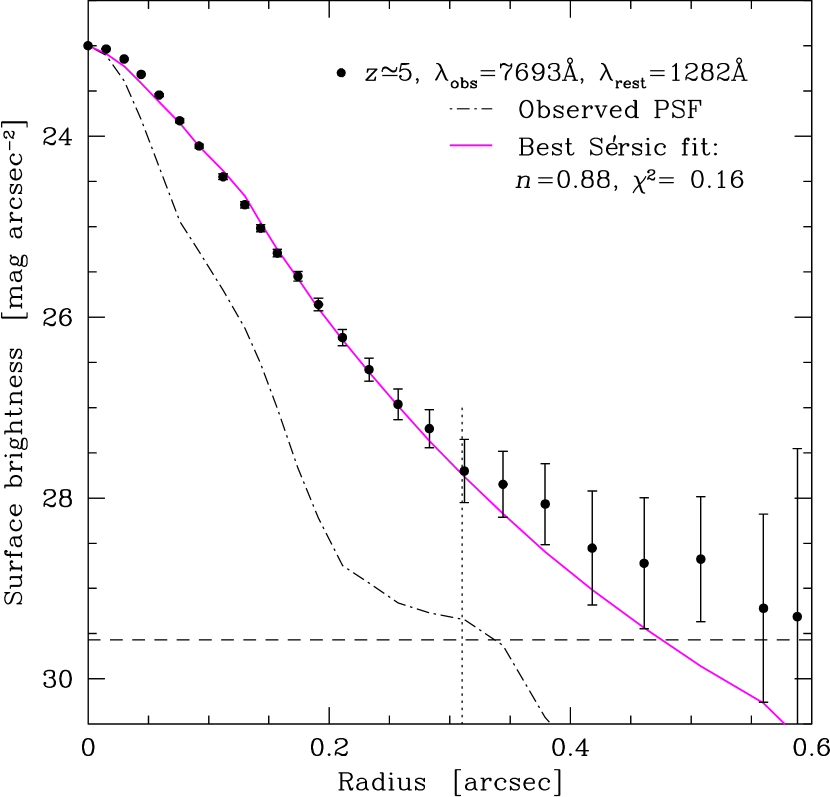
The HUDF contains a significant number of -, - and -band dropout objects (e.g., Beckwith et al. , 2006), many of which were recently confirmed to be young star-forming galaxies at . These galaxies are too faint individually to accurately measure their radial surface brightness profiles. Their average surface brightness profiles are potentially of great interest, since they may contain clues to the time since the onset of significant galaxy assembly. In Hathi et al. (2008a), we separately co-add -, - and -band HUDF images of sets of and objects, pre-selected to have nearly identical compact sizes and the roundest shapes. From these stacked images, we are able to study the averaged radial structure of these objects at much higher signal-to-noise ratio than possible for an individual faint object. In this study, we explore the reliability and usefulness of a stacking technique of compact objects at in the HUDF. Our results are: (1) image stacking provides reliable and reproducible average surface brightness profiles; (2) the shape of the average surface brightness profile (see, e.g., Figure 1) shows that even the faintest objects are resolved and that the inner regions are well represented by disk-like Sérsic profiles; and (3) assuming late-type galaxies dominate the population of galaxies at , as previous HST studies have shown for , dynamical age estimates for these galaxies from their profile shapes are comparable with the Spectral Energy Distribution (SED) ages obtained from the broadband colors. We also present accurate measurements of the sky-background in the HUDF and its associated 1 uncertainties.
Starbursts are regions of intense massive star formation that can dominate a galaxy’s integrated spectrum. By comparing the properties of starbursts over a wide range of redshifts, we can test whether the most intense star formation events look the same throughout the observable history of the universe. In Hathi et al. (2008b), we study the surface brightness properties of 47 spectroscopically confirmed starburst galaxies at , from the GRAPES project (Malhotra et al. , 2005; Rhoads et al. , 2008). We find that the peak star formation intensity (L⊙ kpc-2) in starburst galaxies does not vary significantly from the local universe to redshift . We arrive at this conclusion through new surface brightness measurements of 47 starburst galaxies at (Figure 2), doubling the redshift range for such observations. The starburst intensity limit for galaxies at agree with those at and (Meurer et al. , 1997) to within a factor of a few, after correcting for cosmological surface brightness dimming and for dust. The most natural interpretation of this constancy over cosmic time is that the same physical mechanisms limit starburst intensity at all redshifts up to (be they galactic winds, gravitational instability, or something else). We also see two trends with redshift: First, the UV spectral slope () of galaxies at is bluer than that of galaxies, suggesting an increase in dust content over time. Second, the galaxy sizes from to scale approximately as the Hubble parameter . Thus, galaxies at are high redshift starbursts, much like their local analogs except for slightly bluer colors, smaller physical sizes, and correspondingly lower overall luminosities.

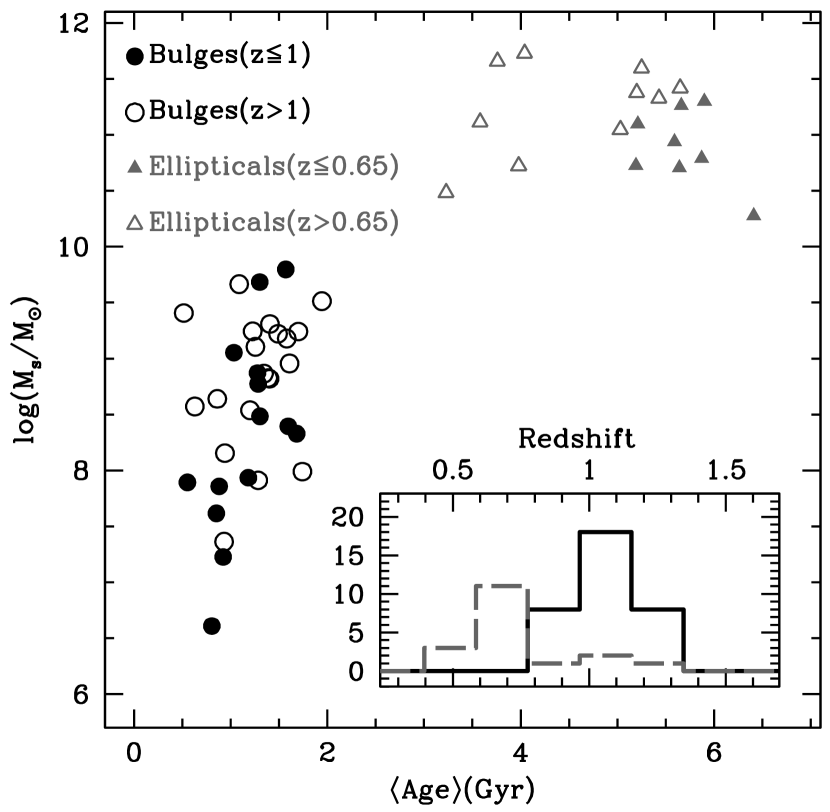
In Hathi et al. (2009), we combine HUDF images and GRAPES grism spectroscopy to explore the stellar populations of 34 bulges belonging to late-type galaxies at . The sample is selected based on the presence of a noticeable 4000 Å break in their GRAPES spectra, and by visual inspection of the HUDF images. The HUDF images are used to measure bulge color and Sérsic index. The narrow extraction of the GRAPES data around the galaxy center enables us to study the spectrum of the bulges in these late-type galaxies, minimizing the contamination from the disk of the galaxy. We use the low resolution () SEDs around the 4000 Å break to estimate redshifts and stellar ages. The SEDs are compared with models of galactic chemical evolution to determine the stellar mass, and to characterize the age distribution. We find that, (1) the average age of late-type bulges in our sample is 1.3 Gyr with stellar masses in the range 106.5–1010 M⊙. (2) Late-type bulges are younger than early-type galaxies at similar redshifts and lack a trend of age with respect to redshift, suggesting a more extended period of star formation (Figure 3). (3) Bulges and inner disks in these late-type galaxies show similar stellar populations, and (4) late-type bulges are better fitted by exponential surface brightness profiles. The overall picture emerging from the GRAPES data is that, in late-type galaxies at , bulges form through secular evolution and disks via an inside-out process.
References
- Beckwith et al. (2006) Beckwith, S., Stiavelli, M., Koekemoer, A. M., et al. 2006, AJ, 132, 1729
- Ferguson et al. (2004) Ferguson, H. C., Dickinson, M., Giavalisco, M., et al. 2004, ApJ, 600, L107
- Hathi et al. (2008a) Hathi, N. P., Jansen, R. A., Windhorst, R. A., et al. 2008a, AJ, 135, 156
- Hathi et al. (2008b) Hathi, N. P., Malhotra, S., & Rhoads, J. E. 2008b, ApJ, 673, 686
- Hathi (2008c) Hathi, N. P. 2008c, Ph.D. Thesis, Arizona State University
- Hathi et al. (2009) Hathi, N. P., Ferreras, I., Pasquali, A., et al. 2009, ApJ, in press (arXiv:0805.0791)
- Heavens et al. (2004) Heavens, A., Panter, B., Jimenez, R., et al. 2004, Nature, 428, 625
- Malhotra et al. (2005) Malhotra, S., Rhoads, J. E., Pirzkal, N., et al. 2005, ApJ, 626, 666
- Meurer et al. (1997) Meurer, G. R., Heckman, T. M., Lehnert, M. D., et al. 1997, AJ, 114, 54
- Panter et al. (2007) Panter, B., Jimenez, R., Heavens, A. F., et al. 2007, MNRAS, 378, 1550
- Pasquali et al. (2006) Pasquali, A., Ferreras, I., Panagia, N., et al. 2006, ApJ, 636, 115
- Pirzkal et al. (2004) Pirzkal, N., Xu, C., Malhotra, S., et al. 2004, ApJS, 154, 501
- Rhoads et al. (2008) Rhoads, J. E., Malhotra, S., Pirzkal, N., et al. 2008, ApJ, submitted (arXiv:0805.1056)
- Ryan et al. (2007) Ryan, R. E., Jr., Hathi, N. P.; Cohen, S. H., et al. 2007, ApJ, 668, 839