Coordinated multi-wavelength observations of Sgr A*
Abstract
We report on recent near-infrared (NIR) and X-ray observations of Sagittarius A* (Sgr A*), the electromagnetic manifestation of the 4106M⊙ super-massive black hole (SMBH) at the Galactic Center. The goal of these coordinated multi-wavelength observations is to investigate the variable emission from Sgr A* in order to obtain a better understanding of the underlying physical processes in the accretion flow/outflow. The observations have been carried out using the NACO adaptive optics (AO) instrument at the European Southern Observatory’s Very Large Telescope (July 2005, May 2007) and the ACIS-I instrument aboard the Chandra X-ray Observatory (July 2005). We report on a polarized NIR flare synchronous to a 81033 erg/s X-ray flare in July 2005, and a further flare in May 2007 that shows the highest sub-flare to flare contrast observed until now. The observations can be interpreted in the framework of a model involving a temporary disk with a short jet. In the disk component flux density variations can be explained due to hot spots on relativistic orbits around the central SMBH. The variations of the sub-structures of the May 2007 flare are interpreted as a variation of the hot spot structure due to differential rotation within the disk.
1 Introduction
The investigation of the dynamics of stars has provided compelling evidence for the existence of a super massive black hole (SMBH) at the center of the Milky Way. At a distance of only 8 kpc a SMBH of mass 4106M⊙ can convincingly be identified with the compact radio, infrared, and X-ray source Sagittarius A* (Sgr A*; Eckart & Genzel 1996, Genzel et al. 1997, 2000, Ghez et al. 1998, 2000, 2004ab, 2005, Eckart et al. 2002 , Schödel et al. 2002, 2003, Eisenhauer et al. 2003, 2005). Additional strong evidence for a SMBH at the position of Sgr A* came from the observation of flare activity on hourly time scales both in the X-ray and NIR wavelength domain (Baganoff et al., 2001; Genzel et al., 2003; Ghez et al., 2004).
Due to its proximity Sgr A* provides us with a unique opportunity to understand the physics and possibly the evolution of SMBHs at the nuclei of galaxies. Sgr A* is remarkably faint ( of the Eddington rate) in all wavebands. Its surprisingly low luminosity has motivated many theoretical and observational efforts in the past decade to explain the processes that are at work in the immediate vicinity of Sgr A*. By now, it is generally accepted that its feeble emission is due to a combination of a low accretion rate with a low radiation efficiency. An intense discussion among the theoretical community at present focuses on radiatively inefficient accretion flow and jet models. For a recent summary of accretion models and variable accretion of stellar winds onto Sgr A* see Yuan (2006), Cuadra & Nayakshin (2006).
The first successful simultaneous NIR/X-ray campaigns combined NACO and Chandra as well as mostly quasi-simultaneous mm-data from BIMA, SMA, and VLA (Eckart et al. 2004, 2006a). The NIR/X-ray variability is probably also linked to the variability at radio through sub-millimeter wavelengths showing that variations occur on time scales from hours to years (Bower et al. 2002, Herrnstein et al. 2004, Zhao et al. 2003, 2004, Mauerhan 2005, Marrone et al. 2008, Yusef-Zadeh et al. 2008).
The temporal correlation between rapid variability of the near-infrared (NIR) and X-ray emission suggests that the emission showing arises from a compact source within a few ten Schwarzschild radii of the SMBH (Eckart et al. 2004, Eckart et al. 2006a). In this work, we assume for Sgr A* =2=2GM/c28 as, with being one Schwarzschild radius and the gravitational radius of the SMBH. For several simultaneous flare events the authors found no time lag larger than an upper limit of 10 minutes, mainly constrained by the required binning width of the X-ray data. The flaring state can be explained with a synchrotron self-Compton (SSC) model involving up-scattered sub-millimeter photons from a compact source component. Inverse Compton scattering of the THz-peaked flare spectrum by the relativistic electrons then accounts for the X-ray emission. This model allows for NIR flux density contributions from both the synchrotron and SSC mechanisms. Observations for red and variable NIR flare spectra (Eisenhauer et al. 2005, Hornstein et al. 2007, Gillessen et al. 2006) are indicative of a possible exponential cutoff of the NIR/MIR synchrotron spectrum (Eckart et al. 2004).
There is also evidence for a modulation of the NIR emission that may be due to hot spots orbiting Sgr A* in the accretion flow (Genzel et al. 2003, Eckart et al. 2006b, 2008, Meyer et al.2006ab, 2007, Karas et al. 2008). The NIR flare emission is polarized with a well limited range over which the position angle of the polarized emission is changing (60o20o) (Eckart et al. 2006b, Meyer et al. 2006ab, 2007). All these observations can be explained within a model of a temporary accretion disk that occasionally contains one or several bright orbiting hot spot(s), possibly in conjunction with a short jet, and suggest a stable orientation of the source geometry over the past few years.
The millimeter/submillimeter wavelength polarization of Sgr A* is variable in both magnitude and position angle on timescales down to a few hours. Marrone et al. (2007) present simultaneous observations made with the Submillimeter Array polarimeter at 230 and 350 GHz with sufficient sensitivity to determine the polarization and rotation measure at each band. From their measurements they deduce an accretion rate that does not vary by more than 25% and - depending on the equipartition constraints and the magnetic field configuration - amounts to 210-5 to 210-7 M⊙ yr-1. The mean intrinsic position angle is 167∘7∘ with variations of 31∘ that must originate in the sub-millimeter photosphere of SgrA*.
Here, we present data and modeling for three events: polarimetric NIR observations of a very bright flare from May 2007, and Chandra X-ray measurements from 2005 and 2004 that were taken in parallel with NIR photometric and polarimetric measurements of flares reported by Eckart et al. (2006ab). In Section 2 we summarize the observations and the data reduction. The observational results and modeling of the data are presented in Section 3 and a more general discussion of available infrared and X-ray variability data on Sgr A* is given in Section 4. In section 5 we briefy discuss the interaction of the GC ISM with a potential wind/partly collimated outflow that originates in the vicinity of Sgr A*. In section 6 we summarize our findings and draw some conclusions.
2 Observations and Data Reduction
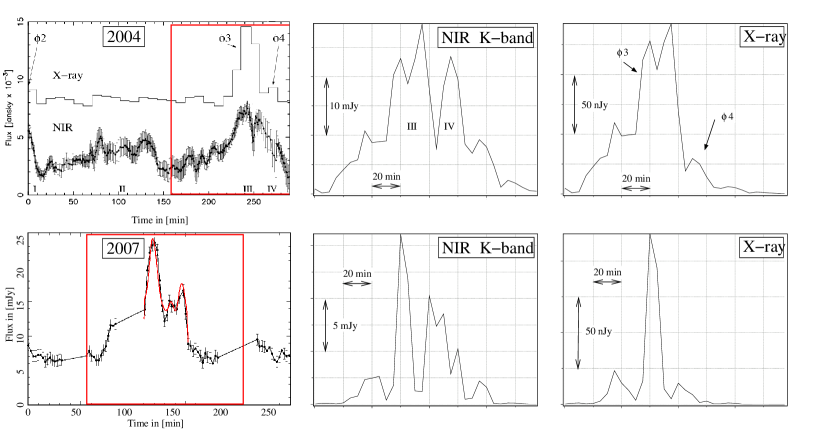
Embedded in coordinated, multi-wavelength campaigns, Sgr A* was observed in July 2005 and May 2007 , using the VLT111Based on observations at the Very Large Telescope (VLT) of the European Southern Observatory (ESO) on Paranal in Chile; Program: 075.B-0093. Simultaneous X-ray observations were carried out with the Chandra observatory in july 2005 (see below). The NIR lightcurves of Sgr A* are depicted in Fig. 1. Details of the observations and data reduction are given in Eckart et al. (2008) and Eckart et al. (2006b).
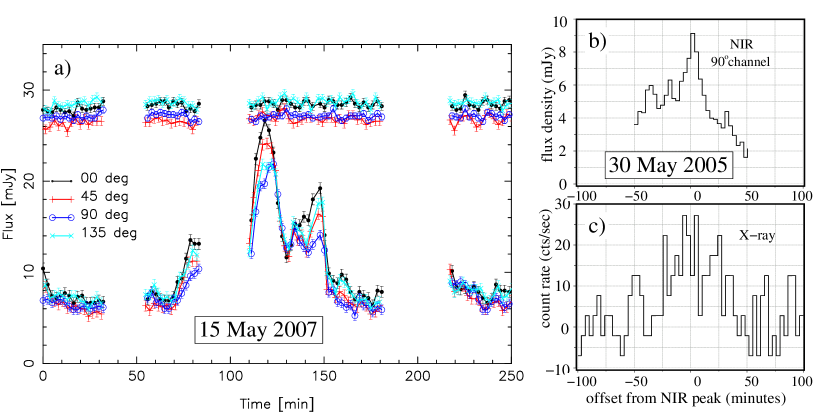
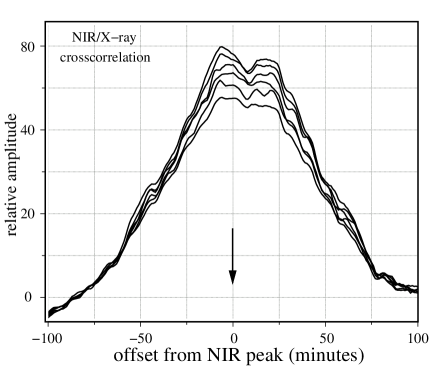
The Chandra X-ray data fully cover the observed polarized NIR flare that we observed at the VLT in July 2005. The X-ray data show a 81033 erg/s flare that is about 3 times as bright as the quiescent emission from SgrA*. In the right panels of Fig. 1 we show corresponding X-ray and NIR lightcurves using a 207 second bin size. The cross-correlation of the X-ray data with the flux densities in the individual NIR polarization channels shows that the flare event observed in the two wavelength bands is simultaneous to within less than 10 minutes. The two sub-peaks in the cross-correlation function correspond to two apparent sub-peaks in the X-ray light curve that can, however, not be taken as significant given the SNR of 3 cts/s per integration bin In the X-ray domain there is no clear indication for a sub-flare structure as observed in the NIR. The NIR sub-flare contrast defined as the sub-flare height divided by the height of the overall underlying flare flux density ranges between 0.3 and 0.9.
3 Modeling
3.1 Basic building block of relativistic disk modeling of the flares
We interpret our polarized infrared flare events via the emission of spots on relativistic orbits around the central SMBH in a temporary disk (Eckart et al. 2006b, Meyer et al. 2006ab, 2007). The model calculations are based on the KY-code by Dovciak, Karas, & Yaqoob (2004) and are usually done for a single spot orbiting close to the corresponding last stable orbit. The possibility to explore effects of strong gravity via time-resolved polarimetrical observations of X-rays (which also inspired writing the KY code) was originally proposed by Connors & Stark (1977). The amplification light curves for individual hot spots that can be computed with the KY code are used as the basic building blocks of our models, because even a complicated (non-axisymetric) pattern on the disk surface can be represented as a suitable combination of emitting spots. At this point we just remind the reader that relativistic effects actually do not produce polarization by themselves, rather they can change the polarization angle and the the overall polarization degree of an intrinsically polarized signal because each photon experiences a different gravitational effect along its path from the point of emission to the observer. In case of a single spot as a source of the emission, the observed polarization vector is expected to wobble or rotate as a function of the spot phase. This is a purely geometrical effect connected with the presence of strong gravitational field. Naturally, the intrinsic changes of the spot polarization are superposed on top of this relativistic effect.
3.2 A multi component disk model
The observed NIR/X-ray properties of the SgrA* light curves raise a number of questions: Can we expect a sub-flare structure in the X-ray domain using a synchrotron self-Compton model? What is the approximate flux distribution within a temporary accretion disk around Sgr A*? This is also closely related to more general questions of how the observed light curve properties vary if the life time of the spot, shearing, and synchrotron cooling time scales are considered. In the following we describe an extended SSC model that includes a disk structure that is composed of a combination of hot spots of different brightness and with different initial orbital locations (see section above). Our model allow us to calculate light curves in the NIR and X-ray domains in order to discuss the questions posed above. A detailed description of the used SSC model is given in Eckart et al. (2006a).
3.3 The SSC disk model
In order to explain the time dependent flare properties we assume that the sub-flare and disk component can be described by a number of individual synchrotron and SSC emitting source components. Combining the light amplification curve for individual orbiting spots and a simple SSC model, we can obtain zero order time dependent flare characteristics from the NIR to the X-ray domain.
As a starting point we used synchrotron models that represent a high flux density, i.e. flaring, and a low flux density state. Greenhough et al. (2001) outline the importance of scaling properties of the transport processes operating within accretion disks. Pessah et al. (2007) present a scaling law between magnetic stress in units of the gas pressure and the vertical disk cell size in units of the pressure scale height implying that the magnetic field and source component size follow a power law relation. Therefore we assume that the essential quantities of the SSC models, i.e. the turnover flux density and frequency as well as the source size of the individual source components are distributed as power laws with the boundary values taken from the high and low flux density state models. The corresponding power-law indices of the distribution are , and :
For example, if the flux densities of the source components are distribted over the full range between the minimum and maximum values with equal frequencies. For and there is an increasing preference towards larger and lower flux density values, respectively. Similarly this is true for and .
The innermost stable circular orbit (ISCO) around a non-rotating black hole with spin parameter =0 is 6. Assuming the co-rotating case, that radius will shrink for higher spin parameters. For a rotating black hole with =0.5 the ISCO is 4.4. Model calculations have shown (Meyer et al. 2006ab) that for Sgr A* spin parameters and source components orbiting at radii larger than the ISCO are very likely It was furthermore shown that the disk is small with an outer disk radius extending not much further than 2 beyond the ISCO. With source component sizes of the order of 1.5 (Meyer et al. 2006ab) we can safely assume that the disk is well sampled using a total of 10 Gaussian shaped disk sections with random values of , taken from the described power law distributions in order to model the entire accretion disk (see Eckart et al. 2008 for more details). The brightest of these sections will then represent the orbiting spot and the rest will account for the underlying disk. This setup will, of course, also allow for several bright spots. As a simple - but still general - model we assumed the source components to be equally spaced along the circumference of a constant orbit. While orbiting, the flux density of each component will follow the achromatic magnification curves that can be calculated as a function of the spin parameter , inclination and orbital radius with the KY code as described in section 3.1. In order to model the limited lifetims of the spots we apply a Gaussian shaped weighting function with a FWHM of about 3 orbital periods, which resembles the observed flare lengths quite well. The combination of these weighting functions cover the overall flare. The model implies the that the life time of spots is short with respect to the orbiting time scale and the overall flare duration and that new hot spots have to be created. It is not yet clear what kind of process would be the best one to describe the creation and subsequent extinction of the spots. The assumption that spots arise as being statistically independent on each other is a reasonable first approximation, however, it is quite likely that some kind of relationship between the spots will have to be included, for example within the framework of the avalanche mechanism (Pechacek et al. 2008).
3.4 Results of the Modeling
An important result of the simulations is that not only the observed total NIR and X-ray flux densities can be successfully modeled but also the observed sub-flare contrast. In addition, the best fits to the NIR and X-ray flux densities lie within or close to regions of high NIR flux density weighted magnetic field strength. Under the assumption that the NIR polarization measurements are being used - the NIR flux density weighted magnetic field strength then represents the magnetic field value that is most likely to be measured. This demonstrates that the combination of the SSC modeling and the idea of a temporary accretion disk can realistically describe the observed NIR polarized flares that occur synchronous with the 2-8 keV X-ray flares.
We find that the power-law index of the assumed power law distribution for the synchrotron peak flux Sm results in best model results for values around =-11. A value of =0 (which is included in this range) represents secnarios in which source components cover the entire range of possible flux densities with an equal probability for each value rather than being biased in a way that the components have a large probability of having similar brightness. Values of 0 provide high sub-flare contrast values. An exponent of =-1 favors a higher frequency of lower flux density values. In the SSC model high contrast is provided by the SSC contribution to the NIR spectral range, also allowing for -fits at lower flux density weighted magnetic field strengths around 30 G rather than 60 G as for the synchrotron model.
Magnetic field strengths between 5 and 70 Gauss (Eckart et al. 2006a, 2008, Yusef-Zadeh et al. 2008) are consistent with sub-mm/mm variability timescales of synchrotron components with THz peaked spectra and the assumption that these source components have an upper frequency cutoff in the NIR, i.e. that they contribute significantly to the observed NIR flare flux density. Here the upper frequency cutoff to the synchrotron spectrum is assumed to be at in Hertz, with the magnetic field strength in Gauss. The Lorentz factor corresponds to the energy at the upper edge of the electron power spectrum. For 103 and B around , the synchrotron cutoff falls into the NIR. In order to match the overall typical flare timescale of about 2 hours and given a minimum turnover frequency around 300 GHz the minimum required magnetic field strength is of the order of a 5 Gauss. This is required as a minimum value to have the cooling time of the overall flare less than the duration of the flare (Yuan, Quataert, Narayan 2003, 2004, Quataert 2003).
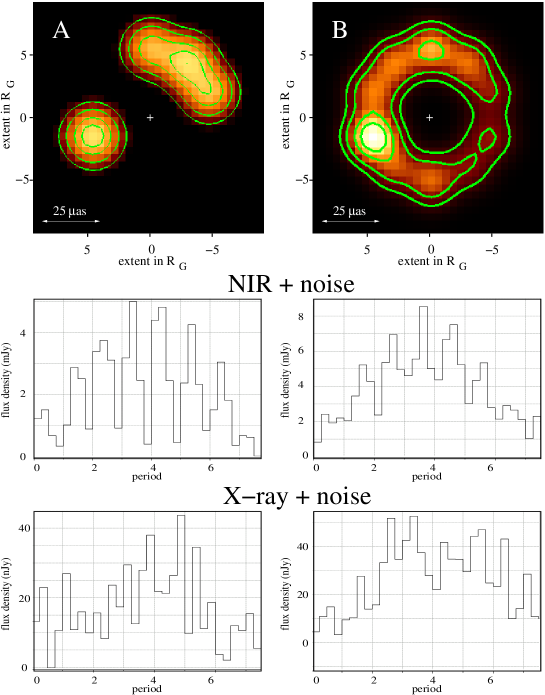
After adding appropriate noise (estimated from the available X-ray data) to the X-ray modeling results it becomes apparent that at the given SNR and data sampling short term variability in the X-ray data are difficult to determine, even if they have a modulation contrast similar to that observed in the NIR (see Fig. 3). Bright spots may on average have smaller sizes or lower cutoff frequencies. An increase of SSC X-ray flux density due to an increase of THz peak synchrotron flux may be compensated by this effect. Hence the sub-flare contrast may be much lower in the X-ray compared to the NIR domain.
In Fig. 5 we show the modeling results for the May 2007 NIR and the July 2004 (see Eckart et al., 2006a) simultaneous NIR/X-ray data on SgrA* using our time dependent flare emission model. For the 2007 data we implemented a double hot spot model in the KY code that was briefly described in Section 3.1. For the 2004 data we involved a model consisting of 7 components at increasing distances from the SMBH starting at the inner last stable orbit. The components line up close to the line of sight on opposite sides of the SMBH close to the flare center in time. This corresponds to a relative minimum in the light curve. This arrangement of source components therefore provides a maximum amount of Doppler amplification before and after this alignment by either one or the other component. This gives rise to the two NIR flare events labeled III and IV (Eckart et al. 2006a).
Motivated by the fact that the May 2007 data show evidence for hot spot evolution due to differential rotation within the relativistic disk, we assumed that an increase of the source size of the individual spots may be of importance during the flare events. Therefore, starting at the center of the July 2004 flare event, we assumed in both cases a 30% increase of the source component sizes over 30 to 40 minutes, i.e. about two orbital time scales. This results in a sharp decrease of the SSC X-ray flux density and therefore in a very good representation of the 2004 measurements (see X-ray flares labeled 3 and 4 in Fig. 5 and Eckart et al. (2006a). Based on these time dependent model assumptions we would have expected a similar evolution of the X-ray flare light curve for the May 2007 NIR observations as shown in the bottom right panel of Fig. 5.
Such a scenario may also explain the 2006 July 17 Keck NIR/X-ray light curves reported by Hornstein et al. (2007). The authors measured an NIR flare without a detectable X-ray counterpart. It was delayed by about 45 minutes from a significant X-ray flare, during which no NIR data were taken. Assuming that the X-ray flare was accompanied by an unobserved NIR flare as well, this event may have been very similar in structure to the July 2004 flare.
3.5 Sub-flares and quasi-periodicity
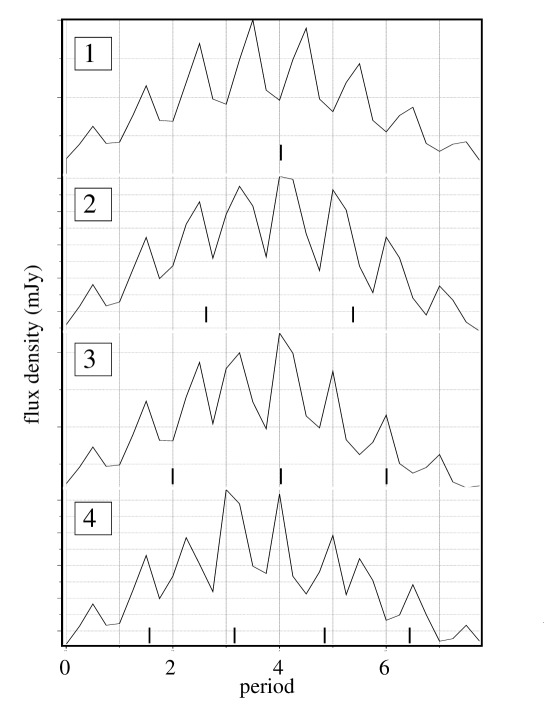
For Fig. 4 we calculated 2.2m light curves under the assumption of decreasing times scales for the magneto-hydro-dynamical stability of the source components in the accretion disk around SgrA*. The thin vertical lines mark the centers of stability intervals with Gaussian shaped flux density weights. These Gaussian shaped weights cover a time time interval over which source components can be considered as being stable. Between such time intervals new source components within the accretion disk are being formed. The marks are spaced by a FWHM of the individual Gaussians. This arrangement results in light curves similar to the observed ones (see Eckart et al. 2008 for more details). We assumed that for each of these intervals the flux density distribution within the disk is different. This results in phase shifts between the light curves (i.e. different positions of the spot within the disk) of . This simulation shows that the overall appearance (especially the mean QPO frequency) of the light curve can be preserved and that variations in the sub-flare amplitude and time separations can be explained by such a scenario. In Fig. 4 both quantities vary by a factor of 2. Larger variations are possible for stronger variations of the spot brightness.
In a simple model by Schnittman (2005) hot spots are created and destroyed around a single radius with random phases and exponentially distributed lifetimes , resulting in Lorentzian peaks in the power spectrum at the orbital frequency with a width of =(4)-1. The typical lifetimes of spots in this model are proportional to the orbital period at their radius. From MHD calculations Schnittman et al. (2006) find over a large range of radii that disk perturbations indeed have a nearly exponential distribution of lifetimes, with 0.3. This implies that even if the spot lifetime is solely determined by the cooling time at 2.2 or 3.8 m, this scenario is in full agreement with the suggested quasi-periodicity since Tlif0.3Torb. Here is the synchrotron cooling time in the NIR which is of the order of several minutes for the magnetic filed strengths used here (see Eckart et al 2008).
Assuming that the width of the observed QPO is 173 minutes we can derive an expected full width of the power spectrum peak of 0.02 min-1. Following Schnittman et al. (2005) this corresponds to an expected lifetime of the spots of 4 minutes - a value similar to the synchrotron cooling time in the NIR K-band. However, quasi-simultaneous K- and L-band measurements by Hornstein et al. (2007) show that for several 1 to 2 hour stretches of variable K-band emission 3 mJy, including flares of 10 to 30 minutes duration, the light curves at both wavelengths are well correlated. This suggests that the synchrotron cooling time scale in this case appears to be longer than the flare time scale and therefore not to be a relevant quantity for the spot lifetime. In addition the spread is an upper limit to the width of a possible Lorentzian distribution describing the QPO measurements. Therefore, we have to assume that is even longer than the synchrotron cooling times at K- and L-band, i.e significantly longer than 13 minutes, and suggesting that the spot lifetime could be of the order of , in agreement with results by Schnittman et al. (2005) and the model calculations presented here. The synchrotron cooling time scales may not be relevant at K- and L-band if the heating time scale is longer (e.g. on the time scale of the overall NIR or sub-mm flare event) or if some additional mechanism is at work that stabilizes the spots in the temporary accretion disk of SgrA*. A small spot size and a high magnetic field intrinsic to the spot may help to prevent strong shearing, lowering the requirements on this confinement mechanism.
4 Alternative models to the black hole scenario
Explaining SgrA* with alternative solutions for a MBH becomes increasingly difficult (see discussion in appendix of Eckart et al. 2006b). Stellar orbits near SgrA* make a universal Fermion ball solution for compact galactic nuclei highly unlikely and especially the fact that SgrA* appears to be a strongly variable and mass accreting object, represents a problem for the stability constraints that boson or fermion balls have. It is, for instance, quite a delicate process to form a boson star and preventing it from collapsing to a super massive black hole despite of further accretion of matter, a non spherically symmetric arrangement of forces as in the case of a jet or matter being in orbit around the center but well within the boson star. Such a massive boson star scenario could already be excluded for the nucleus of MCG-6-30-15 (Lu & Torres 2003). In the case of a stationary boson star the orbital velocity close to the 3 RS radius LSO is already 3 times lower than that of a Schwarzschild MBH (Lu & Torres 2003) and relativistic effects are severely diminished and further reduced at even smaller radii. If the variability that is indicated especially by the infrared polarization data is indeed due to orbital motion of a spot within a temporal accretion disk then a stationary boson star can be excluded as an alternative solution for SgrA*, since in this case one expects the orbital periods to be larger.
5 Interactions of the GC ISM with a central wind
L’-band (3.8 m) images of the Galactic Center show a large number of thin filaments in the mini-spiral, located west of the mini-cavity and along the inner edge of the Northern Arm (Muzic et al. 2007). Only a few of these filaments are associated with stars. Similar filaments have been seen in high-resolution radio data (Zhao & Goss 1998) and NIR Pa (Scoville et al. 2003), Br (Morris 2000) and HeI (Paumard et al. 2001) emission line maps. One possible mechanism that could produce such structures is the interaction of a central wind with the mini-spiral. Muzic et al. (2007) present the first proper motion measurements of the thin filaments observed in the central parsec around SgrA* and investigate possible mechanisms that could be responsible for the observed motions. The observations have been carried out using the NACO adaptive optics system at the ESO VLT.
They show that the shape and the motion of the filaments does not agree with a purely Keplerian motion of the gas in the potential of the supermassive black hole at the position of SgrA*. Therefore, additional mechanisms must be responsible for their formation and motion. The authors argue that the properties of the filaments are probably related to an outflow from the disk of young mass-losing stars around SgrA*. In part, the outflow may originate from the black hole itself. They also present some evidence and theoretical considerations that the outflow may be collimated.
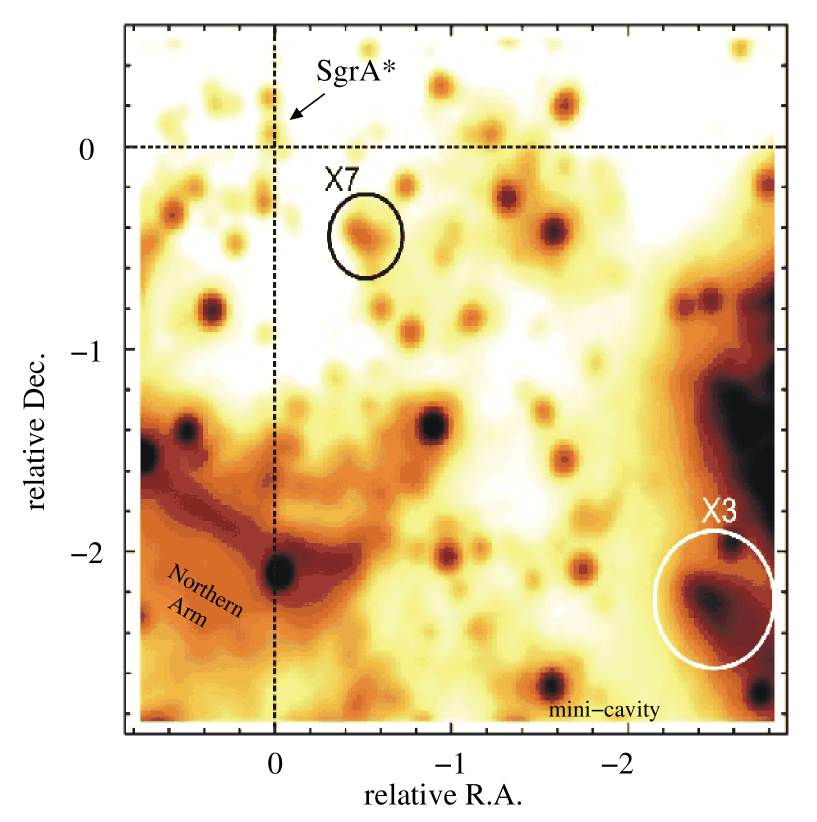
Muzic et al. (2007) also derive the proper motions of 2 cometary shaped dusty sources close (in projection) to SgrA* (Fig.6). The V-shaped dust shells indicate an interaction with a strong wind in the Galactic Center ISM (Fig. 6).
The central cluster of massive stars provides 310-3M⊙ yr-1 of gas in the form of stellar winds to the center (Najarro et al. 1997). However, about 99% of the material from stellar winds does not even get close to the Bondi radius and must therefore escape the central arcseconds in form of a wind and only a small fraction of the gas is actually accreted onto the black hole (Baganoff et al. 2003, Bower et al. 2003, Quataert 2003, Marrone et al. 2006; see also ADIOS and RIAF theory e.g. Blandford & Begelman 1999 and Yuan et al. 2006). The outflow may be partially collimated in form of a jet. Jet and shock models (see Markoff & Falcke 2003, Melia & Falcke 2001) as well as accretion from an in-falling wind due to the surrounding cluster of mass-losing hot stars (e.g. Coker et al. 1999, Yuan et al. 2002) are discussed to explain the radio to X-ray properties of SgrA*.
The V-shapes of both sources are pointed toward the position of SgrA* and therefore represent the most direct indication for a wind from SgrA*.
6 Summary and Conclusion
We have detected an X-ray flare that occurred synchronous to a NIR flare with polarized sub-flares. This confirms the previous finding (Eckart et al. 2004, Eckart et al. 2006a, Yusef-Zadeh et al. 2006) that there exists a class of X-ray flares that show simultaneous NIR emission with time lags of less than 10 minutes. In addition there are lower energy flare events that are bright in the infrared and are not detected in the X-ray domain (Hornstein et al. 2007). In the framework of a relativistic disk model the May 2007 polarimetric NIR measurements of a flare event with the highest sub-fare to flare contrast observed until now, may provide direct evidence for a spot evolution during the flare. This supports the interpretation of the NIR polarimetry data within a relativistic disk model. Combined with the assumption of spot expansion due to differential rotation, the combined SSC disk model can explain the combined X-raw and NIR data of the July 2004 flare (Eckart 2006a) and possibly also of the flare from 17 July 2006 reported by Hornstein et al. (2007).
The combination of relativistic amplification curves with a simple SSC mechanism allows us zero order interpretations in a time dependent flare emission model. We find that the temporary accretion disk around Sgr A* can well be represented by a multi component model with source properties that are bracketed by those of a simple flare and a quiescent model. We have used a ( synchrotron model in which the source component spectral indices are compatible with the constant value of reported by (Hornstein et al. 2007). A steeper spectral index of allows for direct synchrotron and SSC contributions in the NIR. In both the July 2005 and the May 2007 flare the component flux densities can be represented by a power spectrum with an exponent close to -1. The multicomponent model explains the sub-flare structure at infrared wavelengths and shows that with adequate sensitivity and time resolution the sub-flares should be detectable in the X-ray domain as well.
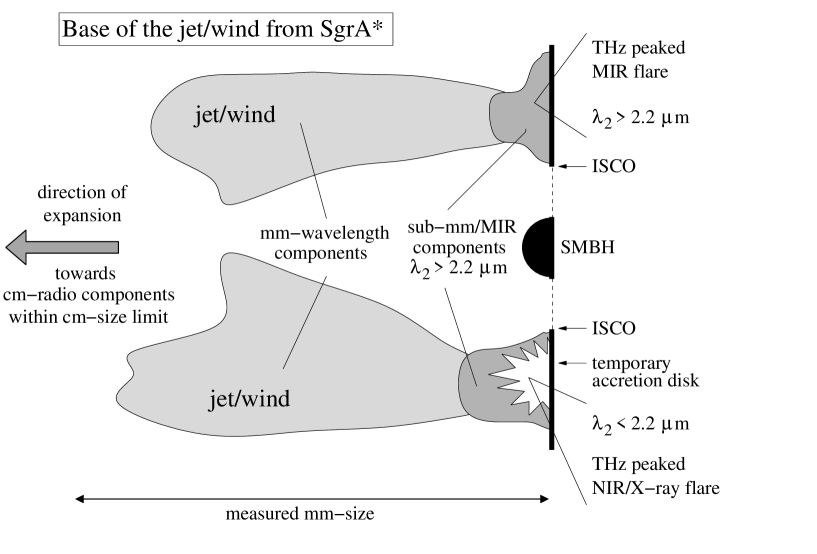
Eckart et al. (2008) present a model in which a combination of a temporary accretion disk occurs in combination with a short jet. Such a source structure may explain most of the observed properties of Sgr A*. Such a configuration is sketched in Fig.7. In this figure the disk is seen edge-on. Details of expected jet geometries are discussed by Markoff, Bower & Falcke (2007).
Simultaneous NIR K- and L-band measurements in combination with X-ray observations should lead to a set of light curves that can allow us to prove the proposed model and to discriminate between the individual higher and lower energy flare events. Simultaneous X-ray measurements are important to clearly distinguish between high and low energy events. To do so, it is required to separate the thermal non-variable bremsstrahlung and the non-thermal variable part of the Sgr A* X-ray flux density. This can only be achieved with a sufficiently high angular resolution in the X-ray regime. This capability is provided by the ACIS-I instrument aboard the Chandra X-ray Observatory and is essential for the proposed observations, especially in the case of weak X-ray flare events in which the X-ray flare intensity is of the order of the extended bremsstrahlung component associated with SgrA* - or even below. These can clearly be identified in combination with infrared data.
Acknowledgements
Part of this work was supported by the German Deutsche Forschungsgemeinschaft, DFG via grant SFB 494. L. Meyer, K. Muzic, M. Zamaninasab, D. Kunneriath, and R.-S. Lu, are members of the International Max Planck Research School (IMPRS) for Astronomy and Astrophysics at the MPIfR and the Universities of Bonn and Cologne. RS acknowledges support by the Ramón y Cajal programme by the Ministerio de Ciencia y Innovación of the government of Spain.
References
References
- [1]
- [2] Baganoff, F. K., Bautz, M.W., Brandt, W.N., Chartas, G., Feigelson, E.D., Garmire, G.P., Maeda, Y., Morris, M., Ricker, G.R., Townsley, L.K., & Walter, F. 2001 Nature 413 45
- [3]
- [4] Baganoff, F. K., Maeda, Y., Morris, M., et al. 2003 ApJ 591 891
- [5]
- [6] Bower, G.C., Falcke, H., Sault, R.J. and Backer, D.C., 2002 ApJ 571 843
- [7]
- [8] Bower, G. C., Wright, M. C. H., Falcke, H., & Backer, D. C., 2003 ApJ 588 331
- [9]
- [10] Blandford, R. & Begelman, M., 1999 MNRAS 303 L1
- [11]
- [12] Coker, R., Melia, F., & Falcke, H., 1999 ApJ 523 642
- [13]
- [14] Connors, P. A.; Stark R. F., 1977 Nature 269 128
- [15]
- [16] Cuadra, J.; Nayakshin, S., 2006 JPhCS 54 436
- [17]
- [18] Dovciak, M., Karas, V., Yaqoob, T., 2004 ApJS 153 205
- [19]
- [20] Eckart, A.; Baganoff, F. K.; Zamaninasab, M.; Morris, M. R.; Schödel, R.; Meyer, L.; Muzic, K.; Bautz, M. W.; Brandt, W. N.; Garmire, G. P.; Ricker, G. R.; Kunneriath, D.; Straubmeier, C.; Duschl, W.; Dovciak, M.; Karas, V.; Markoff, S.; Najarro, F.; Mauerhan, J.; Moultaka, J.; Zensus, A., 2008 A&A 479 625
- [21]
- [22] Eckart, A.; Baganoff, F. K.; Schödel, R.; Morris, M.; Genzel, R.; Bower, G. C.; Marrone, D.; et al., 2006a A&A 450 535
- [23]
- [24] Eckart, A.; Schödel, R.; Meyer, L.; Trippe, S.; Ott, T.; Genzel, R., 2006b A&A 455 1
- [25]
- [26] Eckart, A. & Genzel, R., 1996 Nature 383 415
- [27]
- [28] Eckart, A.; Baganoff, F. K.; Zamaninasab, M.; Morris, M. R.; Schödel, R.; Meyer, L.; Muzic, K.; Bautz, M. W.; Brandt, W. N.; Garmire, G. P.; and 11 coauthors, 2008 A&A 479 625
- [29]
- [30] Eckart, A., Genzel, R., Ott, T. and Schödel, R., 2002 MNRAS 331 917
- [31]
- [32] Eisenhauer, F.; Sch del, R.; Genzel, R.; Ott, T.; Tecza, M.; Abuter, R.; Eckart, A.; Alexander, T., 2003 ApJ 597 L121
- [33]
- [34] Eisenhauer, F., Genzel, R., Alexander, T., Abuter, R., Paumard, T., Ott, T., Gilbert, A., Gillessen, S., 2005 ApJ 628 246
- [35]
- [36] Genzel, R., Eckart, A., Ott, T., Eisenhauer, F., 1997 MNRAS 291 219
- [37]
- [38] Genzel, R., Pichon, C., Eckart, A., Gerhard, O. E., Ott, T., 2000 MNRAS 317 348
- [39]
- [40] Genzel, R., Schödel, R., Ott, T., et al., 2003 Nature 425 934
- [41]
- [42] Gillessen, S., Eisenhauer, F., Quataert, E., Genzel, R., et al., 2006 JPhCS 54 411
- [43]
- [44] Ghez, A., Klein, B.L., Morris, M. & Becklin, E.E., 1998 ApJ 509 678
- [45]
- [46] Ghez, A., Morris, M., Becklin, E.E., Tanner, A. & Kremenek, T., 2000 Nature 407 349
- [47]
- [48] Ghez, A.M., Wright, S.A., Matthews, K., et al., 2004a ApJ 601 159
- [49]
- [50] Ghez, A.M., Hornstein, S.D., Bouchez, A., Le Mignant, D., Lu, J., Matthews, K., Morris, M., Wizinowich, P., Becklin, E.E., 2004b AAS 205 2406
- [51]
- [52] Ghez, A.M., Salim, S., Hornstein, S. D., Tanner, A., Lu, J. R., Morris, M., Becklin, E. E., Duchêne, G., 2005 ApJ 620 744
- [53]
- [54] Greenhough, J., Chapman, S.C., Chaty, S., Dendy, R.O., and Rowlands G., 2002 A&A 385 693
- [55]
- [56] Karas, V., Dovciak, M., Eckart, A., Meyer, L., Proc. of the Workshop on the Black Holes and Neutron Stars, eds. S. Hledik and Z. Stuchlik, 19-21 September 2007 (Silesian University, Opava), astro-ph0709.3836
- [57]
- [58] Herrnstein, R.M., Zhao, J.-H., Bower, G.C., & Goss, W.M., 2004 AJ 127 3399
- [59]
- [60] Hornstein, S. D.; Matthews, K.; Ghez, A. M.; Lu, J. R.; Morris, M.; Becklin, E. E.; Rafelski, M.; Baganoff, F. K., 2007 ApJ 667 900
- [61]
- [62] Lu, Y., & Torres, D.F., 2003 Int. Journal of Modern Physics D 12 No. 1, pp. 63-77
- [63]
- [64] Markoff, S. & Falcke, H., 2003 Astron.Nachr. 324 3
- [65]
- [66] Markoff, S.; Bower, G.C.; Falcke, H., 2007, to be published in MNRAS
- [67]
- [68] Marrone, D. P.; Baganoff, F. K.; Morris, M.; Moran, J. M.; Ghez, A. M.; Hornstein, S. D.; Dowell, C. D.; Munoz, D. J.; Bautz, M. W.; Ricker, G. R.; and 7 coauthors, 2008, accepted by ApJ, 2007arXiv0712.2877M
- [69]
- [70] Marrone, D. P., Moran, J. M., Zhao, J.-H., & Rao, R., 2006 ApJ 640 308M
- [71]
- [72] Marrone, D.P.; Moran, J.M.; Zhao, J.-H.; Rao, R., 2007 ApJ 654 L57
- [73]
- [74] Mauerhan, J.C.; Morris, M.; Walter, F.; Baganoff, F.K., 2005 ApJ 623 L25
- [75]
- [76] Melia, F. & Falcke, H., 2001 A.R.A & A. 39 309
- [77]
- [78] Meyer, L., Eckart, A., Schödel, R., Duschl, W. J., Muciz, K., Dovciak, M., Karas, V., 2006a A&A 460 15
- [79]
- [80] Meyer, L., Schödel, R., Eckart, A., Karas, V., Dovciak, M., Duschl, W. J., 2006b A&A 458 L25
- [81]
- [82] Meyer, L., Schödel, R., Eckart, A., Duschl, W. J., Karas, V., Dovciak, M., 2007 A&A 473 707
- [83]
- [84] Najarro, F., Krabbe, A., Genzel, R., et al., 1997 A&A 325 700
- [85]
- [86] Pechacek T., Karas V., Czerny B., 2008 A&A, submitted
- [87]
- [88] Pessah, M.E., Chan, C.-K., Psaltis, D., 2007, eprint:0705.0352
- [89]
- [90] Quataert, E., 2003 Astron. Nachr. 324 3
- [91]
- [92] Schnittman, J.D., 2005, Ph.D dissertation, 2005, Massachusetts Institute of Technology, Publication Number: AAT 0808149. DAI-B 66/05, Nov 2005
- [93]
- [94] Schnittman, J.D.; Krolik, J.H.; Hawley, J.F., 2006 ApJ 651 1031
- [95]
- [96] Schödel, R., Ott, T., Genzel, R., Hofmann, R., Lehnert, M., Eckart, A., Mouawad, N., Alexander, T., 2002 Nature 419 694
- [97]
- [98] Schödel, R., Ott, T., Genzel, R., Eckart, A., Mouawad, N., Alexander, T., 2003 ApJ 596 1015
- [99]
- [100] Yuan, F., Markoff, S., & Falcke, H., 2002 A&A 383 854
- [101]
- [102] Yuan, F., Quataert, E. & Narayan, R., 2003 ApJ 598 301
- [103]
- [104] Yuan, F. 2006, in Journal of Physics: Conference Series 54 Issue 1, ed. D. Bonaccini, 427
- [105]
- [106] Yusef-Zadeh, F., Morris, M., & Ekers, R. D., 1990 Nature 348 45
- [107]
- [108] Zhao, J.-H., Young, K.H., Herrnstein, R.M., Ho, P.T.P., Tsutsumi, T., Lo, K.Y., Goss, W.M. & Bower, G.C., 2003 ApJL 586 L29.
- [109]
- [110] Yusef-Zadeh, F., Roberts, D., Wardle, M., Heinke, C. O., Bower, G. C., 2006 ApJ 650 189
- [111]
- [112] Yusef-Zadeh, F.; Wardle, M.; Heinke, C.; Dowell, C. D.; Roberts, D.; Baganoff, F. K.; Bower, G. C., 2008, accepted by ApJ, 2007arXiv0712.2882Y
- [113]
- [114] Zhao, J.-H., Herrnstein, R.M., Bower, G.C., Goss, W.M., & Liu, S.M., 2004 ApJL 603 L85.
- [115]