Friction at Atomic-Scale Surface Steps: Experiment and Theory
Abstract
Experiments performed by friction force microscopy at atomic-scale surface steps on graphite, MoS2, and NaCl in ambient conditions are presented. Both step-down and step-up scans exhibit higher frictional forces at the edge, but distinguish in their load dependence: While the additional frictional force due to the step edge increases linearly with load if the tip has to jump a step up, it remains constant for downward jumps. This phenomena represents a universal effect that can be explained in terms of a modified Prandtl-Tomlinson model featuring a Schoebel-Ehrlich barrier at steps.
pacs:
68.35.Af 62.20.Qp 07.79.Sp 68.37.PsTribology – the science of friction, wear, and lubrication – has impact on many fields of science and technology. Consequently, it has been the subject of intense research during the last centuries Dowson (1979). With the advent of new experimental techniques such as friction force microscopy (FFM) Mate et al. (1987), the study of frictional phenomena at the atomic scale became accessible to tribologists, and the field of nanotribology has been established since (see, e.g., Refs. Bhushan et al., 1995; Carpick and Salmeron, 1997; Urbakh et al., 2004; Hölscher et al., 2008).
The basic paradigm of nanotribological research is that the frictional behavior of a single asperity contact needs to be clarified in order to better understand friction in complex macroscopic systems. Naturally, this makes the friction force microscope a tool of choice for nanotribology. So far, most experimental FFM studies designed to elucidate the atomic-scale principles of friction focused on the frictional behavior of atomically flat surfaces (see, e.g., Refs. Luethi1996a, ; Morita et al., 1996; Kerssemakers and De Hosson, 1995; Hölscher et al., 1998; Hoelscher1999c, ; Socoliuc et al., 2004; Medyanik et al., 2006). The stick-slip phenomena observed in these experiments can be understood in the framework of the well established and surprisingly simple Prandtl-Tomlinson (PT) model Prandtl (1928); Tomlinson (1929), which is sometimes also referred to as independent oscillator model McClelland (1989); Helman1994 . An extension of this model, obtained by including thermal activation processes, helped to understand the velocity and temperature dependence of friction Gnecco2000 ; Riedo2003 ; Schirmeisen et al. (2005).
Although these studies enabled valuable insight into the origin of atomic-scale friction, atomically flat surfaces represent a simplified model case, since any truly advanced model must include roughness. From this point of view, it is surprising that only very few studies Meyer and Amer (1990); Ruan and Bhushan (1994); Weilandt et al. (1995); EMeyer1996a ; Mueller1997 focusing on the analysis of friction at atomic-scale surface steps exist footnote . All of them reported increased frictional forces at step edges compared to the value found on atomically flat terraces, which has potentially far-reaching implications on the friction observed in macroscopic systems. Meyer et al. EMeyer1996a attributed this effect to the influence of the Schwoebel-Ehrlich barrier Ehrlich (1966); Schwoebel and Shipsey (1966) present at atomic step edges. Analyzing the load dependence of an Si3N4 tip on graphite in ultrahigh vacuum, Müller et al. Mueller1997 found a directional dependence: Despite being much larger compared to the on-terrace value, frictional forces were load-independent when jumping a step down (“downwards scan”). In contrast, they increased linearly with load if the tip had to move a step up (“upwards scan”).
The results presented in this letter demonstrate that the findings by Müller et al. are not restricted to graphite surfaces under vacuum environment, but appear to be of general significance. Our investigations were performed on freshly cleaved graphite(0001), MoS2(001), and NaCl(001) surfaces using rectangular silicon cantilevers (ContGD, BudgetSensors) in a commercial friction force microscope (MultiMode AFM with Nanoscope IIIa electronics by Veeco Instruments, Inc.) operated under ambient conditions. The normal and lateral spring constants and as well as friction and load were determined applying the calibration procedures described in Ref. Schwarz et al., 1996.
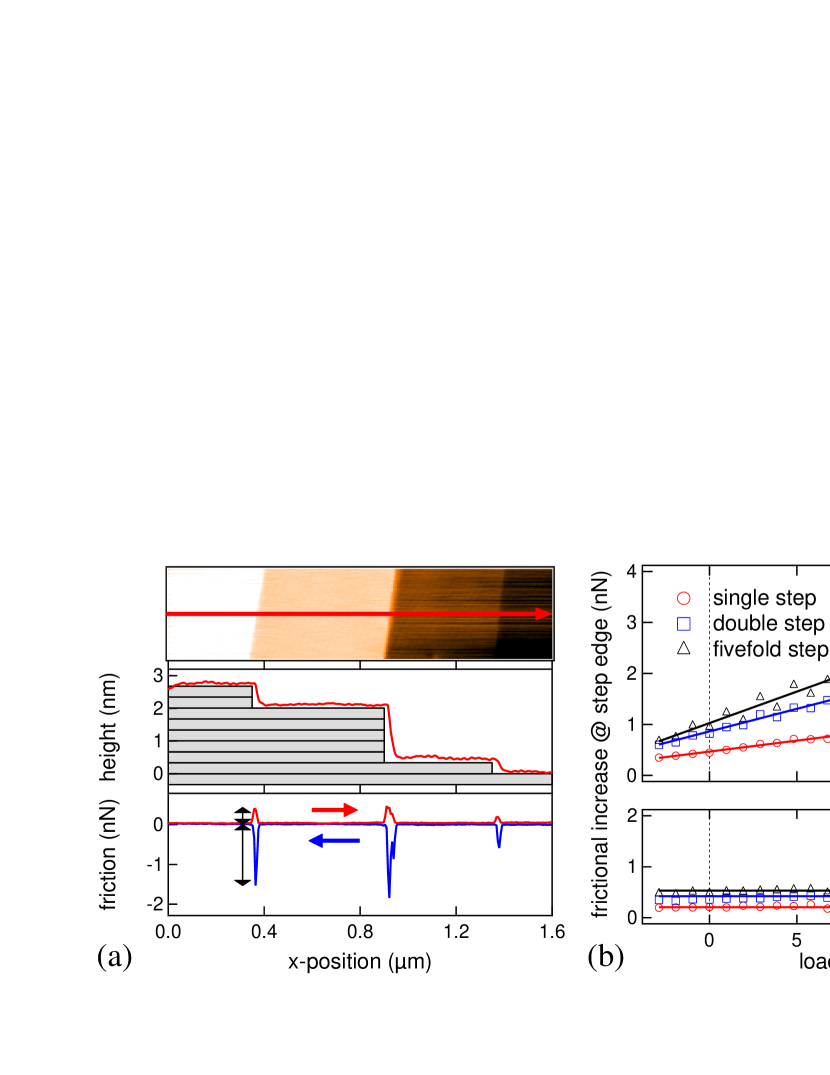
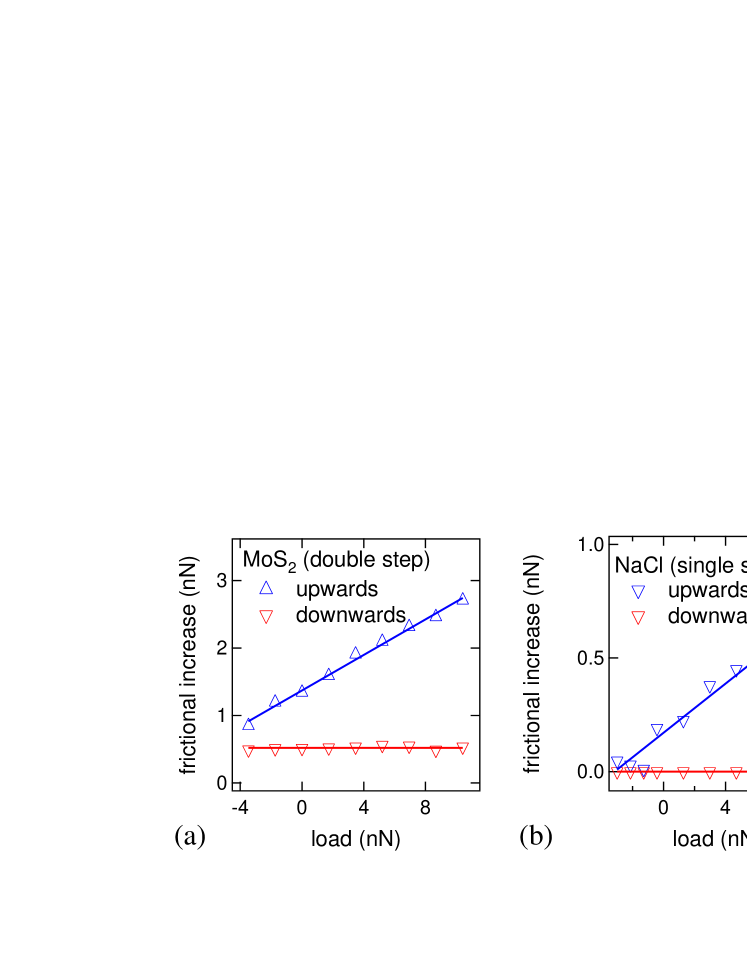
Figure 1 summarizes the data obtained on graphite, where we measured the frictional forces at three different step edges of one, two, and five graphene layers height within the same scan. Maximum frictional forces encountered at a step edge were always higher for upwards scans than for downward scans [cf. Fig. 1(a), bottom panel, for illustration]. In order to adequately study the additional contribution of the step edge to the overall friction systematically as a function of the externally applied load , we always plot in the following the difference between the frictional force needed to overcome the surface step and the frictional forces on the terraces, which we refer to as “frictional increase”. Our analysis of this additional, step edge-induced component revealed that it increases linearly for upward scans, while it remains constant for downward scans [Fig. 1(b)]. Note that we recover the same qualitative relationships for all three step heights, even though higher step heights show higher absolute increases. Control experiments carried out on a double step on MoS2 [Fig. 2(a)] and a single step-edge on NaCl(001) [Fig. 2(b)] reveal the same behavior.
Combining the previously published reports with our experimental findings suggests that the described load dependence of friction at step edges is likely to be a general phenomena and independent of both the sample material as well as the specifics of the environment (vacuum or air). However, despite this fairly far-reaching suspected range of validity and its consequential impact on macroscopic friction, this effect has not been the subject of thorough theoretical analysis yet. To fill this gap, we propose an extended Prandtl-Tomlinson model that includes an explicit description of the tip-sample interaction at atomic-scale surface steps and, as a result, correctly reproduces the load dependence at atomic-scale surface steps.
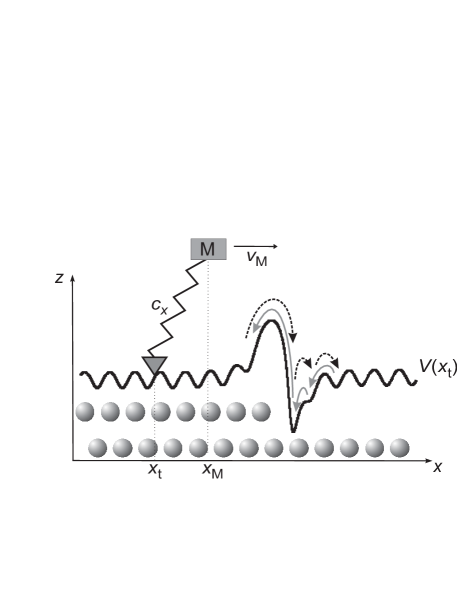
A schematic representation of the model is shown in Fig. 3. A point-like tip is elastically coupled to a main body with a spring possessing a spring constant in direction and interacts with the sample surface via an interaction potential , where and reflect the actual position of the tip. The body experiences a constant loading force while it is scanned over the sample surface with a velocity . The path of the tip can be calculated from the equations of motion Hölscher et al. (1997)
| (1a) | ||||
| (1b) | ||||
where , are the effective masses of the system and , damping constants.
Within the PT model, the point-like tip represents the average of the actual tip-sample contact, which might include several dozens or even hundreds of atoms. The effect of the finite contact size is then mapped into the specific choice of the interaction potential for calculation convenience. In the classical PT model, this interaction is typically approximated by a simple sinusoidal term. To include the effect of scanning over a step edge, we extend this approach by explicitly introducing the tip-sample interaction at surface steps into . Due to the lack of a suitable analytical description, we used a numerical approach as described below, which ultimately allowed to recover all experimentally observed characteristics from the simulations.
The two-dimensional tip-sample interaction potential is computed by the summation of individual Lenard-Jones potentials where represents the distance between the point-like tip and the th surface atom. The parameters and describe the binding energy and the equilibrium distance, respectively. Figure 4(a) shows a color-coded density plot of a tip-sample interaction potential calculated for a hexagonal structure with an atomic distance of nm. By introducing this potential into the equation of motion (1), we can compute the path of the tip on the sample surface, obtaining the lateral force from .
Lateral force curves calculated in this way are plotted in Fig. 4(b) as a function of the loading force. Left and right from the step edge, exhibits for fixed loads the typical saw tooth-like shape with the periodicity of the atomic lattice expected from the classical PT model. This behavior occurs because the condition
| (2) |
is fulfilled Mate et al. (1987) and reproduces the tip behavior observed in actual FFM experiments on atomically flat terraces Hölscher et al. (2008); Luethi1996a ; Morita et al. (1996); Kerssemakers and De Hosson (1995); Hölscher et al. (1998); Hoelscher1999c ; Socoliuc et al. (2004). The significantly altered tip movement in the immediate vicinity of the surface step, however, requires a more careful consideration.
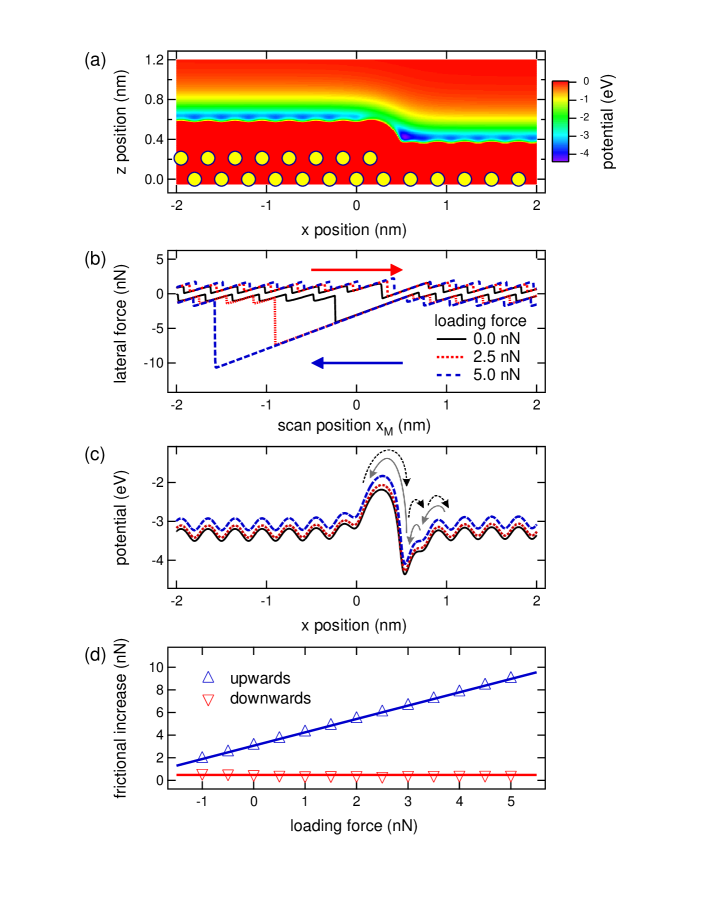
For analysis, we start by computing the actual -position of the tip from the stability condition . Calculating the tip-sample potential at these positions, we obtain the potential the tip experiences for different loading forces [Fig. 4(c)]. Caused by a reduction of the atomic coordination at the step edge, a step-induced potential barrier (Schwoebel-Ehrlich barrier Ehrlich (1966); Schwoebel and Shipsey (1966)) is obtained. Conversely, increasing coordination leads to a potential minimum at the bottom of the step. Left and right from the surface step, the potential shows the sinusoidal shape assumed in the classical PT model.
The lateral force curves plotted in Fig. 4(b) can now be understood by imagining that the tip moves in this potential landscape during scanning. For a downward scan [left to right in Fig. 4(c)], the tip needs three jumps to overcome the surface step [dashed arrows in Figs. 3 and 4(c)]. First, it jumps over the Schwoebel-Ehrlich barrier into the minimum at the bottom of the step edge. The mechanism behind this movement is the same as for the earlier discussed stick-slip movement on the terraces: The tip sticks at the left slope of the maximum until the force of the spring is large enough to pull it over the barrier. The force needed for this process, however, will typically be larger than on the terraces. After this first jump, the tip is temporarily stuck in the minimum at the bottom of the step edge. A second larger-than-usual jump is needed to disengage the tip, which occurs again when the condition Eq. (2) is fulfilled. Finally, the tip jumps out of the shallow minimum nested within the rising edge of the potential.
For an upward scan [right to left in Fig. 4(c)], the tip first makes a “regular” jump from the last minimum of the periodic potential of the terrace into a shallow minimum located within the potential’s falling edge (first solid arrow). From there, it takes a smaller-than-usual jump into the well developed minimum at the bottom of the step edge (second solid arrow). Pulling the tip now from this minimum over the barrier (third solid arrow) requires the application of a very large lateral force compared to typical forces experienced on the terraces. As a consequence,the tip subsequently jumps over a distance spanning several atomic unit cells, as can be seen from Fig. 4(b).
From the analysis, it is evident that the frictional forces are markedly different for downwards and upwards scans. Because the tip has a much higher barrier as well as a much steeper rise (slope of the potential) to overcome during the upward scan compared to the downward scan, lateral forces are naturally much higher for scanning upwards. Also, we find that the relative height between the last minimum before the barrier and the maximum if approached from the side of the upper terrace does not significantly change with load, leading to a nearly load-independent frictional increase at the step edge. In contrast, both the relative barrier height as well as the slope increase if the barrier is approached from the side of the lower terrace, which leads to a linear dependence of the frictional increase on load. Fig. 4(d) illustrates this behavior, where the frictional increase has been plotted for upwards and downward scans. Note that these results agree qualitatively very well with the experimental data of Figs. 1 and 2, suggesting that the experimentally observed load dependence is likely to be caused by the effects described in this paper. In this context, we would like to mention that similar results are obtained for a wide range of parameters as well as by representing the tip-sample interaction potential as a sum over Morse potentials.
In summary, we presented experiments and simulations analyzing the load dependence of atomic-scale friction at surface steps. Experimentally, a direction-dependence has been found, where the contribution of the frictional forces due to the presence of the step edge increases linearly with load for upwards scans while it is load-independent for downward scans. By introducing a modified Prandtl-Tomlinson model that includes an explicit description of the tip-sample interaction at surface steps, a theoretical basis for this behavior has been found. Finally, generalization of the above principles to other types of surface defects (vacancies, grain boundaries, etc.) where the atomic coordination will be temporarily altered suggests that this effect might very well dominate the macroscopic friction experienced on many materials.
It is a pleasure to thank André Schirmeisen, Lars Jansen, Harald Fuchs (University of Münster) and Volker Saile (Forschungszentrum Karlsruhe) for discussions and their continuous support. This work was financially supported by the BMBF (Grant No. 03N8704), the National Science Foundation (Grant No. MRSEC DMR 0520495), and the Petroleum Research Fund of the American Chemical Society (Grant No. PRF 42259-AC5).
References
- Dowson (1979) D. Dowson, History of Tribology (Longman Inc., New York, 1979).
- Mate et al. (1987) C. M. Mate, G. M. McClelland, R. Erlandsson, and S. Chiang, Phys. Rev. Lett. 59, 1942 (1987).
- Bhushan et al. (1995) B. Bhushan, J. N. Israelachvili, and U. Landmann, Nature 374, 607 (1995).
- Carpick and Salmeron (1997) R. W. Carpick and M. Salmeron, Chem. Rev. 97, 1163 (1997).
- Urbakh et al. (2004) M. Urbakh, J. Klafter, D. Gourdon, and J. Israelachvili, Nature 430, 525 (2004).
- Hölscher et al. (2008) H. Hölscher, A. Schirmeisen, and U. D. Schwarz, Phil. Trans. R. Soc. A (2008).
- (7) R. Lüthi at al., J. Vac. Sci. Technol. B 14, 1280 (1996).
- Morita et al. (1996) S. Morita, S. Fujisawa, and Y. Sugawara, Surf. Sci. Rep. 23, 1 (1996).
- Kerssemakers and De Hosson (1995) J. Kerssemakers and J. T. M. De Hosson, Appl. Phys. Lett. 67, 347 (1995).
- Hölscher et al. (1998) H. Hölscher, U. D. Schwarz, O. Zwörner, and R. Wiesendanger, Phys. Rev. B 57, 2477 (1998).
- (11) H. Hölscher, et al., Phys. Rev. B 59, 1661 (1999).
- Socoliuc et al. (2004) A. Socoliuc, R. Bennewitz, E. Gnecco, and E. Meyer, Phys. Rev. Lett. 92, 134301 (2004).
- Medyanik et al. (2006) S. N. Medyanik, W. K. Liu, I.-H. Sung, and R. W. Carpick, Phys. Rev. Lett. 97, 136106 (2006).
- Prandtl (1928) L. Prandtl, Z. Angew. Math. Mech. 8, 85 (1928).
- Tomlinson (1929) G. A. Tomlinson, Philos. Mag. S. 7 7, 905 (1929).
- McClelland (1989) G. M. McClelland, in Adhesion and Friction, edited by M. Grunze and H. J. Kreuzer (Springer, Heidelberg, Germany, 1989), pp. 1–16.
- (17) J. S. Helman, W. Baltensperger, and J. A. Hołyst, Phys. Rev. B 49, 3831 (1994).
- (18) E. Gnecco et al., Phys. Rev. Lett. 84, 1172 (2000).
- (19) E. Riedo, E. Gnecco, R. Bennewitz, E. Meyer, and H. Brune, Phys. Rev. Lett. 91, 084502 (2003).
- Schirmeisen et al. (2005) A. Schirmeisen, L. Jansen, and H. Fuchs, Phys. Rev. B 71, 245403 (2005).
- Meyer and Amer (1990) G. Meyer and N. M. Amer, Appl. Phys. Lett. 57, 2089 (1990).
- Ruan and Bhushan (1994) J.-A. Ruan and B. Bhushan, J. Appl. Phys. 76, 8117 (1994).
- Weilandt et al. (1995) E. Weilandt, A. Menck, and O. Marti, Surf. Interface Anal. 23, 428 (1995).
- (24) E. Meyer et al., J. Vac. Sci. Technol. B 14, 1285 (1996).
- (25) T. Müller et al., Phys. Rev. Lett. 79, 5066 (1997).
- (26) We use the term “atomic-scale surface step” to refer to steps of one atom, two atoms, or another “low” number of atoms in height. Such steps are abundant on most crystalline surfaces. For an analysis of the lateral force signal observed at “large” surface steps (defined as steps where the tip radius becomes comparable or smaller than the height of the step) see, e.g., S. Sundararajan and B. Bhushan, J. Appl. Phys. 88, 4825 (2000), or I.-H. Sung, H.-S. Lee, and D.-E. Kim, Wear 254, 1019 (2003).
- Ehrlich (1966) G. Ehrlich, J. Chem. Phys. 44, 1050 (1966).
- Schwoebel and Shipsey (1966) R. L. Schwoebel and E. J. Shipsey, J. Appl. Phys. 37, 3682 (1966).
- Schwarz et al. (1996) U. D. Schwarz, P. Köster, and R. Wiesendanger, Rev. Sci. Instrum. 67, 2560 (1996).
- Hölscher et al. (1997) H. Hölscher, U. D. Schwarz, and R. Wiesendanger, Surf. Sci. 375, 395 (1997).