An evolving hot spot orbiting around Sgr A*
Abstract
Here we report on recent near-infrared observations of the Sgr A* counterpart associated with the super-massive black hole at the Galactic Center. We find that the May 2007 flare shows the highest sub-flare contrast observed until now, as well as evidence for variations in the profile of consecutive sub-flares. We modeled the flare profile variations according to the elongation and change of the shape of a spot due to differential rotation within the accretion disk.
1 Introduction
Over the last decades, evidence has been accumulated that most quiescent galaxies harbor a massive black hole (MBH) at their center. Especially in case of the center of our Galaxy, progress has been made through the investigation of stellar dynamics (Eckart & Genzel 1996, Genzel et al. 1997, 2000, Ghez et al. 1998, Eckart et al. 2002, Schödel et al. 2002, 2003, Eisenhauer 2005) which has revealed the presence of a super-massive black hole at the Galactic Center. Its position coincides with that of the compact radio source Sgr A*. At a distance of only kpc (Eisenhauer et al. 2005) the Galactic Center is the closest galactic nucleus. Sgr A* is a source of variable emission in the X-ray and near-infrared wavelength regimes (Baganoff et al. 2001, Eckart et al. 2004, 2006a, Genzel et al. 2003 and Yusef-Zadeh et al. 2006). The NIR/X-ray variability is probably also linked to the variability at radio through sub-millimeter wavelengths, showing that variations occur on time scales from hours to years.
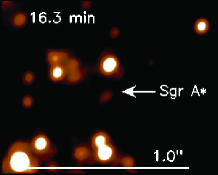
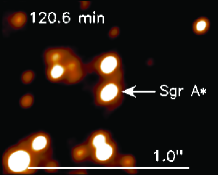
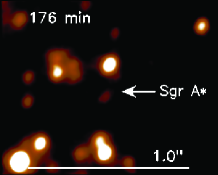
Recent NIR and X-ray observations have revealed the non-thermal nature of the high frequency radiation from Sgr A*. The source is visible in NIR regime only during its flaring state (Fig. 1). Some NIR flares have been found to be highly polarized. Most flares normally have X-ray counterparts, which strongly suggests synchrotron or synchrotron self Compton (SSC) processes as the radiation mechanism. NIR spectroscopic observations have shown that the observed spectra of NIR flares can be fitted well with a power-law, (where , and are the flux density, frequency and spectral index respectively). Although all observations are in agreement with the fact that NIR flares show a soft spectrum (), the spectral index value is still not well determined (Eckart et al. 2004, Gillessen et al. 2006a, Hornstein et al. 2007).
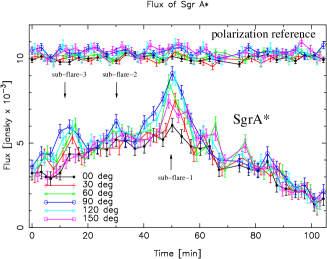
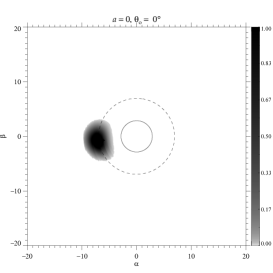
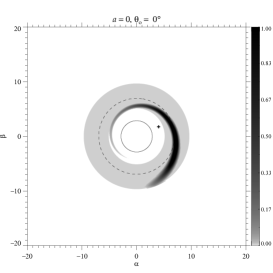
The periods of enhanced radiation (so called ”NIR flares”, normally around 100 minutes long) seem to be sometimes accompanied by quasi-periodic oscillations (QPOs) (Fig. 2; see also Genzel et al. 2003, Eckart et al. 2004, 2006a,b, Meyer et al. 2006a,b). As we will discuss later, in our modeling the main flare is caused by a local event close to the Marginally Stable Orbit (MSO) which spreads out via a shock wave and produces a temporary hot torus around the black hole (Fig. 3). The starting engine of the event could be magnetic reconnections, stochastic acceleration of electrons due to MHD waves or Magneto Rotational Instabilities (MRI) inside the plasma. The mentioned QPOs are mainly due to the presence of an orbiting asymmetry in this torus which cause the flux modulations according to general and special relativist effects.
Here we present two flares observed with the VLT in July 2005 and May 2007 and the results of our hot spot modeling which includes the effects of rotational shearing.
2 Observations and Data Reduction
As part of a large observing campaign, Sgr A* was observed in May 2007 and July 2005 using the VLT111Based on observations at the Very Large Telescope (VLT) of the European Southern Observatory (ESO) on Paranal in Chile; Programs: 073.B-0775 July 2004; 075.B-0093 July 2005; 079.B-0084 May 2007.. The observations of Sgr A* were carried out in the NIR KS-band (2.0-2.36m) using the NIR camera CONICA and the adaptive optics (AO) module NAOS on the European Southern Observatory’s Very Large Telescope UT4 on Paranal, Chile, during the nights between 29 and 30 July 2005 as well as 14 and 15 May 2007. The infrared wavefront sensor of NAOS was used to lock the AO loop on the NIR bright (K-band magnitude 6.5) supergiant IRS 7, located about north of Sgr A*. Therefore the AO module was able to provide a stable correction with a high Strehl ratio. In NACOS/CONICA (NACO) the combination of a Wollaston prism with a half-wave retarder plate allows the simultaneous measurement of two orthogonal directions of the electric field vector.
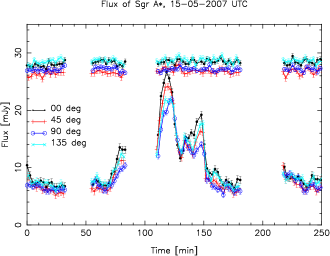
The observed variable NIR emission of Sgr A* has been found to be usually highly polarized and to consist of a contribution of a non- or weakly polarized main flare with highly polarized sub-flares, showing a possible QPO of 173 minutes consistent with previous observations. Significant positive flux density excess on time scales shorter (according to all previous NACO observations typically of the order of the QPO time scale) than the overall flare duration (typically 100 minutes or more) are called sub-flares. In Fig. 2 we show the flux density per polarization channel as a function of time. The 3 gaps in the data are due to sky observations. For more details on the observations and data reduction see Eckart et al. 2006b, 2008.
3 Modeling and Discussion
As mentioned above we interpret QPOs according to the existence of an orbiting asymmetry in the flaring region of the accretion disk close to the MSO of the black hole. The fact that the frequency of these QPOs is comparable to the MSO’s dynamical time for a black hole with the mass of Sgr A*, gives more strength to the assumption of an orbiting bright region (so called ”spots”). In our modeling we simulate the relativistic effects by using the KY code (Dovciak et al. 2004). It takes into account the relativistic effects (relativistic beaming, redshifts and blue-shifts, lensing, time delays, change of the emission angle and change of polarization angle) using a slim disk approximation. This allows us to fit the model parameters to the actual data. The procedure was first demonstrated by Meyer et al. (2006a,b; the authors also discuss in detail the differences with other modeling efforts, e.g. Broderick & Loeb 2006a,b). The magnetic field configuration is such that the resulting projected E-vector is always perpendicular to the equatorial plane (see also Shakura & Sunyaev 1973). As a second configuration we have allowed for a global toroidal magnetic field.
By using a simple approach which considers only the rise and fall times of the observed flux, one can put an upper limit on the characteristic size of the emitting region. For a Shakura-Sunyaev-type accretion disk and in case that self gravity effects can be neglected (very close to the black hole), we can use the standard one-zone approximation of the vertical hydrostatic equilibrium. This approximation relates the azimuthal velocity, the sound velocity, the thickness of the disk, and the radius to each other (see the discussion by Meyer et al. 2006). In order to assign an upper limit to the size of the emitting region , we use the minimum of a stable dynamical time related to the maximally rotating black hole (), min, and typical observed rise time of the flux, min. For a geometrically thin disk () this leads to .
Evidence from MHD simulations indicates that the dynamical transition from rotational support to free fall which occurs in the vicinity of the MSO could be the source of magnetic or thermal instabilities (Krolik & Hawley 2002). Together with the assumption that the radiation edge of the accretion disk is located very close to the marginally stable orbit (Krolik & Hawley 2002), one could put a constraint on the spin of the black hole. If the observed 20 min NIR modulations are related to the orbiting spots, the radius of their orbit must be much smaller than the marginally stable orbit of a Schwarzschild black hole. The above considerations imply that the dimensionless spin parameter reaches a minimum value of 0.5 (see also Eckart et al. 2004, Meyer et al. 2006a,b).
Since we focus only on modeling of the NIR flares, it is sufficient to pick up the simple power-law model for the non-thermal electrons energy distribution: , with a sharp cut-off energy . This leads to a simple formula for the synchrotron emission: , where , , and are the normalization constant, the number density of the electrons, the spectral energy index and perpendicular component of the magnetic field projected onto the plane of an observer co-moving with the plasma, respectively. is the first Stokes parameter. Since it is proved observationally that there exists a turn-over frequency in the sub-millimeter to NIR range, by using the turn-over ferquency formula one could assign an upper limit on . Here we used G which gives the best fit to the existing NIR/X-ray flare models (Liu et al. 2006, Eckart et al. 2008). The spectral energy index is fixed to , according to recent observations by Hornstein et al. 2006.
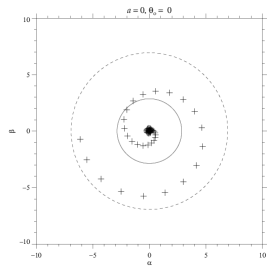
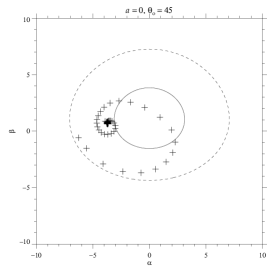
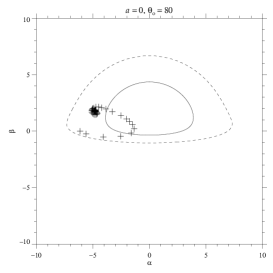
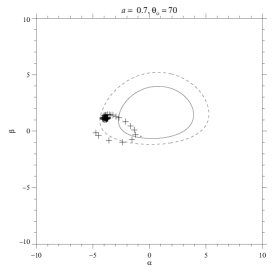
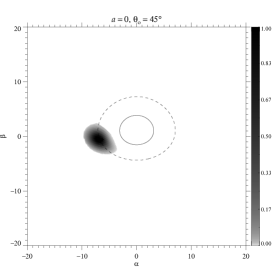
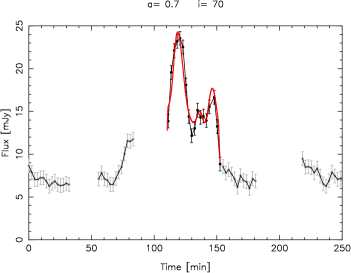
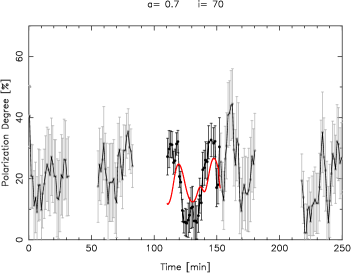
Fig. 4 shows the least fit to the NIR flare observed on 15th of May 2007 via a simple approach (see Eckart et al. 2008). Here we fitted the flux and intensity of polarization for the spin parameter , the inclination angle , the over-brightness of the spot according to the disk, the polarization degrees of the torus (restricted between 0%-5%) and the spot (restricted between 0%-70%), as well as the initial phase of the spot on the orbit. The inclination is defined such that the temporary accretion disk is seen edge on for an inclination of =90o. The upper limit for the spot polarization reflects the maximum value that could be produced by synchrotron radiation. Fig. 4 clearly shows that this model can produce the substructures in flux and also in polarization degree. The fit prefers a high inclination angle and spin parameter ( & ; ), which is also in good agreement with previous works by Eckart et al. (2006b) and Meyer et al. (2006a,b).
As discussed above, the May 2007 data possibly represent the first direct observational evidence that spots may only be stable for about one orbital time scale. An efficient creation of spots could be provided through magneto-rotational instabilities that are shown to be present in Keplerian rotating accretion disks even in the presence of a dominating toroidal magnetic field (Hawley & Balbus 1991). Such shear-flow instabilities are a fast mechanism to generate a turbulent flow in a Keplerian disk (e.g. three-dimensional simulations by Arlt & Rüdiger 2001).
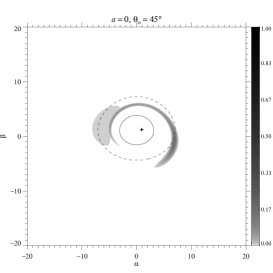
The next generation VLTI instrument GRAVITY (Gillessen et al. 2006b) would make it possible to track the NIR centroid path of Sgr A* with as precision. Fig. 5 shows the expected centroid tracks of an evolving spot for different inclinations of the accretion flow with respect to the line-of-sight for the case of a spinless black hole and for the best fit parameters of the 15 May 2007 event. The rotational shearing and the Doppler boosted photons from the torus make the centroid path more compact in comparison to background subtracted images of an orbiting spot with a solid shape (see Broderick & Loeb 2006a,b). This may present a complication in detecting the plasma structure close to the event horizon of Sgr A*.
Acknowledgments
Part of this work was supported by the German Deutsche Forschungsgemeinschaft, DFG via grant SFB 494. M. Zamaninasab and D. Kunneriath are members of the International Max Planck Research School (IMPRS) for Astronomy and Astrophysics at the MPIfR and the Universities of Bonn and Cologne.
References
References
- [1] Arlt R and Rüdiger G 2001 A&A 374 1035
- [2] Baganoff F K, Bautz M W, Brandt W N, et al. 2001 Nature 413 45
- [3] Broderick A E and Loeb A 2006a MNRAS 367 905
- [4] Broderick A E and Loeb A 2006b ApJ 636 L109
- [5] Cunningham C T 1975 ApJ 202 788
- [6] Dovciak M, Karas V and Yaqoob T, 2004 ApJ 153 205
- [7] Eckart A, and Genzel R 1996 Nature 383 415
- [8] Eckart A, Genzel R, Ott T and Schoedel R 2002 MNRAS 331 917
- [9] Eckart A, Baganoff F K, Morris M, Bautz M W, Brandt W N, Garmire G P, Genzel R, Ott T, Ricker G R, Straubmeier C, Viehmann T, Schödel R, Bower G C and Goldston J 2004 A&A 427 1
- [10] Eckart A, Baganoff F K, Schödel R, Morris M, Genzel R, Bower G C, Marrone D et al. 2006a A&A 450 535
- [11] Eckart A, Schödel R, Meyer L, Trippe S, Ott T and Genzel R 2006b A&A 455 1
- [12] Eckart A, Baganoff F K, Zamaninasab M, Morris M, Schödel R, Meyer L, Muzic K, Bautz M W, Brandt W N, Garmire G P, Ricker G R, Kunneriath D, Straubmeier C, Duschl W, Dovciak M, Karas V, Markoff S, Najarro F, Mauerhan J, Moultaka J and Zensus A 2008 A&A 479 625.
- [13] Eisenhauer F, Genzel R, Alexander T, Abuter R, Paumard T, Ott T, Gilbert A and Gillessen S 2005 ApJ 628 246
- [14] Genzel R, Eckart A, Ott T and Eisenhauer F, 1997 MNRAS 291 219
- [15] Genzel R, Pichon C, Eckart A, Gerhard O E and Ott T, 2000 MNRAS 317 348
- [16] Genzel R, Schödel R, Ott T et al. 2003b Nature 425 934
- [17] Ghez A, Klein B L, Morris M, and Becklin E E 1998 ApJ 509 678
- [18] Gillessen S, Eisenhauer F, Quataert E, Genzel R, Paumard T, Trippe S, Ott T, Abuter R, Eckart A, Lagage P O, Lehnert M D, Tacconi L J, and Martins F 2006a ApJ 640 163
- [19] Gillessen S, Perrin G, Brandner W, Straubmeier C, Eisenhauer F, Rabien S, Eckart A, Lena P, Genzel R, Paumard T, Hippler S, 2006b Advances in Stellar Interferometry, Proceedings of the SPIE 6268 626811
- [20] Hawley J F and Balbus S A 1991 ApJ 376 223
- [21] Hornstein S D, Matthews K, Ghez A M, Lu J R, Morris M, Becklin E E, Rafelski M, and Baganoff F K 2007 ApJ 667 900
- [22] Krolik J H and Hawley J H 2002 ApJ 573 754
- [23] Liu S, Melia F, and Petrosian V 2006 ApJ 636 798
- [24] Meyer L, Eckart A, Schödel R, Dovciak M, Karas V and Duschl W J 2007 A&A 473 707
- [25] Meyer L, Eckart A, Schödel R, Duschl W J, Muzic K, Dovciak M and Karas V 2006a A&A 460 15
- [26] Meyer L, Schödel R, Eckart A, Karas V, Dovciak M and Duschl W J 2006b A&A 458 L25
- [27] Pineault S 1981 ApJ 246 612
- [28] Schödel R, Ott T, Genzel R, Hofmann R, Lehnert M, Eckart A, Mouawad N and Alexander T 2002 Nature 419 694
- [29] Schödel R, Ott T, Genzel R, Eckart A, Mouawad N and Alexander T 2003 ApJ 596 1015
- [30] Shakura N I and Sunyaev R A 1973 A&A 24 337
- [31] Yusef-Zadeh F, Roberts D, Wardle M, Heinke C O and Bower G C 2006 ApJ 650 189