Discovery, photometry, and astrometry of 49 classical nova candidates in M81 galaxy††thanks: Partly based on observations obtained at the Gemini Observatory (acquired through the Gemini Science Archive), which is operated by the Association of Universities for Research in Astronomy, Inc., under a cooperative agreement with the NSF on behalf of the Gemini partnership: the National Science Foundation (United States), the Particle Physics and Astronomy Research Council (United Kingdom), the National Research Council (Canada), CONICYT (Chile), the Australian Research Council (Australia), CNPq (Brazil) and CONICET (Argentina)
Abstract
Aims. This paper reports on a search for new classical nova candidates in the M81 galaxy based on archival, as well as recent, new images.
Methods. We used images from 1999–2007 to search for optical transients in M81. The positions of the identified classical nova candidates were used to study their spatial distribution. Kolmogorov - Smirnov test (KS) and bottom-to-top (BTR) ratio diagnostic were used to analyze the nova candidate distribution and differentiate between the disk and the bulge populations.
Results. In total, 49 classical nova candidates were discovered. In this study, we present the precise positions and photometry of these objects, plus the photometry of an additional 9 classical nova candidates found by Neill & Shara (2004). With our large sample, we find a different spatial distribution of classical nova candidates when compared to the results of earlier studies. Also, an extraordinarily bright nova was found and studied in detail.
Key Words.:
galaxies: individual: M81 – binaries: close – novae1 Introduction
Novae are important objects for the study of close binary evolution, but our location in the Milky Way prevents us from getting an unbiased sample locally. Studying novae in nearby galaxies can provide a more homogeneous sample of these objects. For galaxies several Mpc away, long-term monitoring coupled with a rapid cadence using a relatively large telescope is necessary. Significant amounts of telescope time are difficult to obtain so searching for nova candidates using archival images (already obtained for a variety of different science studies) have the possibility for getting useful results. This method has several disadvantages,including a lack of control over cadence, bandpasses, and exposure depth.
The outburst of classical novae (CNe) are caused by explosive hydrogen burning on the white dwarf (WD) surface of a close binary system with material transfer from the companion star onto the WD surface. During the thermonuclear runaway, a fraction of the envelope is ejected, while a part of it remains in steady nuclear burning on the WD surface (José & Hernanz 1998; Prialnik & Kovetz 1995). This powers a supersoft X-ray source (SSS). The duration of the SSS phase is inversely related to the WD mass (Pietsch et al. 2006). Since WD envelope models also show that the duration of the SSS phase depends on the metalicity of the envelope, monitoring of the SSS phase of CNe also provides important information about the chemical composition of the post-outburst envelope (Pietsch et al. 2006). Results of recent work aimed at X-ray monitoring optical novae in M31 (Pietsch et al. 2006) bring new important results, while showing the necessity of having a good catalog of optical novae available for such studies.
Nearby galaxies with high annual nova rates are the best targets for statistically conclusive studies of the properties of extragalactic novae at optical, as well as X-ray, wavelengths. Besides M31, the M81 galaxy is another nearby large spiral galaxy. Only two recent papers aimed at the study of CNe in M81 have been published up to now – Shara et al. (1999) and Neill & Shara (2004). Here, we take advantage of M81 being a relatively common target for optical imaging and, in order to search for classical nova (CN) candidates in this galaxy, we analyze available archival CCD images, together with our recent images.
2 Observations and data reduction
| ID | Observer | Observatory | Telescope | CCD |
|---|---|---|---|---|
| (1) | S. Hameed, D. Thilker | KPNO | 4-m Mayall | Mosaic |
| (2) | P. Sorensen | La Palma | 2.54-m INT | WFC |
| (3) | M. Azarro | La Palma | 2.54-m INT | WFC |
| (4) | R. G. McMahon | La Palma | 2.54-m INT | WFC |
| (5) | S. Maddox | La Palma | 2.54-m INT | WFC |
| (6) | H. Deeg | La Palma | 2.54-m INT | WFC |
| (7) | A. Helmi | La Palma | 2.54-m INT | WFC |
| (8) | A. Herrero | La Palma | 2.54-m INT | WFC |
| (9) | L. C. Ho | HST | ACS-WFC | |
| (10) | S. J. Smartt | HST | ACS-WFC | |
| (11) | J. P. Huchra | HST | ACS-WFC | |
| (12) | Y. Taniguchi et al. | Mauna Kea | 8.3-m SUBARU | SuprimeCam |
| (13) | P. Garnavich et al. | Mt. Graham | 1.83-m VATT | VATT2K |
| (14) | J. E. Drew | La Palma | 2.54-m INT | WFC |
| (13) | P. Garnavich et al. | Mt. Graham | 1.83-m VATT | VATT2K |
| (14) | J. E. Drew | La Palma | 2.54-m INT | WFC |
| (15) | P. Garnavich, B. Tucker | KPNO | 3.5-m WIYN | Mini-Mosaic |
| (16) | Kaz, Yamada, Nakata | Mauna Kea | 8.3-m SUBARU | SuprimeCam |
| (17) | Arimoto, Ferguson, Jablonka | Mauna Kea | 8.3-m SUBARU | SuprimeCam |
| (18) | P. Garnavich | KPNO | 3.5-m WIYN | Mini-Mosaic |
| (19) | K. Nandra | La Palma | 4.2-m WHT | PFIP |
| (20) | J. Beckman | La Palma | 2.54-m INT | WFC |
| (21) | D. Christian | La Palma | 2.54-m INT | WFC |
| (22) | K. Hornoch | Ondřejov | 0.65-m | AP7p |
| (23) | K. Hornoch | Lelekovice | 0.35-m | G2CCD-1600 |
| (24) | P. Cagaš | Zlín | 0.26-m | G2CCD-3200 |
| (25) | P. Cagaš, P. Cagaš, Jr. | Zlín | 0.26-m | G2CCD-3200 |
| (26) | P. Cagaš, V. Přibík | Zlín | 0.26-m | G2CCD-3200 |
| (27) | V. Přibík | Zlín | 0.26-m | G2CCD-3200 |
| (28) | L. Donato, G. Sostero | Remanzacco | 0.45-m | FLI-IMG 1001E |
| (28) | M. Gonano, V. Gonano | Remanzacco | 0.45-m | FLI-IMG 1001E |
| (29) | A. Lepardo, V. Santini | Remanzacco | 0.45-m | FLI-IMG 1001E |
| (30) | A. Tonelli | Roma | 0.13-m | SXV-H9 |
| (31) | Inseok Song | Gemini Observatory | 8.1-m GEMINI North | GMOS-N |
Most of the images we used were obtained from archives of large and medium-size telescopes such as Subaru, Gemini North, HST, the William Herschel Telescope and the Isaac Newton Telescope. Archival images were downloaded as raw FITS files and then processed, with the exception of the images from HST-ACS, which were obtained as fully processed and calibrated .DRZ FITS files. We also obtained recent images to add substantially to our data using medium-size telescopes including Mayall 4-m, WIYN 3.5-m and VATT 1.83-m plus additional images from small telescopes. Observatories, telescopes, CCD cameras and names of observers for all the images used are given in Table 1.
Using archival images originally obtained for different purposes and taking data from many different telescopes brings a certain amount of inhomogeneity into the data collected. The archival data have a variety of fields of view (FOV), field centers, limiting magnitudes and passbands which complicate the analysis. Most of the images used come from the 2.54-m Isaac Newton Telescope at the La Palma and these images were taken using a wide-field CCD camera with the FOV about half a degree wide, centered mostly on the core of the M81 galaxy. They, as well as our recent images from the Mayall 4-m, cover whole galaxy. Our images from the WIYN 3.5-m with a smaller FOV of 9.7′ 9.7′ cover the central part of the galaxy.
The images from the Subaru, Gemini, WHT and VATT are not centered on the galaxy center but in all cases they cover considerable parts of the M81 galaxy, including the nucleus. The archival images from the HST-ACS taken in the wide-field mode are a special case. They cover relatively small area of 3.4′ 3.4′ of the central part of the galaxy. Generally, the spatial coverage of the entire galaxy by the images used is rather uniform, with an exception of outer parts of the galaxy, where coverage by images is less frequent when compared with the central region.
Most of the images were taken using the narrow-band and broad-band R (or SDSS r’) filters. Also, B and V filtered images were used, as well as HST-ACS F814W and F658N filtered images. In the special case of the two CN candidates M81N 2007-04a and M81N 2007-04b, unfiltered images were also used, having been taken using small telescopes; unfiltered images were necessary to achieve a sufficient signal-to-noise ratio (S/N).
Standard reduction procedures for raw CCD images were applied (bias and dark-frame subtract and flat-field correction) using SIMS111http://ccd.mii.cz/ and Munipack222http://munipack.astronomy.cz/ programs. Reduced images of the same series were co-added to improve the S/N ratio (total exposure time varied from a few minutes up to about three hours). The gradient of the galaxy background of co-added images was flattened by the spatial median filter using SIMS. These processed images were used to search for nova candidates, photometry and astrometry.
2.1 Searching for novae
The search for nova candidates was performed by means of visual comparison of an image with the best available image taken in the same passband with a substantial separation in time. A majority of the archival images were taken in the narrow-band filter, so we were able to construct a deep image by co-adding many 2.54-m Isaac Newton Telescope images and this image was then used as a “master” comparison for searching through other images. To confirm their transient nature, the nova candidates were required to be missing on images with sufficiently deep limiting magnitude, taken in epochs out of the span of the observed outburst.
When a transient was found, we inspected all single images used for co-added frames to exclude the possibility of cosmic ray hit or any defect on the CCD detector or processing artifact. Brightness limits were estimated on deep images for all nova candidates to confirm their transient nature. Once the transient’s existence is confirmed, we performed photometry and astrometry.
For a transient to be classified as a CN candidate its absolute magnitude had to be sufficiently high, and its time span of observability had to be relatively short ( year) in available images of the period 1999–2007. We found variable objects that do not meet these thresholds and such objects are not presented here.
2.2 Photometry
When an object was classified as CN candidate, photometry and astrometry were done following as follows. “Optimal photometry” (based on fitting of PSF profiles) using GAIA333http://www.starlink.rl.ac.uk/gaia and astrometry using APHOT (a synthetic aperture photometry and astrometry software developed by M. Velen and P. Pravec at the Ondřejov observatory, see Pravec et al. 1994) were performed.
For narrow-band photometry we calibrated 17 stars in the M81 field using the white dwarf HZ 44 as a spectrophotometric standard star (Massey & Strobel 1988, Landolt & Uomoto 2007). and magnitudes for comparison stars located in the M81 field were taken from Perelmuter & Racine (1995). The HST-ACS images were an exception - the magnitudes in the STMAG photometric system were derived using the standard procedure for HST-ACS drizzled (DRZ) images described by Sirianni et al. (2005).
2.3 Astrometry
For astrometry, we created (with help of M. Velen and P. Pravec) a special catalog of fainter stars in the M81 field derived from the 2.5-m INT telescope images corrected to the world coordinate system (WCS) using stars from the USNO-A 2.0 catalog. Depending on the field of view, tens to more than 300 stars from this catalog were used for WCS mapping of images. The mean residual of catalog positions is about 0.2′′and the nova positions derived have uncertainties in order of tenths of arcsecond.
3 Results
In total, we classified 49 transient objects as CN candidates. We also independently detected additional 9 novae from the total number of 12 novae already found by Neill & Shara (2004). The photometry results for our 49 CN candidates are given in Table Discovery, photometry, and astrometry of 49 classical nova candidates in M81 galaxy††thanks: Partly based on observations obtained at the Gemini Observatory (acquired through the Gemini Science Archive), which is operated by the Association of Universities for Research in Astronomy, Inc., under a cooperative agreement with the NSF on behalf of the Gemini partnership: the National Science Foundation (United States), the Particle Physics and Astronomy Research Council (United Kingdom), the National Research Council (Canada), CONICYT (Chile), the Australian Research Council (Australia), CNPq (Brazil) and CONICET (Argentina), while the results for the 9 novae already found by Neill & Shara (2004) are summarized in Table Discovery, photometry, and astrometry of 49 classical nova candidates in M81 galaxy††thanks: Partly based on observations obtained at the Gemini Observatory (acquired through the Gemini Science Archive), which is operated by the Association of Universities for Research in Astronomy, Inc., under a cooperative agreement with the NSF on behalf of the Gemini partnership: the National Science Foundation (United States), the Particle Physics and Astronomy Research Council (United Kingdom), the National Research Council (Canada), CONICYT (Chile), the Australian Research Council (Australia), CNPq (Brazil) and CONICET (Argentina). Typical errors of photometry are 0.1 – 0.2 mag. The precise positions, offsets from the M81 center, designations and discoverers of 49 CN candidates are given in Table 2.
| No. | Namea | R.A. | Decl. | Offset | Disc.b | |
|---|---|---|---|---|---|---|
| M81N | J2000 | J2000 | R.A. | Decl. | ||
| 1999-1 | 1999-11a | 09 55 34.11 | +69 01 49.1 | 5.0′′E | 126.0′′S | (c) |
| 1999-2 | 1999-11b | 09 54 56.16 | +69 03 56.8 | 198.4′′W | 1.7′′N | (c) |
| 2000-1 | 2000-11a | 09 55 29.50 | +69 02 52.4 | 19.7′′W | 62.7′′S | (c) |
| 2000-2 | 2000-12a | 09 55 54.31 | +69 00 50.7 | 113.4′′E | 184.4′′S | (a) |
| 2001-1 | 2001-01a | 09 55 21.08 | +69 02 06.4 | 64.9′′W | 108.7′′S | (b) |
| 2001-2 | 2001-01b | 09 56 03.25 | +69 05 12.2 | 161.1′′E | 77.1′′N | (b) |
| 2001-3 | 2001-01c | 09 55 42.54 | +69 03 36.8 | 50.2′′E | 18.3′′S | (b) |
| 2001-4 | 2001-01d | 09 55 39.49 | +69 02 46.8 | 33.9′′E | 68.3′′S | (b) |
| 2001-5 | 2001-01e | 09 55 36.77 | +69 04 03.5 | 19.3′′E | 8.4′′N | (b) |
| 2001-6 | 2001-01f | 09 55 31.12 | +69 04 59.5 | 11.0′′W | 64.4′′N | (b) |
| 2001-7 | 2001-01g | 09 56 09.15 | +69 01 06.4 | 193.0′′E | 168.7′′S | (b) |
| 2001-8 | 2001-01h | 09 55 04.31 | +69 03 10.0 | 154.7′′W | 45.1′′S | (b) |
| 2002-1 | 2002-12a | 09 56 03.50 | +69 02 50.4 | 162.6′′E | 64.7′′S | (a) |
| 2002-2 | 2002-12b | 09 55 32.30 | +69 03 50.0 | 4.7′′W | 5.1′′S | (a) |
| 2002-3 | 2002-12c | 09 55 28.30 | +69 03 39.9 | 26.1′′W | 15.2′′S | (a) |
| 2002-4 | 2002-12d | 09 55 20.81 | +69 02 56.5 | 66.3′′W | 58.6′′S | (a) |
| 2002-5 | 2002-12e | 09 55 15.68 | +69 03 23.5 | 93.8′′W | 31.6′′S | (a) |
| 2003-1 | 2003-05c | 09 56 07.47 | +69 03 57.0 | 183.8′′E | 1.9′′N | (a) |
| 2003-2 | 2003-09a | 09 55 40.76 | +69 02 35.5 | 40.7′′E | 79.6′′S | (a) |
| 2003-3 | 2003-09b | 09 55 53.81 | +69 02 10.6 | 110.7′′E | 104.5′′S | (a) |
| 2003-4 | 2003-09c | 09 55 33.27 | +69 03 37.5 | 0.5′′E | 17.6′′S | (a) |
| 2003-5 | 2003-05a | 09 55 27.19 | +69 04 17.1 | 32.1′′W | 22.0′′N | (a) |
| 2003-6 | 2003-05b | 09 54 53.85 | +69 01 11.1 | 211.0′′W | 164.0′′S | (a) |
| 2004-1 | 2004-02c | 09 55 34.71 | +69 04 20.3 | 8.2′′E | 25.2′′N | (a) |
| 2004-2 | 2004-02a | 09 55 27.47 | +69 04 51.6 | 30.6′′W | 56.5′′N | (a) |
| 2004-3 | 2004-02b | 09 55 33.82 | +68 58 32.6 | 3.5′′E | 322.5′′S | (a) |
| 2004-4 | 2004-09a | 09 55 43.22 | +69 03 40.9 | 53.9′′E | 14.2′′S | (a) |
| 2005-1 | 2005-12a | 09 56 15.23 | +69 00 56.9 | 225.7′′E | 178.2′′S | (a) |
| 2005-2 | 2005-12b | 09 55 33.74 | +69 05 40.5 | 3.0′′E | 105.4′′N | (a) |
| 2005-3 | 2005-01a | 09 56 08.74 | +69 04 24.3 | 190.6′′E | 29.2′′N | (a) |
| 2005-4 | 2005-11a | 09 55 27.53 | +69 04 57.3 | 30.2′′W | 62.2′′N | (a) |
| 2006-1 | 2006-02a | 09 55 35.49 | +69 04 08.6 | 12.4′′E | 13.5′′N | (b) |
| 2006-2 | 2006-02b | 09 55 33.98 | +69 03 36.3 | 4.3′′E | 18.8′′S | (b) |
| 2006-3 | 2006-02c | 09 55 15.16 | +69 06 12.1 | 96.5′′W | 137.0′′N | (b) |
| 2006-4 | 2006-02d | 09 55 40.76 | +69 03 31.1 | 40.7′′E | 24.0′′S | (b) |
| 2006-5 | 2006-02f | 09 55 30.40 | +69 03 35.6 | 14.9′′W | 19.5′′S | (b) |
| 2006-6 | 2006-02e | 09 55 12.21 | +69 00 19.1 | 112.5′′W | 216.0′′S | (b) |
| 2006-7 | 2006-12a | 09 55 41.29 | +69 04 20.8 | 43.5′′E | 25.7′′N | (d) |
| 2006-8 | 2006-12b | 09 55 43.01 | +69 03 56.8 | 52.7′′E | 1.7′′N | (d) |
| 2006-9 | 2006-03a | 09 55 50.82 | +69 04 03.8 | 94.6′′E | 8.7′′N | (a) |
| 2006-10 | 2006-03b | 09 55 39.52 | +69 01 33.3 | 34.0′′E | 141.8′′S | (a) |
| 2006-11 | 2006-02g | 09 55 28.62 | +69 01 51.2 | 24.4′′W | 123.9′′S | (b) |
| 2006-12 | 2006-01a | 09 55 44.16 | +69 02 58.4 | 58.9′′E | 56.7′′S | (a) |
| 2006-13 | 2006-02h | 09 55 35.84 | +69 03 55.7 | 14.3′′E | 0.6′′N | (a) |
| 2006-14 | 2006-02i | 09 55 36.27 | +69 03 11.2 | 16.6′′E | 43.9′′S | (a) |
| 2006-15 | 2006-02j | 09 55 31.59 | +69 02 51.7 | 8.5′′W | 63.4′′S | (a) |
| 2007-1 | 2007-01a | 09 55 19.75 | +69 03 26.0 | 72.0′′W | 29.1′′S | (c) |
| 2007-2 | 2007-04a | 09 55 28.58 | +69 04 21.6 | 24.6′′W | 26.5′′N | (e) |
| 2007-3 | 2007-04b | 09 55 31.30 | +69 05 28.9 | 10.0′′W | 93.8′′N | (f) |
Notes: a: following CBAT nomenclature for novae in M31
(see http://cfa-www.harvard.edu/iau/CBAT_M31.html)
b: Discoverers of novae: (a) K. Hornoch, (b) K. Hornoch, S. Hameed, D. Thilker, (c) K. Hornoch & P. Garnavich,
(d) K. Hornoch, P. Garnavich, B. Tucker, (e) K. Hornoch, P. Cagaš, P. Cagaš, Jr., (f) V. Přibík, K. Hornoch, P. Cagaš
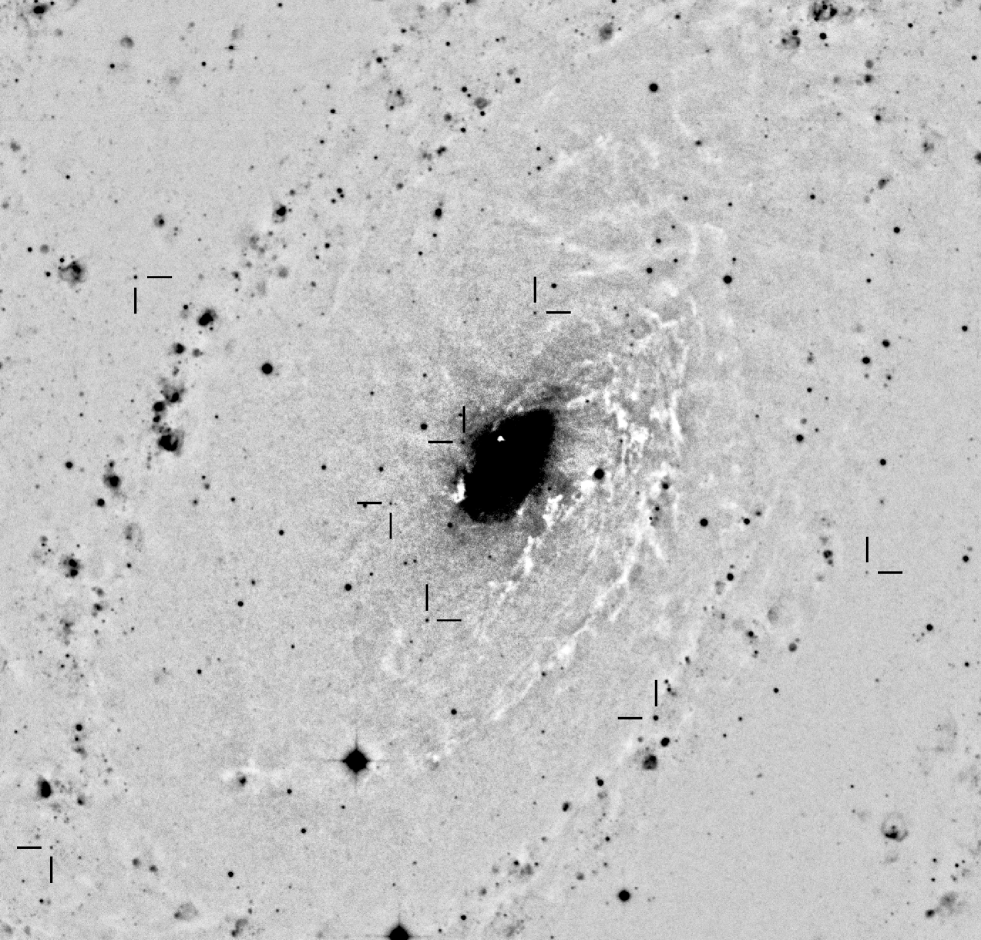
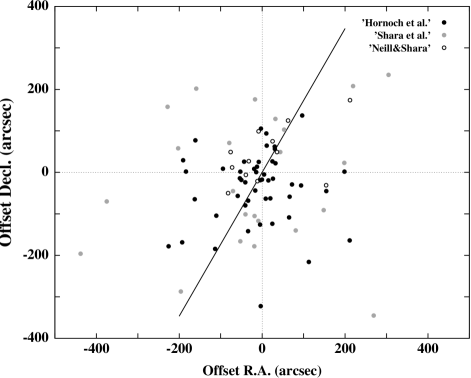
Finder charts for all of 49 objects reported in this paper are accessible at the Supernovae webpage444http://www.supernovae.net/novae.html. Positions of these objects, together with positions of CN candidates from other studies are shown in Fig. 7. We note that the major axis of the galaxy is plotted by solid line. We adopt for the position angle of the major axis of M81 (see Goad 1976).
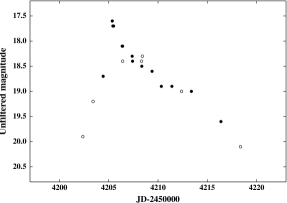
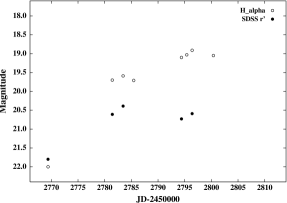
In the course of our survey, we have discovered a very interesting nova M81N 2007-04b in images taken by P. Cagaš with the 0.26-m telescope at the Zlín observatory. Immediately after the discovery, we started a campaign for monitoring this exceptionally bright nova. We carried out unfiltered photometry using relatively small telescopes. Co-added images with typical exposure times of about 1.5 – 2 hours enabled us to carry out photometry with a relative high precision (typical errors 0.1 – 0.15 mag). The light curve has very good temporal coverage and shows a relatively slow rise and then a typical decline phase from the maximum light for a fast nova (see Fig. 2). Using our photometry we derived the rate of decay of 0.17 magnitudes per day in good agreement with 0.15 magnitudes per day derived from the decline phase obtained from the photometry in SDSS r’ filter and published by Rau et al. (2007). The time interval of decay by 2 magnitudes from the maximum light days; it suggests that this object falls into the group of fast novae. Three spectra of this nova were obtained using the 10-m Keck I telescope, one at the maximum light phase by Silverman et al. (2007) and two by Rau et al. (2007) five days later, suggesting type FeIIn spectral classification. This nova became one of the brightest and most thoroughly studied novae in the M81 galaxy and it is probably only the second nova in M81 studied spectroscopically. As an example of a slow nova can serve M81N 2003-05c; SDSS r’ and narrow-band photometry were obtained, as shown in Fig. 3. Although it shows an incomplete light curve, very slow brightness changes are clearly visible – the rising phase in narrow-band lasted 25 days. Also it is clearly visible that the maximum phase in the SDSS r’ band (which includes entire emission) was reached significantly earlier than in the narrow-band which is typical for classical nova explosions, in which maximum intensity of emission occurs after the maximum light phase in continuum.
3.1 Spatial distribution
We used two simple methods to describe a spatial distribution of our CN candidates. In the first method we compared cumulative radial distributions of the bulge, the disk, and the total light of M81 with the cumulative radial distribution of our CN candidates. The second method is based on a bottom-to-top ratio of novae in the galaxy (see below). All 49 CN candidates from this work plus 9 additional novae independently found on our images and already published by Neill & Shara (2004) were used.
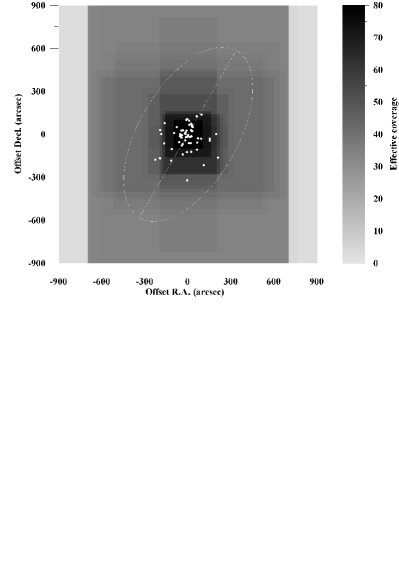
In the first method, we used the same cumulative radial distribution for the bulge, the disk, and the total light, as Neill & Shara (2004) by fitting the curves in their Fig. 10 to spline functions. These cumulative radial distributions, together with the cumulative radial distribution of our CN candidates, corrected for effective coverage (see below and Fig. 4) are plotted in Fig. 5.
We did not detected any CN candidates beyond about 5′from the galaxy center, so we normalized all distributions to unity at radius of 323′′, where the farthest CN candidate was detected. A most probable explanation for why we did not detect any CN candidates in the outer regions of the galaxy is a sparse time coverage of the images covering the whole galaxy (see Section 4.3). Corrected and raw cumulative radial distributions of CN candidates were constructed and are plotted in Fig. 4 and show that differences among them are small. So we conclude that selection effects (up to radius of 323′′) do not influence the results significantly. The raw cumulative radial distribution of the CN candidates without correction is shown as a thin solid line. A second radial distribution was constructed by counting the contribution of each nova candidate as , where is the number of images that include the nova’s position. In a third distribution, the radial distribution of candidates was corrected by calculating the effective coverage (see Section. 3.2). The corrected and the effective coverage corrected cumulative radial distributions are plotted in Fig. 4 as bold dotted and bold solid lines, respectively.
We use the Kolmogorov–Smirnov (KS) test to quantify the similarity between the cumulative radial distribution of CN candidates and the cumulative radial distributions of three galaxy light distributions. The best match with the distribution of CN candidates is the total light distribution which can be ruled out only at the 2.3% confidence level. The bulge and the disk light distributions can be ruled out at the 24% and confidence levels, respectively. The excellent match between the total light distribution indicates that both the disk and the bulge are contributing novae to our sample.


As the second method for diagnostic of the bulge-to-disk ratio of novae we used a method described in Hatano et al. (1997) and used in the previous works by Neill & Shara (2004) and Shara et al. (1999), which, however, differ in their results. The method evaluates the effect of dust on the distribution of observed novae in the bulge region. If novae are present primarily in the bulge, a large asymmetry in their distribution would be visible because the dust in the disk obscures apparent bulge novae behind the disk. On the other hand, if novae arise primarily in the disk, only small asymmetry should be present. The major axis of the galaxy is used as a dividing line, and the numbers of novae above and below this line are compared. The ratio is called a bottom-to-top ratio (BTR).
For the full sample of 58 CN candidates, we divide the galaxy along the major axis into the north-east side (top of the bulge) and into the south-west side (bottom of the bulge). We also separate these subsamples into CN candidates within 90″, 150″, and 210″from the nucleus of M81. These numbers were then corrected for effective coverage and are presented in Table 3 together with uncorrected numbers and corresponding BTRs. The numbers of novae and BTRs from Shara et al. (1999), and Neill & Shara (2004) were counted for the same distances from the centre, and are presented in the table as well.
The BTR from our data is close to unity and is roughly independent of radial distance. This fact is important in this method, and probably it is caused by a higher number of CN candidates in our dataset in comparison with previous works. Also, correction for effective coverage caused insignificant changes to the BTR, and thus, inhomogeneity in the spatial coverage present in our dataset did not strongly affect the results.
The fact that the asymmetry in spatial distribution of our CN candidates is low (corresponding to BTR close to 1) supports the hypothesis of significant contribution of the disk population of novae.
In previous work, the BTR varies from 1.0 to 1.8 and from 0.25 to 0.5 (Shara et al. 1999, Neill & Shara 2004, respectively). The results from the former indicated low bulge-to-disk nova ratio, whereas Neill & Shara (2004) concluded that the bulge-to-disk nova ratio is very high. However, these studies suffer from incompleteness in the bulge area (Shara et al. 1999), and a small sample size (Neill & Shara 2004), and these problems could have resulted in the inconsistent results.
It should be noted that while our results are based on an assumption that the dust distribution in M81 is similar to that in M31, their interpretation has to be done with caution. The fact that M81 is slightly more face-on than M31 should slightly reduce the asymmetry in the bulge-to-disk nova ratio (e.g., a face-on galaxy would show no asymmetry regardless of the bulge-to-disk ratio at all). A detailed model of dust distribution in M81 would be necessary for making more quantitative conclusions from our results.
| d | d | d | |||||||||
|---|---|---|---|---|---|---|---|---|---|---|---|
| Bottom | Top | BTR | Bottom | Top | BTR | Bottom | Top | BTR | |||
| This work, uncorrected | 16.0 | 16.0 | 1.00 | 21.0 | 22.0 | 0.95 | 25.0 | 27.0 | 0.93 | ||
| This work, corrected for effective coverage | 16.2 | 16.2 | 1.00 | 21.3 | 22.3 | 0.96 | 25.3 | 27.4 | 0.92 | ||
| Shara et al. (1999) | 1.0 | 1.0 | 1.00 | 4.0 | 4.0 | 1.00 | 9.0 | 5.0 | 1.80 | ||
| Neill & Shara (2004) | 2.0 | 4.0 | 0.50 | 2.0 | 8.0 | 0.25 | 3.0 | 8.0 | 0.38 |
3.2 Correction for effective coverage
A probability of nova discovery obviously depends on a number of images covering the nova position. In order to eliminate these selection effects, we created a map in R.A. and declination offset describing a coverage of the galaxy and its surroundings. For each point of this map, the number of images, , covering this point was computed, where if the -th image includes the point and if it doesn’t. Since the limiting magnitude () varies for different images, when counting the number of images, contribution of each image was weighted by a factor , so that the total effective coverage of the points was computed as
| (1) |
where is the limiting magnitude of -th image. The factor in the above formula was set to or , depending on whether the -th image was saturated at the position of examined point or not.
The symbol in this section refers to limiting magnitude in narrow-band filter. Due to a low cadency of images in our survey, we suppose that most of the novae was detected after they reached maximum of brightness; we used the passband for since the novae have strong emission in during their decline phase. Since about half of the images was not taken in filter, the limiting magnitudes estimated for these images were transformed to in by subtracting of 2.5 mag for unfiltered images and images taken in B and V, and of 2 mag for images taken in R and SDSS r’ filters.
The function is defined as dependence of a number of images required to detect one CN candidate on a limiting magnitude . The function was estimated empirically by fitting four pairs of values , , with
| (2) |
where , , are values averaged from of images obtained from INT, Gemini, WIYN and Ondřejov 0.65-m telescopes. The values are computed as , where and are numbers of images taken and numbers of CN candidates discovered by -th telescope, respectively. For most of images from each of four telescopes separately, differences between of individual images and are lower than 1 mag. In case of INT, Gemini and WIYN we used images taken in narrow-band filter, the images from 0.65-m telescope were unfiltered, but their limiting magnitudes were corrected to as is described above.
Resulting map of the effective coverage is shown on Fig. 6. We note that maximum value of over whole map differs by 27% from maximum value of , and a ratio between maximal effective coverage and the effective coverage in the outer regions of the galaxy is 2.3.
4 Discussion
While we present a large number of CN candidates, due to our limited temporal coverage, some of our nova candidates are detected on images from only one night. Although positive detection in at least two nights are commonly required, we also present here objects which do not meet this requirement. Here we consider possible sources of bias in cases when only one positive detection of the nova candidate was made. Two types of bias were taken into account – the first are image artifacts, the second are real objects. Image artifacts with star-like appearance can be caused by cosmic ray hits (radiation events) and by defects on the CCD chip. From the class of real objects, we took into account Kuiper belt objects and variable stars. Cosmic ray hits usually have (mainly on well-sampled images) a different PSF profile and as such are reliably identified only on one image from a series of images used for a co-added image. This enables us to remove such cases relatively simply.
CCD chip artifacts (defects) may produce false objects, even if correct image processing procedures are used. Checking every image from the series may not identify such cases reliably, because many of the images we used were guided and with no shifts between them, so we also checked the PSF profile of suspicious objects in the co-added image.
4.1 Kuiper belt objects
Kuiper belt objects (KBOs) are particular class of real objects which can be potentially considered as CN candidates when an image from one night only is available. A relatively small apparent motion (up to about 0.06′′/min) can produce star-like appearance in an image exposed during an interval in the order of minutes, even if a large telescope is used. Although the chance of detecting a sufficiently bright KBO in a relatively small field, furthermore placed at a high ecliptic latitude, is pretty small, we can estimate an upper limit of probability. All objects detected in only one night were brighter than , mag with an exception of the object M81N 2004-09a. This object was found on the HST-ACS F814W filtered image and thanks to the very good resolution of this image, an apparent motion of a typical KBO should be visible. Moreover, the probability that some KBO brighter than mag at this position will fall into small FOV of HST-ACS is very low. We assume that the total number of KBOs brighter than mag (which corresponds to at the distance of 50 AU) is (based on Jedicke et al., 2002). A typical image covers approximately 400′2 and we used images from 60 epochs in total, so the probability that we detect a KBO brighter than mag is , which is the hard upper limit. If we take into account that many of them would be possible to distinguish using other images taken in similar epochs and that KBOs are concentrated to small ecliptic latitudes (ecliptic latitude of M81 is 51.6 deg), it is very unlikely that some of our CN candidates can really be KBOs.
4.2 Variable stars
Estimating possible contamination of our sample of M81 CN candidates by other types of variable stars presents a difficult problem. Objects detected on single epochs, as well as those detected in multiple nights could be confused with non-novae. All objects that were classified as CN candidates have mag or brighter on available images with the exception of objects M81N 2004-09a and M81N 2005-01a which have recorded magnitudes brighter than and 22.5, respectively. Assuming a distance modulus of 27.8 mag for M81, the magnitude limits correspond to mag (and to mag) for most candidates (M81N 2004-09a and M81N 2005-01a, respectively). We may discard types of variable stars which remain fainter than mag. Thus, only Luminous Blue Variables (LBV), Yellow Supergiants (YHG), Cepheids and supernovae remain as eligible contaminants.
Considering their typical brightness, LBV stars should be visible most of the time above the limit of most CCD frames used. This behavior does not meet with our CN candidates which were visible only during a limited period.
YHG stars have very small amplitudes which excludes this type of variables as a possible source of CN candidates contamination.
Cepheids have a sufficiently high absolute magnitude to be recorded in our images, but they have relatively small amplitude (around 2 magnitudes), which makes the possibility of confusing some of the Cepheids with our CN candidates relatively small. Moreover, Cepheids should be recorded several times (since they are reaching at least -4.5 mag of absolute magnitude) over more than 7-year period covered by images.
Although supernovae (SNe) have more than sufficient luminosity to be recorded in our data, the possibility of contamination by M81 SNe is extremely improbable for a number of reasons, such as very low production of SNe in any galaxy (one per tens of years at best) and the bright apparent magnitude around maximum light phase, thus making a SN in M81 very easy to detect around its maximum well before their brightness decreases into the range of our CN candidates. Moreover, SNe have a very slow brightness decay after fading many magnitudes below the maximum – this makes it impossible to confuse such object in our group of CN candidates.
Distant background SNe are more likely to invade the CN sample than supernovae in M81. We estimated the number of background SNe which could contaminate our sample of CN candidates using results from the Sloan Digital Sky Survey (SDSS). They found approximately 500 SNe brighter than mag (it is similar to a typical limiting magnitude of our images) over 9 months of searching 300 square degrees (Frieman et al. 2008), i.e. 0.2 SNe per square degree per month. If our typical M81 image covers 0.11°2, we are expecting only SNe per month brighter than mag behind M81. Thus, we estimate that we could have recorded about two SNe in the interval of 90 months covered by our images. Furthermore, one can expect that light from background SNe to be obscured by dust in M81 so the number of background SNe brighter than our typical limiting magnitude should be even a bit lower than we estimated above (gaps in time coverage by our images in order of months could only decrease a probability of detection of background SN too). In the course of searching for CN candidates one probable background SN located close to an outer edge of M81 (exploded in faint anonymous galaxy with magnitude of ) was found by Hornoch (2008). Based on these results, we conclude that the contamination of our sample of CN candidates by background SNe is very low, with a probable number of zero.
Another possible contamination of our sample of CN candidates could be foreground (Galactic) variable stars that could be confused with a CN in M81. We suppose that the most probable candidates are flares of M-type stars. Based on a personal communication with S. Hawley (she used a model of Galactic M dwarf flare rates, Hawley et al. 2007) we are expecting at most 1 flare brighter than mag of M-type star fainter than mag during quiescent stage (see paragraph below), per square degree per year, in line of sight of M81.
Thus, we estimate that we could have recorded about one flare in the interval of 90 months. Like in the case of background SNe, gaps in time coverage by our images in order of months could only decrease the probability of detection of such flare.
All objects that were classified as CN candidates have mag or brighter on available images with the exception of two objects (M81N 2004-09a and M81N 2005-01a). We discard all of M dwarfs brighter than mag during quiescent stage because M dwarfs brighter than mag would be detected in our deep images and classified as variable stars.
Although the uncertainty of estimate of number of flares of M-type stars is large (to a factor of a few), mainly because an exact number of Galactic M dwarfs fainter than mag is unknown, we conclude that the contamination of our sample of CN candidates by flares of M-type stars is very low or nonexistent.
We cannot be absolutely sure that all of our CN candidates are really CNe because of the limited data available, we find that the contamination by other types of variable stars is probably very small. In any case, the contamination did not significantly affect the results of the spatial distribution of CN candidates.
4.3 Gaps in time coverage
As is mentioned above, the time spacing between images used differ, and long gaps were present between images covering whole area of the galaxy. Certainly, this would affect the number of CN candidates detected in the outer regions of the galaxy in comparison with central part (bulge), where the gaps between images were smaller.
Moreover, if a hypothesis that fast novae of He/N spectroscopic class are abundant in the disc population is right, then the number of CN candidates detected in the outer parts of the galaxy could be even more affected. That is because, though the novae of He/N class have higher maximal brightness, they typically have much more faster decline of luminosity than novae of FeII spectroscopic class.
Since the CNe are expected, but did not detected, in the outer regions of the galaxy, we simulated a probability that we did not detected any CN candidate there. We used 27 images, from which 23 cover whole galaxy and the rest most of the area of the galaxy. Most of them were obtained using narrow-band filter. The limiting magnitude of the images differ slightly, with an average value of 21.0 mag. Using distance modulus of 27.8 mag for M81, this gives an absolute limiting magnitude in of mag.
The simulation requires an estimate of the lifetime in of a typical nova, which means a number of days that a typical nova remains brighter than a given absolute magnitude. Using an assumption that novae in M81 have the same characteristics as novae in M31, we estimated the mean lifetime of a typical nova in on an average image covering the outer regions of the galaxy as days, or slightly more. This number was estimated from lifetime relation shown in Fig. 13 of Shafter & Irby (2001), where we used an absolute magnitude in of mag, according to average maximum magnitude for M31 novae of mag (Ciardullo et al. 1990) and distance modulus of 24.4 mag. The above values ( mag and 15.5 mag) can be slightly lower (i.e., the brightnesses higher), since Ciardullo et al. (1990) missed maximum light phase of some of their detected novae.
Next, we estimated the mean lifetime of novae of the He/N spectroscopic class. These novae are typically brighter (we are assuming maximum absolute magnitude in of mag), but they have higher decline rate (assuming mag/day). Thus, we esimated their mean lifetime as days too.
We assume that extremely fast novae are not very common; the assumption is based on results published by Ciardullo et al. (1990), Shafter & Irby (2001), and Neill & Shara (2004). However, we estimated their mean lifetime to be days by assuming that they can reach an absolute magnitude of in and have a corresponding rate of decline of mag/day.
In the simulation, we randomly distribute novae explosions in the time covered by all of 60 images used in our work, which was equal to 2735 days. If some of the 27 images (from which 23 cover whole galaxy and the rest most of the area of the galaxy) were taken during the nova lifetime, the nova was considered as detected. The process was repeated 10000 times, and the probability of nondetection of any nova was calculated as , where is number of runs during which no novae were detected on any of the 27 images. The results for from 1 to 40 and lifetimes of 100 and 40 days are presented in Fig. 8. The probability of nondetection drops below 20% for 5 and 9 novae with the lifetimes of 100 and 40 days, respectively. Based on these numbers, we concluded that we cannot rule out the possibility that our lack of novae detections in the outer regions of the galaxy is just a coincidence, and that we probably missed a few novae there.

5 Conclusions
We discovered and classified 49 transient objects as M81 CN candidates. Together with previously known CN candidates (35 objects in total; published by Shara et al., 1999 and by Neill & Shara, 2004), the number of all CN candidates is more than doubled. These results are important for future studies concerning the identification of optical counterparts of supersoft X-ray sources in the M81 galaxy and for possible identification of recurrent novae.
The relatively large number of CN candidates in this sample provides a more accurate view of the CN spatial distribution in M81 than we had before this study. There is no strong evidence of asymmetry in the distribution of our CN candidates across the major axis of M81. We cannot sustain the claim of a very high bulge-to-disk nova ratio in M81. Our results from the BTR diagnostic have give a low bulge-to-disk nova ratio and thus support the existence of a significant disk nova population.
The KS test applied to the radial distribution of our CN candidates and the M81 light distributions indicate a good match between the CN candidates and the total light of the parent galaxy with a high confidence level. This indicates that both CN populations, i.e., the disk and the bulge, are certainly present in the galaxy.
However, since we cannot rule out the possibility that we have missed a few novae in the outer part of the galaxy due to sparse time coverage with respect to the central part of the galaxy (and thus we tested conformity of distribution of galaxy light and CN candidates only up to radius of 323′′), the conclusions from this method are probably of lower significance than the BTR statistics.
We are not able to refine the annual nova rate due to time gaps in the coverage and a generally low cadence of images. However, the number of CN candidates detected is consistent with the previous result of 30 yr-1 (Neill & Shara, 2004) within relatively large uncertainties.
We have shown that relatively inhomogeneous material, as well as use of archival data originally obtained for different purposes, can be used to obtain significant results. However, only a long-period (three years running at least), deep (going down to = 21 mag) and comprehensive survey covering the whole galaxy with minimum detection incompleteness is able to provide an accurate bulge-to-disk nova ratio. Such a survey would significantly refine the characteristics of both bulge and disk nova populations as well as the total annual nova rate.
Acknowledgements.
This paper makes use of data obtained from the Isaac Newton Group Archive which is maintained as part of the CASU Astronomical Data Centre at the Institute of Astronomy, Cambridge. Based [in part] on data collected at [Subaru Telescope] and obtained from the SMOKA, which is operated by the Astronomy Data Center, National Astronomical Observatory of Japan. Guest User, Canadian Astronomy Data Centre, which is operated by the Herzberg Institute of Astrophysics, National Research Council of Canada. We want to thank to anonymous referee for his comments and recommendations, which helped to improve the manuscript considerably. We are grateful for spectroscopic confirmation of nova candidate M81N 2007-04b to J. M. Silverman, R. J. Foley and A. V. Filippenko and for obtaining and providing of M81 images to P. Cagaš, V. Přibík, P. Cagaš, Jr., G. Sostero, L. Donato, M. Gonano, V. Gonano, A. Tonelli, A. Lepardo and V. Santini. We thanks to A. Karska for assistance with getting of images with the WIYN telescope; to R.W. Argyle for help with obtaining the data from the ING Archive; to P. Cagaš for affording of SIMS software, to F. Hroch for affording of Munipack software and to M. Velen and P. Pravec for affording of Aphot software. Also we thanks to M. Wolf and W. Pietsch for valuable comments. This research has made use of the SIMBAD database, operated at CDS, Strasbourg, France, and of NASA’s Astrophysics Data System Bibliographic Services.References
- (1)
- (2) Baba, H., et al. 2002, in ADASS XI, eds. D. A. Bohlender, D. Durand, & T. H. Handley, ASP Conference Series, Vol.281, 298
- (3) Ciardullo, R., Shafter, A. W., Ford, H. C., Neill, J. D., Shara, M. M., Tomaney, A. B. 1990, ApJ, 356, 472C
- (4) Frieman, J. A., Bassett, B., Becker, A., et al. 2008, AJ, 135, 338
- (5) Garnavich, P. M., Hornoch, K., Cagaš, P., Přibík, V. 2007, CBET 924, 2
- (6) Garnavich, P. M., Hornoch, K., Silverman, J. M., Foley, R. J., Filippenko, A. V., Přibík, V., Cagaš, P. 2007, CBET 924, 3
- (7) Goad, J. W. 1976, ApJS, 32, 89
- (8)
- (9) Hatano, K., Branch, D., Fisher, A., Starrfield, S. 1997, ApJ, 487, 45
- (10) Hatano, K., Branch, D., Fisher, A., Starrfield, S. 1997, MNRAS, 290, 113
- (11) Hawley, S. L., et al. 2007, Bulletin of the American Astronomical Society, Vol. 38, p.920
- (12) Hornoch, K. 2008, The Astronomer’s Telegram, 1639, 1
- (13) Hornoch, K., Přibík, V., Cagaš, P. 2007, CBET 924, 1
- (14) Hornoch, K., Přibík, V., Donato, L., Sostero, G., Cagaš, P., Gonano, M., Gonano, V. 2007, CBET 938, 1
- (15) Jedicke, R., Larsen, J., Spahr, T. 2002, Observational Selection Effects in Asteroid Surveys (2002aste.conf…71J)
- (16) José, J. & Hernanz, M. 1998, ApJ, 494, 680
- (17) Landolt, A. U. & Uomoto, A. K. 2007, AJ, 133, 768
- (18) Massey, P., Strobel, K., Barnes, J. V., Anderson, E. 1988, ApJ, 328, 315
- (19) Monet, D. G. 1998, The 526,280,881 Objects In The USNO-A2.0 Catalog, (1998AAS…19312003M)
- (20) Neill, J. D., Shara, M. M. 2004, AJ, 127, 816
- (21) Perelmuter, J. M., Racine, M. 1995, AJ, 109, 1055
- (22) Pietsch, W., Haberl, F., Sala, G., Stiele, H., Hornoch, K., Riffeser, A., Fliri, J., Bender, R., Bühler, S., Burwitz, V., Greiner, J., Seitz, S. 2007, A&A, 465, 375
- (23) Pravec, P., Hudec, R., Soldán, J., Sommer, M., Schenkl, K. H. 1994, Experimental Astronomy, Volume 5, Issue 3-4, pp. 375-388
- (24) Prialnik, D. & Kovetz, A. 1995, ApJ, 445, 789
- (25) Rau, A., Gezari, S., Ofek, E. O. 2007, Astr. Tel. 1067
- (26) Shafter, A. W., Irby, B. K. 2001, ApJ, 563, 749S
- (27) Shara, M. M., Sandage, A., Zurek, D. R. 1999, PASP, 111, 1367
- (28) Sirianni, M., Jee, M. J., Benitez, N., Blakeslee, J. P., Martel, A. R., Meurer, G., Clampin, M., De Marchi, G., Ford, H. C., Gilliland, R., Hartig, G. F., Illingworth, G. D., Mack, J., McCann, W. J. 2005, PASP, 117, 1049
- (29)
[x]llrrrr
Photometry of nova candidates.
Observers, observatories, telescopes and CCDs for measurements are coded in column
comment according to Table 1. Note that the measurements in F814W and F658N filters
of HST-ACS are in STMAG photometric system. Measurements in band coded as “clear” are from
unfiltered images, using R-band magnitudes from comparison stars. Measurements with errors in
order of hundredths of magnitude are stated in two decimal places; measurements with
errors 0.1 mag and 0.3 mag are stated in one decimal place; the “:” mark is used
for measurements with uncertainty 0.3 mag.
JD Mag Band Comment
(2 450 000+)
\endfirstheadcontinued.
JD Mag Band Comment
(2 450 000+)
\endhead\endfoot
Nova No. 1999-1 = M81N~1999-11a
1501.982 21.21 R (13)
1501.998 21.5 V (13)
1877.998 [22.4 V (13)
1903.143 [23.6 V (16)
1912.626 [21.5 Ha (2)
2632.684 [22.7 r (3)
2632.721 [21.2 Ha (3)
2781.432 [21.6 Ha (4)
3378.917 [24.0 V (17)
3680.766 [23.8 R (19)
3792.677 [20.8 Ha (1)
3792.697 [21.4 R (1)
3793.869 [21.0 Ha (1)
Nova No. 1999-2 = M81N~1999-11b
1501.982 21.4 R (13)
1501.998 21.5 V (13)
1877.998 [22.4 V (13)
1903.143 [23.6 V (16)
1912.626 [21.5 Ha (2)
2632.684 [22.7 r (3)
2632.721 [21.2 Ha (3)
2781.432 [21.6 Ha (4)
3378.917 [24.0 V (17)
3680.766 [23.8 R (19)
3792.677 [20.8 Ha (1)
3792.697 [21.4 R (1)
3793.869 [21.0 Ha (1)
Nova No. 2000-1 = M81N~2000-11a
1501.982 [22.6 R (13)
1877.982 21.5 R (13)
1877.998 [22.4 V (13)
1903.143 [23.6 V (16)
1912.626 [21.5 Ha (2)
2632.684 [22.7 r (3)
2632.721 [21.2 Ha (3)
2781.432 [21.6 Ha (4)
3378.917 [24.0 V (17)
3680.766 [23.8 R (19)
3792.677 [20.8 Ha (1)
3792.697 [21.4 R (1)
3793.869 [21.0 Ha (1)
Nova No. 2000-2 = M81N~2000-12a
1501.982 [22.6 R (13)
1877.982 [22.5 R (13)
1877.998 [22.4 V (13)
1903.143 21.93 V (16)
1903.158 23.2 B (16)
1912.626 20.76 Ha (2)
2632.684 [22.7 r (3)
2632.721 [21.2 Ha (3)
2781.432 [21.6 Ha (4)
3378.917 [24.0 V (17)
3792.677 [20.8 Ha (1)
3792.697 [21.4 R (1)
3793.869 [21.0 Ha (1)
Nova No. 2001-1 = M81N~2001-01a
1903.143 21.37 V (16)
1903.158 21.93 B (16)
1912.626 18.32 Ha (2)
2632.721 [21.2 Ha (3)
2781.432 [21.6 Ha (4)
3378.917 [24.0 V (17)
3680.766 [23.8 R (19)
3792.677 [20.8 Ha (1)
3792.697 [21.4 R (1)
3793.869 [21.0 Ha (1)
Nova No. 2001-2 = M81N~2001-01b
1903.143 19.88 V (16)
1903.158 20.41 B (16)
1912.626 19.63 Ha (2)
2632.721 [21.2 Ha (3)
2781.432 [21.6 Ha (4)
3378.917 [24.0 V (17)
3680.766 [23.8 R (19)
3792.677 [20.8 Ha (1)
3792.697 [21.4 R (1)
3793.869 [21.0 Ha (1)
Nova No. 2001-3 = M81N~2001-01c
1903.143 23.0 V (16)
1903.158 23.1 B (16)
1912.626 20.3 Ha (2)
2632.721 [21.2 Ha (3)
2781.432 [21.6 Ha (4)
3378.917 [24.0 V (17)
3680.766 [23.8 R (19)
3792.677 [20.8 Ha (1)
3792.697 [21.4 R (1)
3793.869 [21.0 Ha (1)
Nova No. 2001-4 = M81N~2001-01d
1903.143 23.0 V (16)
1903.158 22.9 B (16)
1912.626 19.7 Ha (2)
2632.721 [21.2 Ha (3)
2781.432 [21.6 Ha (4)
3378.917 [24.0 V (17)
3680.766 [23.8 R (19)
3792.677 [20.8 Ha (1)
3792.697 [21.4 R (1)
3793.869 [21.0 Ha (1)
Nova No. 2001-5 = M81N~2001-01e
1877.982 21.1 R (13)
1877.998 21.3 V (13)
1912.626 19.9 Ha (2)
2632.721 [21.2 Ha (3)
2781.432 [21.6 Ha (4)
3680.766 [23.8 R (19)
3792.677 [20.8 Ha (1)
3792.697 [21.4 R (1)
3793.869 [21.0 Ha (1)
Nova No. 2001-6 = M81N~2001-01f
1903.143 [23.6 V (16)
1903.158 [24.1 B (16)
1912.626 20.32 Ha (2)
2632.721 [21.2 Ha (3)
2781.432 [21.6 Ha (4)
3680.766 [23.8 R (19)
3792.677 [20.8 Ha (1)
3792.697 [21.4 R (1)
3793.869 [21.0 Ha (1)
Nova No. 2001-7 = M81N~2001-01g
1903.143 22.0 V (16)
1903.158 23.1 B (16)
1912.626 21.06 Ha (2)
2632.721 [21.2 Ha (3)
2781.432 [21.6 Ha (4)
3378.928 [24.0 V (17)
3792.677 [20.8 Ha (1)
3792.697 [21.4 R (1)
3793.869 [21.0 Ha (1)
Nova No. 2001-8 = M81N~2001-01h
1903.143 23.2 V (16)
1903.158 23.7 B (16)
1912.626 20.63 Ha (2)
2632.721 [21.2 Ha (3)
2781.432 [21.6 Ha (4)
3378.928 [24.0 V (17)
3680.766 [23.8 R (19)
3792.677 [20.8 Ha (1)
3792.697 [21.4 R (1)
3793.869 [21.0 Ha (1)
Nova No. 2002-1 = M81N~2002-12a
1912.626 [21.5 Ha (2)
2632.684 19.39 r (3)
2632.721 19.86 Ha (3)
2781.432 [21.6 Ha (4)
3680.766 [23.8 R (19)
3792.677 [20.8 Ha (1)
3792.697 [21.4 R (1)
3793.869 [21.0 Ha (1)
Nova No. 2002-2 = M81N~2002-12b
1912.626 [20.9 Ha (2)
2632.684 20.8: r (3)
2632.721 18.9 Ha (3)
2781.432 [20.5 Ha (4)
3792.677 [20.8 Ha (1)
3792.697 [21.4 R (1)
3793.869 [21.0 Ha (1)
Nova No. 2002-3 = M81N~2002-12c
1912.626 [21.5 Ha (2)
2632.684 [22.3 r (3)
2632.721 21.05 Ha (3)
2781.432 [21.4 Ha (4)
3680.766 [23.8 R (19)
3792.677 [20.8 Ha (1)
3792.697 [21.4 R (1)
3793.869 [21.0 Ha (1)
Nova No. 2002-4 = M81N~2002-12d
1912.626 [21.5 Ha (2)
2632.684 21.10 r (3)
2632.721 19.72 Ha (3)
2781.432 [21.6 Ha (4)
3680.766 [23.8 R (19)
3792.677 [20.8 Ha (1)
3792.697 [21.4 R (1)
3793.869 [21.0 Ha (1)
Nova No. 2002-5 = M81N~2002-12e
1912.626 [21.5 Ha (2)
2617.039 20.52 R (13)
2632.684 21.42 r (3)
2632.721 19.82 Ha (3)
2781.432 [21.6 Ha (4)
3680.766 [23.8 R (19)
3792.677 [20.8 Ha (1)
3792.697 [21.4 R (1)
3793.869 [21.0 Ha (1)
Nova No. 2003-1 = M81N~2003-05c
1912.626 [21.5 Ha (2)
2769.383 21.8 r (7)
2769.388 22.0: Ha (7)
2781.432 19.70 Ha (4)
2781.436 20.61 r (4)
2783.455 19.59 Ha (4)
2783.460 20.39 r (4)
2785.450 19.71 Ha (4)
2794.391 19.10 Ha (5)
2794.397 20.73 r (5)
2795.394 19.03 Ha (5)
2796.395 18.91 Ha (5)
2796.400 20.59 r (5)
2800.384 19.05 Ha (6)
3680.766 [23.8 R (19)
3792.677 [20.8 Ha (1)
3793.869 [21.0 Ha (1)
Nova No. 2003-2 = M81N~2003-09a
1912.626 [21.3 Ha (2)
2800.384 [21.4 Ha (6)
2900.882 22.34 F814W (9)
2900.895 20.24 F658N (9)
3039.528 [22.3 V (7)
3039.540 20.10 Ha (7)
3040.771 [20.0 Ha (7)
3049.631 21.0: Ha (8)
3049.660 [22.0 V (8)
3052.735 [22.3 V (8)
3052.744 20.6: Ha (8)
3263.850 [25.3 F814W (11)
3680.766 [23.8 R (19)
3792.677 [20.8 Ha (1)
3793.869 [21.0 Ha (1)
Nova No. 2003-3 = M81N~2003-09b
1912.626 [21.3 Ha (2)
2422.782 [27.3 F814W (10)
2800.384 [21.4 Ha (6)
2900.882 23.28 F814W (9)
2900.895 20.38 F658N (9)
3039.528 [22.3 V (7)
3039.540 [21.1 Ha (7)
3263.780 [25.4 F814W (11)
3792.677 [20.8 Ha (1)
3793.869 [21.0 Ha (1)
Nova No. 2003-4 = M81N~2003-09c
1912.626 [21.0 Ha (2)
2800.384 [21.1 Ha (6)
2900.882 23.7 F814W (9)
2900.895 19.45 F658N (9)
3039.528 [22.0 V (7)
3039.540 [20.8 Ha (7)
3263.850 [25.4 F814W (11)
3680.766 [23.8 R (19)
3792.677 [20.8 Ha (1)
3793.869 [21.0 Ha (1)
Nova No. 2003-5 = M81N~2003-05a
1912.626 [21.5 Ha (2)
2632.684 [22.7 r (3)
2632.721 [21.2 Ha (3)
2769.383 20.26 r (7)
2769.388 18.72 Ha (7)
2781.432 20.63 Ha (4)
2781.436 [22.4 r (4)
2783.455 20.58 Ha (4)
2783.460 [21.5 r (4)
2785.450 21.0 Ha (4)
2794.391 [20.9 Ha (5)
2794.397 [21.1 r (5)
2795.394 [21.4 Ha (5)
2796.395 22.4: Ha (5)
2800.384 [21.4 Ha (6)
2900.895 [23.0 F658N (9)
3039.540 [21.5 Ha (7)
3680.766 [23.8 R (19)
3792.677 [20.8 Ha (1)
3793.869 [21.0 Ha (1)
Nova No. 2003-6 = M81N~2003-05b
1912.626 [21.5 Ha (2)
2632.684 [22.7 r (3)
2632.721 [21.2 Ha (3)
2769.383 21.4 r (7)
2769.388 19.64 Ha (7)
2781.432 19.85 Ha (4)
2781.436 21.3 r (4)
2783.455 19.84 Ha (4)
2783.460 21.5 r (4)
2785.450 19.83 Ha (4)
2794.391 20.0 Ha (5)
2794.397 [21.1 r (5)
2795.394 20.3 Ha (5)
2796.395 20.6 Ha (5)
2800.384 20.4 Ha (6)
3039.540 [21.5 Ha (7)
3792.677 [20.8 Ha (1)
3793.869 [21.0 Ha (1)
Nova No. 2004-1 = M81N~2004-02c
1912.626 [21.5 Ha (2)
3039.528 [22.3 V (7)
3039.540 [21.1 Ha (7)
3040.765 [21.7 V (7)
3040.771 [20.0 Ha (7)
3040.781 [21.5 r (7)
3049.631 19.41 Ha (8)
3049.660 20.75 V (8)
3052.735 [21.8 V (8)
3052.744 19.20 Ha (8)
3680.766 [23.8 R (19)
3792.677 [20.8 Ha (1)
3793.869 [21.0 Ha (1)
Nova No. 2004-2 = M81N~2004-02a
1912.626 [21.5 Ha (2)
3039.528 22.1 V (7)
3039.540 20.47 Ha (7)
3040.765 [21.7 V (7)
3040.771 [20.0 Ha (7)
3040.781 [21.5 r (7)
3049.631 20.8 Ha (8)
3049.660 [22.0 V (8)
3052.735 [22.2 V (8)
3052.744 20.7: Ha (8)
3680.766 [23.8 R (19)
3792.677 [20.8 Ha (1)
3793.869 [21.0 Ha (1)
Nova No. 2004-3 = M81N~2004-02b
1912.626 [21.5 Ha (2)
3039.528 21.14 V (7)
3039.540 19.92 Ha (7)
3049.631 19.69 Ha (8)
3049.660 21.6 V (8)
3052.735 21.7 V (8)
3052.744 19.58 Ha (8)
3079.781 21.30 R (13)
3080.861 21.40 R (12)
3792.677 [20.8 Ha (1)
3793.869 [21.0 Ha (1)
Nova No. 2004-4 = M81N~2004-09a
1912.626 [21.3 Ha (2)
2632.684 [22.7 r (3)
2632.721 [21.2 Ha (3)
2781.432 [21.6 Ha (4)
2900.882 [25.9 F814W (9)
2900.895 [23.0 F658N (9)
3039.528 [22.3 V (7)
3039.540 [20.8 Ha (7)
3052.744 [21.1 Ha (8)
3263.280 22.62 F814W (11)
3680.766 [23.8 R (19)
3792.677 [20.8 Ha (1)
3793.869 [21.0 Ha (1)
Nova No. 2005-1 = M81N~2005-12a
1912.626 [21.3 Ha (2)
2632.684 [22.7 r (3)
2781.432 [21.6 Ha (4)
3052.744 [21.1 Ha (8)
3712.776 20.2 Ha (14)
3793.865 [22.5 R (1)
3793.869 [21.0 Ha (1)
4081.914 [21.6 R (15)
4081.939 [19.9 R (15)
Nova No. 2005-2 = M81N~2005-12b
1912.626 [21.3 Ha (2)
2632.684 [22.7 r (3)
2781.432 [21.6 Ha (4)
3052.744 [21.1 Ha (8)
3680.766 [23.8 R (19)
3712.776 20.1 Ha (14)
3750.987 [23.1 V (31)
3776.062 [22.5 Ha (31)
3793.865 [22.5 R (1)
3793.869 [21.0 Ha (1)
4081.914 [21.6 R (15)
4081.939 [19.9 Ha (15)
Nova No. 2005-3 = M81N~2005-01a
1903.143 [23.6 V (16)
1912.626 [21.5 Ha (2)
2781.432 [21.6 Ha (4)
3052.744 [21.1 Ha (8)
3377.951 22.5 V (17)
3378.928 22.3 V (17)
3680.766 [23.8 R (19)
3793.865 [22.5 R (1)
3793.869 [21.0 Ha (1)
4081.914 [21.6 R (15)
4081.939 [19.9 Ha (15)
Nova No. 2005-4 = M81N~2005-11a
1912.626 [21.5 Ha (2)
2632.684 [22.7 r (3)
2781.432 [21.6 Ha (4)
3052.744 [21.1 Ha (8)
3680.766 21.1 R (19)
3712.776 [20.9 Ha (14)
3750.987 [23.1 V (31)
3776.062 22.2: Ha (31)
3793.865 [22.5 R (1)
3793.869 [21.0 Ha (1)
4081.914 [21.2 R (15)
4081.939 [20.3 Ha (15)
4124.767 [21.6 Ha (18)
4124.802 [22.0 R (18)
Nova No. 2006-1 = M81N~2006-02a
1912.626 [21.3 Ha (2)
2632.721 [21.2 Ha (3)
2781.432 [21.6 Ha (4)
3680.766 [23.8 R (19)
3750.987 [23.1 V (31)
3776.062 [22.5 Ha (31)
3792.677 19.2 Ha (1)
3792.697 [21.4 R (1)
3809.413 [20.9 r (20)
3809.395 20.6 Ha (20)
3813.457 23.0: B (21)
3814.490 [22.5 B (21)
3815.515 [22.0 B (21)
4124.767 [21.6 Ha (18)
Nova No. 2006-2 = M81N~2006-02b
1912.626 [21.0 Ha (2)
2632.721 [21.0 Ha (3)
2781.432 [21.4 Ha (4)
3680.766 [23.8 R (19)
3750.987 [23.1 V (31)
3776.062 [22.5 Ha (31)
3792.677 19.0 Ha (1)
3792.697 [21.4 R (1)
3793.865 [21.5 R (1)
3793.869 19.4 Ha (1)
3809.413 [20.9 r (20)
3809.395 [21.0 Ha (20)
3813.457 [23.0 B (21)
3814.490 [22.5 B (21)
3815.515 [22.0 B (21)
4124.767 [21.6 Ha (18)
Nova No. 2006-3 = M81N~2006-02c
1912.626 [21.3 Ha (2)
2632.721 [21.1 Ha (3)
2781.432 [21.5 Ha (4)
3680.766 [23.8 R (19)
3750.987 [23.1 V (31)
3776.062 [22.5 Ha (31)
3792.677 18.65 Ha (1)
3809.413 [21.0 r (20)
3809.395 [21.2 Ha (20)
3813.457 [23.5 B (21)
3814.490 [22.8 B (21)
3815.515 [22.2 B (21)
4124.767 [21.6 Ha (18)
Nova No. 2006-4 = M81N~2006-02d
1912.626 [21.3 Ha (2)
2632.721 [21.2 Ha (3)
2781.432 [21.6 Ha (4)
3680.766 [23.8 R (19)
3750.987 [23.1 V (31)
3776.062 [22.5 Ha (31)
3792.677 19.7 Ha (1)
3792.697 21.0: R (1)
3793.865 [21.3 R (1)
3793.869 19.9 Ha (1)
3809.413 [20.8 r (20)
3809.395 19.55 Ha (20)
3813.457 22.0 B (21)
3814.490 22.0 B (21)
3815.515 21.9 B (21)
4124.767 [21.6 Ha (18)
Nova No. 2006-5 = M81N~2006-02f
1912.626 [21.0 Ha (2)
2632.721 [21.2 Ha (3)
2781.432 [21.6 Ha (4)
3750.987 [23.1 V (31)
3776.062 [22.5 Ha (31)
3792.677 20.5: Ha (1)
3792.697 20.2 R (1)
3793.865 20.0 R (1)
3793.869 20.0 Ha (1)
3809.413 [20.9 r (20)
3809.395 19.7 Ha (20)
3813.457 [22.8 B (21)
3814.490 [22.5 B (21)
3815.515 [22.0 B (21)
4124.767 [21.6 Ha (18)
Nova No. 2006-6 = M81N~2006-02e
1912.626 [21.5 Ha (2)
2632.721 [21.2 Ha (3)
2781.432 [21.6 Ha (4)
3703.719 20.47 R (13)
3709.954 20.68 R (13)
3712.776 18.56 Ha (14)
3792.677 20.60 Ha (1)
3792.697 22.8: R (1)
3793.865 22.7 R (1)
3793.869 20.62 Ha (1)
3809.413 [21.0 r (20)
3809.395 21.0 Ha (20)
3813.457 23.5 B (21)
3814.490 [22.8 B (21)
3815.515 [22.4 B (21)
4124.767 [21.6 Ha (18)
Nova No. 2006-7 = M81N~2006-12a
1912.626 [21.3 Ha (2)
2632.684 [22.7 r (3)
2781.432 [21.6 Ha (4)
3052.744 [21.1 Ha (8)
3680.766 [23.8 R (19)
3712.776 [20.9 Ha (14)
3793.865 [22.5 R (1)
3793.869 [21.0 Ha (1)
4081.914 20.7 R (15)
4081.939 19.0 Ha (15)
4124.767 [21.6 Ha (18)
4124.802 [22.0 R (18)
Nova No. 2006-8 = M81N~2006-12b
1912.626 [21.5 Ha (2)
2632.684 [22.7 r (3)
2781.432 [21.6 Ha (4)
3052.744 [21.1 Ha (8)
3680.766 [23.8 R (19)
3712.776 [20.9 Ha (14)
3793.865 [22.5 R (1)
3793.869 [21.0 Ha (1)
4081.914 21.5: R (15)
4081.939 19.7 Ha (15)
4124.767 21.6: Ha (18)
4124.802 [22.0 R (18)
Nova No. 2006-9 = M81N~2006-03a
1903.158 [24.1 B (16)
1912.626 [21.5 Ha (2)
2632.684 [22.7 r (3)
2781.432 [21.6 Ha (4)
3052.744 [21.1 Ha (8)
3680.766 [23.8 R (19)
3712.776 [20.9 Ha (14)
3750.987 [23.1 V (31)
3776.062 [22.5 Ha (31)
3793.865 [22.8 R (1)
3793.869 [21.6 Ha (1)
3809.413 19.8 r (20)
3809.395 19.99 Ha (20)
3813.457 21.3 B (21)
3814.490 21.5 B (21)
3815.515 22.0 B (21)
4081.914 [21.2 R (15)
4081.939 [20.5 Ha (15)
4124.767 [21.6 Ha (18)
4124.802 [22.2 R (18)
Nova No. 2006-10 = M81N~2006-03b
1903.158 [24.1 B (16)
1912.626 [21.5 Ha (2)
2632.684 [22.7 r (3)
2781.432 [21.6 Ha (4)
3052.744 [21.1 Ha (8)
3680.766 [23.8 R (19)
3712.776 [20.9 Ha (14)
3750.987 [23.1 V (31)
3776.062 [22.5 Ha (31)
3793.865 [22.8 R (1)
3793.869 [21.6 Ha (1)
3809.413 20.4 r (20)
3809.395 20.66 Ha (20)
3813.457 20.79 B (21)
3814.490 21.06 B (21)
3815.515 21.3 B (21)
4081.914 [21.2 R (15)
4081.939 [20.5 Ha (15)
4124.767 [21.6 Ha (18)
4124.802 [22.2 R (18)
Nova No. 2006-11 = M81N~2006-02g
1903.158 [24.1 B (16)
1912.626 [21.5 Ha (2)
2632.684 [22.7 r (3)
2781.432 [21.6 Ha (4)
3052.744 [21.1 Ha (8)
3680.766 [23.8 R (19)
3712.776 [20.9 Ha (14)
3750.987 22.9: V (31)
3776.062 20.1 Ha (31)
3792.677 20.9 Ha (1)
3792.697 [22.8 R (1)
3793.865 [22.8 R (1)
3793.869 20.8 Ha (1)
3809.413 [21.0 r (20)
3809.395 20.9 Ha (20)
3813.457 [23.5 B (21)
3814.490 [22.8 B (21)
3815.515 [22.4 B (21)
4081.914 [21.2 R (15)
4081.939 [20.5 Ha (15)
4124.767 [21.6 Ha (18)
4124.802 [22.2 R (18)
Nova No. 2006-12 = M81N~2006-01a
1501.982 [22.6 R (13)
1903.143 [23.6 V (16)
1912.626 [21.5 Ha (2)
2632.684 [22.7 r (3)
2781.432 [21.6 Ha (4)
2900.895 [23.0 F658N (9)
3379.017 [24.0 V (17)
3703.719 [22.3 R (13)
3709.954 21.8 R (13)
3750.987 20.9 V (31)
3776.062 [22.5 Ha (31)
3792.677 [20.8 Ha (1)
3792.697 [21.4 R (1)
3793.869 [21.0 Ha (1)
3813.457 [23.5 B (21)
Nova No. 2006-13 = M81N~2006-02h
1501.982 [22.6 R (13)
1912.626 [21.5 Ha (2)
2632.684 [22.7 r (3)
2781.432 [21.6 Ha (4)
2900.895 [23.0 F658N (9)
3703.719 [22.1 R (13)
3709.954 [22.1 R (13)
3750.987 [22.8 V (31)
3776.062 19.9 Ha (31)
3792.677 [20.8 Ha (1)
3792.697 [21.4 R (1)
3809.395 [20.8 Ha (20)
3813.457 [23.3 B (21)
4124.767 [21.6 Ha (18)
Nova No. 2006-14 = M81N~2006-02i
1501.982 [22.6 R (13)
1912.626 [21.5 Ha (2)
2632.684 [22.7 r (3)
2781.432 [21.6 Ha (4)
2900.895 [23.0 F658N (9)
3703.719 [22.3 R (13)
3709.954 [22.3 R (13)
3712.776 [20.9 Ha (14)
3750.987 [23.1 V (31)
3776.062 20.2 Ha (31)
3792.677 20.1 Ha (1)
3792.697 [21.4 R (1)
3809.395 21.1 Ha (20)
3813.457 [23.5 B (21)
4124.767 [21.6 Ha (18)
Nova No. 2006-15 = M81N~2006-02j
1501.982 [22.6 R (13)
1903.143 [23.6 V (16)
1912.626 [21.5 Ha (2)
2632.684 [22.7 r (3)
2781.432 [21.6 Ha (4)
2900.895 [23.0 F658N (9)
3703.719 [22.3 R (13)
3709.954 [22.3 R (13)
3712.776 [20.8 Ha (14)
3750.987 22.5: V (31)
3776.062 20.6 Ha (31)
3792.677 20.5 Ha (1)
3792.697 [21.4 R (1)
3793.865 [22.8 R (1)
3793.869 20.6 Ha (1)
3809.395 21.0 Ha (20)
3813.457 [23.5 B (21)
4124.767 [21.6 Ha (18)
Nova No. 2007-1 = M81N~2007-01a
1912.626 [21.5 Ha (2)
2632.684 [22.7 r (3)
2781.432 [21.6 Ha (4)
3052.744 [21.1 Ha (8)
3680.766 [23.8 R (19)
3712.776 [20.9 Ha (14)
3793.865 [22.5 R (1)
3793.869 [21.0 Ha (1)
4081.914 [21.2 R (15)
4081.939 19.6 Ha (15)
4124.767 20.9 Ha (18)
4124.802 [21.9 R (18)
Nova No. 2007-2 = M81N~2007-04a
1912.626 [21.0 Ha (2)
2632.684 [22.7 r (3)
2632.721 [21.0 Ha (3)
2781.432 [21.4 Ha (4)
3680.766 [22.9 R (19)
3792.677 [20.8 Ha (1)
3792.697 [21.4 R (1)
3793.865 [21.5 R (1)
3793.869 [21.0 Ha (1)
3809.413 [20.9 r (20)
3809.395 [21.0 Ha (20)
3813.457 [23.0 B (21)
3814.490 [22.5 B (21)
3815.515 [22.0 B (21)
4124.767 [21.6 Ha (18)
4124.802 [21.9 R (18)
4164.468 [20.5 clear (22)
4196.312 19.0: clear (22)
4199.374 19.2 clear (25)
4202.365 19.5 clear (24)
4203.409 19.4 clear (27)
4204.432 20.0: clear (25)
4205.358 20.2: clear (24)
Nova No. 2007-3 = M81N~2007-04b
1912.626 [21.4 Ha (2)
2632.684 [22.7 r (3)
2632.721 [21.0 Ha (3)
2781.432 [21.6 Ha (4)
3378.917 [24.0 V (17)
3680.766 [23.0 R (19)
3792.677 [20.8 Ha (1)
3792.697 [21.4 R (1)
3793.865 [22.5 R (1)
3793.869 [21.0 Ha (1)
3809.413 [20.9 r (20)
3809.395 [21.0 Ha (20)
3813.457 [23.0 B (21)
3814.490 [22.5 B (21)
3815.515 [22.0 B (21)
4124.767 [21.6 Ha (18)
4124.802 [22.0 R (18)
4164.468 [21.5 clear (22)
4196.312 [21.3 clear (22)
4199.374 [21.0 clear (25)
4202.365 19.9 clear (24)
4203.409 19.2 clear (27)
4204.432 18.7 clear (25)
4205.358 17.6 clear (24)
4205.417 17.7 clear (23)
4205.489 17.7 clear (23)
4206.361 18.1 clear (27)
4206.402 18.1 clear (23)
4206.410 18.4 clear (28)
4207.375 18.3 clear (24)
4207.417 18.4 clear (23)
4208.330 18.5 clear (28)
4208.353 18.5 clear (26)
4208.409 18.3 clear (30)
4209.394 18.6 clear (23)
4210.339 18.9 clear (26)
4211.409 18.9 clear (23)
4212.391 19.0 clear (29)
4213.389 19.0 clear (23)
4216.391 19.6 clear (27)
4218.377 20.1 clear (23)
[!hb]llrrrr
Photometry of nova candidates discovered by Neill&Shara (2004).
Observers, observatories, telescopes and CCDs for measurements are coded in column comment according to Table 1.
See caption of Table 1 for explanation of magnitude format.
Designation of nova candidates used here is the same as in Neill&Shara (2004).
JD Mag Band Comment
(2 450 000+)
\endfirstheadcontinued.
JD Mag Band Comment
(2 450 000+)
\endhead\endfoot
Nova 1
1912.626 [21.5 Ha (2)
2632.684 21.24 r (3)
2632.721 19.23 Ha (3)
2769.383 [21.5 r (7)
2769.388 20.77 Ha (7)
2781.432 20.8 Ha (4)
2781.436 [21.7 r (4)
2783.455 21.1 Ha (4)
2783.460 [21.5 r (4)
2785.450 [21.0 Ha (4)
2794.391 20.9 Ha (5)
2794.397 [21.3 r (5)
2795.394 20.9: Ha (5)
2796.395 21.1 Ha (5)
2796.400 [22.2 r (5)
2800.384 21.2 Ha (6)
Nova 2
1912.626 [21.5 Ha (2)
2632.684 20.85 r (3)
2632.721 19.80 Ha (3)
2769.383 [21.9 r (7)
2769.388 21.4 Ha (7)
2781.432 [21.6 Ha (4)
2781.436 [22.4 r (4)
2783.455 21.6 Ha (4)
2783.460 [21.5 r (4)
2796.395 21.8 Ha (5)
2800.384 21.4 Ha (6)
3039.528 [22.3 V (7)
3039.540 [21.1 Ha (7)
3792.677 [20.8 Ha (1)
3793.869 [21.0 Ha (1)
Nova 4
1912.626 [21.5 Ha (2)
2632.684 [21.9 r (3)
2632.721 19.09 Ha (3)
2781.432 [21.6 Ha (4)
3039.528 [22.3 V (7)
3039.540 [21.1 Ha (7)
3792.677 [20.8 Ha (1)
3793.869 [21.0 Ha (1)
Nova 5
1912.626 [21.5 Ha (2)
2632.684 [22.7 r (3)
2632.721 [21.2 Ha (3)
2769.383 [21.7 r (7)
2769.388 20.9 Ha (7)
2781.432 21.5 Ha (4)
2781.436 [22.4 r (4)
2783.455 21.4 Ha (4)
2783.460 [21.5 r (4)
2796.395 21.4 Ha (5)
2800.384 21.1 Ha (6)
3039.528 [22.3 V (7)
3039.540 [21.1 Ha (7)
3792.677 [20.8 Ha (1)
3793.869 [21.0 Ha (1)
Nova 7
1912.626 [21.5 Ha (2)
2632.684 [22.7 r (3)
2632.721 [21.2 Ha (3)
2769.383 [21.8 r (7)
2769.388 21.0 Ha (7)
2781.432 [21.6 Ha (4)
2781.436 [22.4 r (4)
2783.455 21.4 Ha (4)
2783.460 [21.5 r (4)
2796.395 21.5 Ha (5)
2800.384 21.5: Ha (6)
3039.528 [22.3 V (7)
3039.540 [21.1 Ha (7)
3792.677 [20.8 Ha (1)
3793.869 [21.0 Ha (1)
Nova 9
1912.626 [21.5 Ha (2)
2632.684 [22.7 r (3)
2632.721 [21.2 Ha (3)
2769.383 [21.8 r (7)
2769.388 21.2 Ha (7)
2781.432 [21.6 Ha (4)
2781.436 [22.4 r (4)
2783.455 21.6 Ha (4)
2783.460 [21.5 r (4)
2796.395 [22.0 Ha (5)
2800.384 [21.5 Ha (6)
3039.528 [22.3 V (7)
3039.540 [21.1 Ha (7)
3792.677 [20.8 Ha (1)
3793.869 [21.0 Ha (1)
Nova 10
1912.626 [21.5 Ha (2)
2632.684 [22.7 r (3)
2632.721 [21.2 Ha (3)
2769.383 [21.7 r (7)
2769.388 20.24 Ha (7)
2781.432 20.6 Ha (4)
2781.436 [22.4 r (4)
2783.455 20.76 Ha (4)
2783.460 [21.5 r (4)
2785.450 20.6 Ha (4)
2794.391 21.0 Ha (5)
2794.397 [21.3 r (5)
2795.394 21.1 Ha (5)
2796.395 21.07 Ha (5)
2796.400 [22.2 r (5)
2800.384 20.9 Ha (6)
3039.528 [22.3 V (7)
3039.540 [21.1 Ha (7)
3792.677 [20.8 Ha (1)
3793.869 [21.0 Ha (1)
Nova 11
1912.626 [21.5 Ha (2)
2632.684 [22.7 r (3)
2632.721 [21.2 Ha (3)
2769.383 20.60 r (7)
2769.388 19.02 Ha (7)
2781.432 19.33 Ha (4)
2781.436 21.2 r (4)
2783.455 19.32 Ha (4)
2783.460 20.95 r (4)
2785.450 19.60 Ha (4)
2794.391 19.89 Ha (5)
2794.397 [21.3 r (5)
2795.394 20.12 Ha (5)
2796.395 19.97 Ha (5)
2796.400 21.6 r (5)
2800.384 20.17 Ha (6)
3039.528 [22.3 V (7)
3039.540 [21.1 Ha (7)
3792.677 [20.8 Ha (1)
3793.869 [21.0 Ha (1)
Nova 12
1912.626 [21.5 Ha (2)
2632.684 [22.7 r (3)
2632.721 [21.2 Ha (3)
2769.388 [21.7 Ha (7)
2781.432 21.4 Ha (4)
2781.436 21.3 r (4)
2783.455 21.0 Ha (4)
2783.460 20.46 r (4)
2785.450 20.7 Ha (4)
2794.391 20.37 Ha (5)
2794.397 21.3: r (5)
2795.394 20.32 Ha (5)
2796.395 20.16 Ha (5)
2796.400 21.9 r (5)
2800.384 20.13 Ha (6)
3039.528 [22.3 V (7)
3039.540 [21.1 Ha (7)
3792.677 [20.8 Ha (1)
3793.869 [21.0 Ha (1)