The Gas Temperature of Starless Cores in Perseus
Abstract
In this paper we study the determinants of starless core temperatures in the Perseus molecular cloud. We use NH3 (1,1) and (2,2) observations to derive core temperatures (Tkin) and data from the COMPLETE Survey of Star Forming Regions and the c2d Spitzer Legacy Survey for observations of the other core and molecular cloud properties. The kinetic temperature distribution probed by NH3 is in the fairly narrow range of 9 - 15 K. We find that cores within the clusters IC348 and NGC1333 are significantly warmer than “field” starless cores, and Tkin is higher within regions of larger extinction-derived column density. Starless cores in the field are warmer when they are closer to class O/I protostars, but this effect is not seen for those cores in clusters. For field starless cores, Tkin is higher in regions in which the 13CO linewidth and the 1.1mm flux from the core are larger, and Tkin is lower when the the peak column density within the core and average volume density of the core are larger. There is no correlation between Tkin and 13CO linewidth, 1.1mm flux, density or peak column density for those cores in clusters. The temperature of the cloud material along the line of sight to the core, as measured by CO or far-infrared emission from dust, is positively correlated with core temperature when considering the collection of cores in the field and in clusters, but this effect is not apparent when the two subsamples of cores are considered separately.
Subject headings:
stars: formation — ISM: molecules1. Introduction
Starless cores are the link between molecular clouds and Class 0 protostars. They are smaller and denser (r 0.1 pc, n cm-3) than, and kinematically distinct from, the molecular clouds in which they are found (Goodman et al., 1998). Because starless cores have no source of internal heating, the temperature of a starless core is determined by external illumination and self-shielding. The temperatures of starless cores are set by the interstellar radiation field, and in some cases luminous nearby stars, attenuated by the molecular cloud. The temperature profile within a starless core is determined by the heating of its outer layers and the internal extinction, making the centers of starless cores colder than their outer layers (Evans et al., 2001; Stamatellos et al., 2007; Zucconi et al., 2001).
The temperatures of starless cores can be inferred from thermal emission from dust or from molecular lines. Deriving core temperatures from continuum emission is complicated by uncertainties in the dust emission spectrum. For instance, in cold and dense regions dust grains are expected to coagulate and become covered in icy mantles, creating variation in the emissivity spectral index (Ossenkopf & Henning, 1994). In addition, below a density of the dust temperature is not coupled to the gas temperature (Goldsmith, 2001; Galli et al., 2002), which is the more important quantity because the gas makes up 99% of the mass. One of the best tracers of gas temperature is the rotation-inversion lines of NH3. Ammonia is particularly well suited for this type of study because 1) NH3 does not seem to deplete onto dust grains in starless cores, and in fact may have an enhanced abundance where CO is depleted (Tafalla et al., 2002) 2) NH3 has hyperfine splitting of its inversion lines, making fits to the temperature, velocity and optical depth more certain 3) the NH3 (1,1) and (2,2) transitions are separated by a small difference in frequency, so it is possible to simultaneously observe both sets of lines. In this paper we use ammonia (1,1) and (2,2) observations (Rosolowsky et al., 2008) to derive the temperature of starless cores. We examine whether these data support the several models of the relationship between core properties and the molecular cloud where they are found (e.g., Evans et al., 2001; Bethell et al., 2004; Stamatellos et al., 2004)
Perseus is one of the Gould’s belt molecular clouds included in the Spitzer legacy project “From Molecular Cores to Planet-Forming Disks” (c2d) (Evans et al., 2003) and the COMPLETE survey of star-forming regions (Ridge et al., 2006), at a distance of 250 pc (Černis & Straižys, 2003; Belikov et al., 2002). Because it is so well observed, there is a wealth of data on the cores and the cloud that enables us to study the influences of various internal and environmental factors on the temperature of 50 starless cores in Perseus.
2. Data
2.1. Far-Infrared
As described in Schnee et al. (2008), we used far-infrared emission maps at 70, 100 and 160 µm to derive the dust temperature and column density of the Perseus molecular cloud. The 70 and 160 µm maps were obtained as part of the c2d survey (Rebull et al., 2007), and the 100 µm map was taken from the IRIS reprocessing of the IRAS all-sky maps (Miville-Deschênes & Lagache, 2005). The resolution of the emission-derived column density (NH) and dust temperature (Td) maps with which we will compare the NH3 temperature (Tkin) is 40″, as set by the 160 µm data.
The dust temperature is calculated from the ratio of the observed flux at 70 and 160 µm, taking into account the color correction at both wavelengths and the emission from transiently heated very small dust grains at 70 µm. The column density is derived from the flux at 160 µm and the dust temperature, allowing for a variable dust emissivity and normalized to the extinction measured from NIR reddening. Maps of the emission-derived dust temperature and column density, and the procedure used to make the maps, are presented in detail in Schnee et al. (2008).
2.2. Near-Infrared
Data from the final release of the Two Micron All Sky Survey (2MASS) point source catalog was used to create a large-scale extinction map of Perseus as part of the COMPLETE survey (Ridge et al., 2006). The NICER algorithm estimates the column density towards background stars by comparing their observed colors with the (assumed) instrinsic colors (Lombardi & Alves, 2001). Although we expect the extinction map to be our least-biased estimate of the cloud column density (Schnee et al., 2006; Goodman et al., 2008), its 5′ resolution is roughly ten times coarser than our other maps, which smooths out density gradients and makes it somewhat harder to compare the cloud and core properties.
2.3. NH3 (1,1) and (2,2)
We used observations of 193 dense cores and core candidates in the Perseus Molecular Cloud using the 100-m Robert F. Byrd Green Bank Telescope (GBT) as described in Rosolowsky et al. (2008). For each target, single-pointing (31″ FWHM) observations were made of the NH3 (1,1) and (2,2) lines with 0.024 km s-1 spectral resolution. The targets for the ammonia survey were drawn, in order of precedence, from 1) the locations of millimeter cores in the Bolocam survey of the region (Enoch et al., 2006) 2) the locations of submillimeter cores in the SCUBA survey of the region (Kirk et al., 2006), 3) sources in the literature survey of Jijina et al. (1999), and 4) cold, high-column-density objects in the dust map produced by Schnee et al. (2008), and 5) sources identified by eye that appear in both the Bolocam and SCUBA maps but were not included in the published catalogs. The starless cores discussed in this paper were drawn from from only the first two categories.
The kinetic temperatures of the starless cores (Section 3 describes how we identify which cores are starless) are determined by a simultaneous fit to the (1,1) and (2,2) emission profiles, accounting for collisional deexcitation of the two states. The same fit also yields the width of the NH3 line, which is decomposed into its thermal and non-thermal components based on the temperature determination. Although there are likely gas temperature and density gradients within each starless core on both theoretical and observational grouds (Crapsi et al., 2007), the fitting of the ammonia-derived temperature is essentially an average over the core properties. However, a single-temperature model with uniform excitation conditions is a reasonably good fit to nearly all of the starless core in this sample. The NH3 observations can be used to accurately derive the kinetic temperatures of starless cores with where the lower and upper limits are set by sensitivity and transition thermalization respectively (Walmsley & Ungerechts, 1983). Further details about the observations and data reduction are described in Rosolowsky et al. (2008).
2.4. 12,13CO (1–0)
Observations of the 12CO (1–0) and 13CO (1–0) transitions at 115 and 110 GHz were carried at the 14-m Five College Radio Astronomy Observatory (FCRAO) telescope as part of the COMPLETE survey. The data have 0.07 km s-1 spectral resolution and 40″ spatial resolution. The data reduction and mapping techniques are described in Ridge et al. (2006). The CO maps cover approximately the same area in Perseus as the c2d survey, giving us a good estimate of the kinematics of the ambient, less dense, material in the molecular cloud. Pineda et al. (2008) use this data set to determine the gas temperature and column density in regions in which the 13CO (1–0) transition is optically thin (the 12CO line is assumed to be optically thick everywhere) and the gas is not subthermally excited.
2.5. 1.1mm Continuum Maps
As part of a survey that is complemetary to c2d, Enoch et al. (2006) mapped 7.5 deg2 of the Perseus molecular cloud at 1.1mm with Bolocam at the Caltech Submillimeter Observatory. The resolution is 31″, which matches very well with our NH3 observations, and all 122 1.1mm-detected cores were observed with the GBT. The Bolocam observations are most sensitive to dense cores ( cm-3) with density contrasts at least 30 times greater than the background cloud, which matches the description of a starless core embedded in a molecular cloud quite well (Bergin & Tafalla, 2007). In addition to using the 1.1mm data for target selection, we use the 1.1mm derived fluxes and sizes to compare the Tkin with core properties such as mass, column density and volume density.
3. Identification of Starless Cores
To ensure that we only study the starless core population in Perseus, we compare the positions of our NH3 observations with the coordinates of known protostars, as found through the analysis of Enoch et al. (2008), Jørgensen et al. (2007) and Hatchell et al. (2007). Jørgensen et al. (2007) identify 49 deeply embedded Young Stellar Objects (YSOs) in Perseus using Spitzer/IRAC color cuts, Spitzer/MIPS and 850 µm SCUBA correlations, and SCUBA morphologies. Hatchell et al. (2007) uses NIR/MIR (2MASS/IRAC) detections and/or detections of protostellar outflows to separate starless cores from protostars, and find 56 protostars. Enoch et al. (2008) identifies 55 protostellar cores out of the total 122 millimeter cores in Perseus using the spatial coincidence between 1.1mm continuum cores and sources identified in the c2d Delivery Document (Evans et al., 2007; Harvey et al., 2007) as “YSOc” (YSO candidate), “red” or that are 70 µm point sources and are not classified as “Galc” (Galaxy candidate). In this paper we only consider those 50 ammonia pointings that are called “starless” by the various definitions of all three papers, or that are more than 30″ from any identified protostar in any of the three papers. None of the cores we classify as “starless” are identified as a low-luminosity embedded protostar by Dunham et al. (2008). We also require that the starless cores have solid NH3-derived temperatures and linewidths, meaning that Tkin is greater than 2.73 K, the NH3 (2,2) detection is and the model and observed spectra fit well by eye. Of the 193 observations in the NH3 survey, 137 of the pointings are not coincident with an identified protostar, and 50 of these satisfy the signal to noise and goodness of fit requirements.
4. Analysis
Here we compare the ammonia-derived temperature with several properties of the starless cores and their environment. We considered only those 50 starless cores with well-defined Tkin and linewidth, so we are able to derive their non-thermal linewidths. All were detected in the 1.1mm survey of Enoch et al. (2006), so for each we have the total flux, peak flux (from which we derive the peak column density), mass (from the total flux and the NH3 temperature) and mean particle density. The FIR-derived dust temperature and column density are considered to be believable as long as they fall within the range and , which is true except in those regions where the 160 µm map is saturated or corrupted by a nearby bright source. There are 46 starless cores with believable FIR-derived Td and , and all 50 starless cores fall within the area of our NIR-derived extinction map. The gaussian fitting algorithm failed to converge when calculating the 13CO linewidth of TCO for 6 cores. The internal properties of our sample of starless cores are listed in Table 1, and the properties of Perseus cloud along the line of sight to the cores are given in Table 2. Although the distance from each starless core to the nearest protostar found in the surveys of Enoch et al. (2008); Jørgensen et al. (2007) and Hatchell et al. (2007) is known, in our discussion of possible correlations we consider only those with separations of 0.25 pc or smaller.
4.1. Tkin
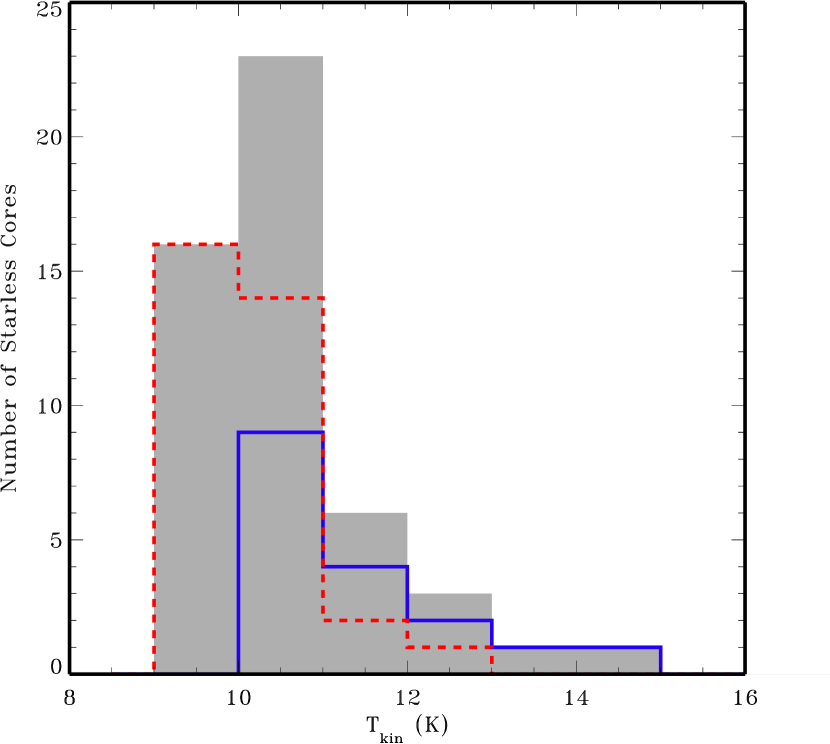
The kinetic temperature distribution probed by NH3 is quite narrow, from 9 - 15 K, as seen in Fig. 1. This may be due to the relatively low angular resolution of the GBT pointings, whose 31″ beam corresponds to probing the inner 0.019 pc (3.9 AU) of each core. Models of externally heated prestellar cores show that they are only significantly colder than 9 K within the inner AU or warmer than 14 K outside a radius of AU, with variation depending on the strength of the ISRF incident upon the core (Evans et al., 2001; Stamatellos et al., 2004). We are unlikely to be biased by chemical effects, given that NH3 is not seen to deplete in starless cores (e.g., Tafalla et al., 2002). The critical density of NH3, cm-3 (Swade, 1989), is low compared the typical gas densities observed in the cores in our sample ( cm-3 cm-3), so we expect the NH3 observations to sample the full volume of our cores.
The range of temperatures seen in the Perseus starless cores is typical of those seen in other molecular clouds. For instance, Kirk et al. (2007) derived dust temperatures of pre-stellar cores in Taurus and Ophiuchus and found that most cores fall within the 9-13K range. The peak of the Tkin distribution shown in Figure 1 is between 10-11K, which agrees well with the median temperature (11 K) derived from NH3 observations of the 36 starless as observed and identified by Jijina et al. (1999) across many nearby star forming regions. The lower and upper quartiles of the temperatures of the Jijina et al. (1999) starless core sample (9.7 K and 14.0 K) are also a close match to that shown in Figure 1.
Numerical simulations of starless cores have been used to quantify how their temperature profile is affected by variations in many parameters, such as the strength of the ISRF, the density profile, and the amount of extinction provided by the molecular cloud in which the cores are embedded (e.g. Evans et al., 2001; Galli et al., 2002; Stamatellos & Whitworth, 2003; Stamatellos et al., 2004). Evans et al. (2001) calculate that for Bonnor-Ebert spheres with central densities varying by about a factor of 100 (from 105 to 107 cm-3), the central temperature varies by a factor of 2 (6.5 - 10 K), but the temperature at a radius of 103.5 AU (the radius of the GBT beam at the distance of Perseus) only varies by 1 K (9 - 10 K). A doubling of the strength of the ISRF results in a 1 K increase of the core temperature file over the range of radii probed by the NH3 observations in this study (Evans et al., 2001), while a factor of 100 increase in the ISRF would result in an increase in the core temperature by a factor of 2 (Galli et al., 2002). Variations in the dust opacity also affect the temperature of starless core, but Gonçalves et al. (2004) show that this effect is quite small ( K) for the range of dust properties that one expects in these cores. Given that the temperature of a prestellar core (at a radius of 103.5 AU) is not especially sensitive to its central density, the dust opacity, the strength of the ISRF or the degree of extinction for the range of values that we expect in Perseus, the narrow width of the temperature distribution shown in Figure 1 and its peak at 10 K are roughly what one would expect.
4.2. Tkin vs. Location
The presence of local star formation appears to affect Tkin. Fig. 1 shows the temperature distribution of all the starless cores in Perseus (filled grey histogram), as well as that for starless cores in the clusters NGC1333 and IC348 (open solid histogram) and field starless cores (open dashed histogram). The boundaries for NGC1333 and IC348 are taken from Jørgensen et al. (2007). It is clear that those cores in clusters are warmer than those outside clusters. The probability that the temperature distributions of starless cores inside and outside clusters have the same mean is , as calculated by a Wilcoxon Rank-Sum Test, Student’s T-statistic or two-sided Kolmogorov-Smirnov test.
There are reasons to expect that starless cores in clusters would be warmer than those outside clusters. For instance, a cluster of protostars may directly heat their environment. In addition, protostars inject turbulence into the surrounding medium, making it more porous and less effective as a shield from the ISRF. In addition, Jijina et al. (1999) find that dense cores that are not associated with IRAS sources are warmer when found inside clusters than outside.
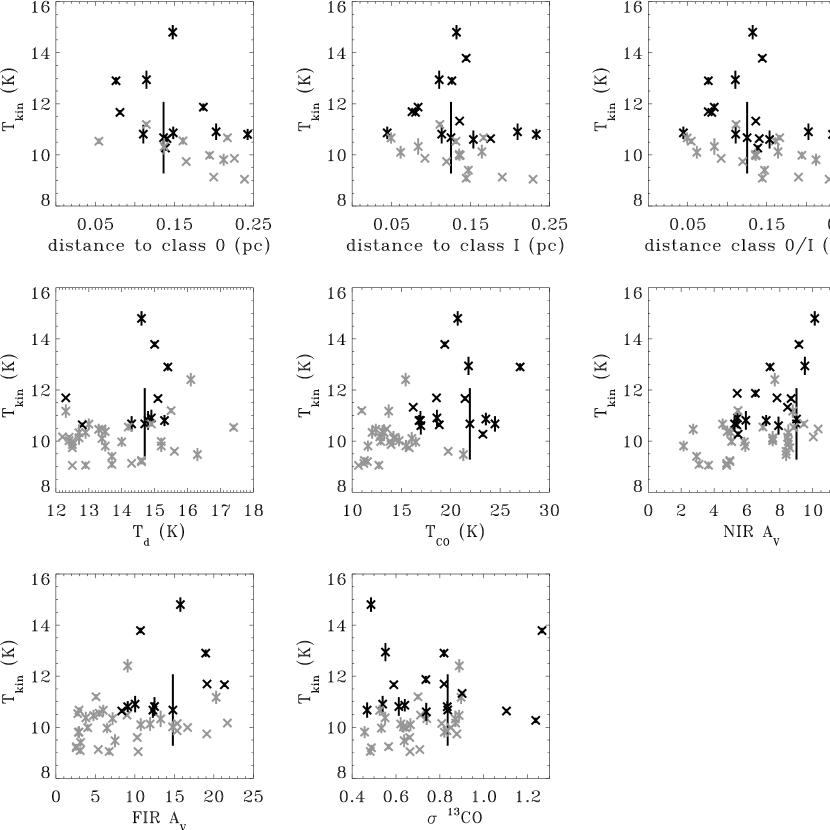
Stamatellos et al. (2007) predict that the presence of a nearby Class 0 protostar should not affect the temperature of a nearby starless core at all, and that a nearby Class I protostar will only heat the outer layers of a core, and only by K. We test this by comparing the NH3-derived temperatures of starless cores in Perseus to the distance to the nearest Class 0 and I protostars (as determined by Enoch et al. (2008)). As shown in Fig. 2 and Table 3, we confirm that there is no significant correlation between Tkin and the distance to the nearest protostar for those starless cores in the clusters NGC1333 and IC348. However, there is a significant negative correlation between Tkin and the distance to the nearest class 0 and/or I protostar for those starless cores in the field (i.e. starless cores further from protostars are colder). It is not at all certain that this result contradicts the prediction of Stamatellos et al. (2007), because we cannot say that nearby protostars heat starless cores, just that warmer cores are found near protostars.
4.3. Tkin vs. Cloud Temperature
Here we compare the temperatures of starless cores with the temperature of the material in which it is embedded. We estimate the line-of-sight averaged temperature of the dust (Td) (Schnee et al., 2008) and the gas (TCO) (Pineda et al., 2008) in the Perseus molecular cloud and compare it with the temperature derived from the NH3 pointings. The resolution of the Td and TCO maps are both 40″, which is roughly comparable to the 31″ resolution of the ammonia data. However, both Td and TCO are imperfect measures of cloud temperature. Because 12CO is optically thick (and perhaps depleted) it is not sensitive to the colder and denser cloud material in which the starless cores are embedded. The dust temperature determination is emission-weighted, and at the FIR wavelengths (70 and 160 µm) of the Spitzer maps the emission is dominated by warm dust along the line of sight, and therefore is less sensitive to the colder and denser clumps in which cores form.
Nevertheless, one might expect that the temperature of a starless core could be affected, or predicted, by the temperature of the medium in which is it embedded. Starless cores are, by definition, externally heated, so whatever is heating the cloud should also be heating the embedded cores. This analysis can be biased because the gas and dust derived temperatures are warmer within the clusters than outside, which is also true for Tkin, so any derived correlations must take this into account. Figure 2 and Tab. 3 show that although both TCO and Td are significantly and positively correlated with Tkin when considering the entire population of starless cores, this effect is entirely explained by the cluster/field bias, and within each sub-population there is no significant correlation.
4.4. Tkin vs. Column Density
The heating of starless cores is governed by the strength of the local interstellar radiation field (ISRF). Given that there are no O or B stars within the Perseus molecular cloud, the ISRF seen by the cores should depend largely on dust shielding but not on the distance to any special source of external radiation. Because we are unable to measure the volume-averaged shielding around each starless core, we use as a proxy the column density along the line of sight. Based on this simple analysis, one would predict that Tkin would be anti-correlated with column density.
On the other hand, for starless cores that are in pressure equilibrium, the inward pressures due to the weight of the Perseus molecular cloud and the self-gravity of the cores will be counter balanced by the internal gas pressure from thermal and non-thermal motion. The external pressure on the starless cores from the molecular cloud is proportional to the square of the column density () (Bertoldi & McKee, 1992; Lada et al., 2008) and the internal gas pressure from thermal motions is proportial to Tkin ( Tkin). From a balance of pressure analysis, one would expect a positive correlation between Tkin and column density, though this would not necessarily be a strong effect because outward pressure is also supplied by non-thermal motions and magnetic fields. We calculate that for the starless cores in our sample the inward pressure of the weight of the molecular cloud is roughly a factor of 2 weaker than their self-gravity.
Here we compare the temperatures of starless cores with the column density of molecular cloud material along the line of sight to each core. We estimate the cloud column density using far-infrared dust emission (Schnee et al., 2008) and near-infrared extinction (Ridge et al., 2006). Although extinction may be the most secure estimator of column density in a molecular cloud (Goodman et al., 2008), the 40″ resolution of the emission-derived column density map compares favorably with the 5′ resolution of the near-infrared extinction map. As with the cloud temperature, there is an inherent bias in that the column density in the clusters is higher and the core temperatures are higher, so we consider the field and cluster starless cores separately. Figure 2 and Table 3 show that there is a significant positive correlation between extinction-derived column density and Tkin when considering just the starless cores in the field and just the starless cores in the clusters, as well as for the field+cluster ensemble. There is no significant trend between Tkin and the dust emission-derived column density for field or cluster cores.
One should keep in mind that the emission-derived column density derived from dust emission loses accuracy at values of a few, so it is not so surprising to get different results depending on how the column density is estimated (Schnee et al., 2006). The dust temperature derived from FIR maps is emission-weighted, and the column density derivation depends on the dust temperature, so the column density along lines of sight with significant variations in temperature and density is both systemically underestimated and subject to large scatter. This effect could wash out any true correlations between the column density of the cloud material and the temperature of the core embedded in it.
In a numerical simulation of embedded starless cores, Stamatellos & Whitworth (2003) show that the temperature profile of a core shielded by = 5 material (a typical value for seen towards the starless cores in Perseus) is not significantly different from a naked core, while deeply embedded cores ( = 20) are noticably colder than naked cores. In addition, we expect that the column density along the line of sight is a poor indicator of volumetric shielding due to the porosity of molecular clouds like Perseus. The visual impression given by two-dimensional maps and position-position-velocity cubes of nearby molecular clouds is one of non-relaxed structures with many filaments, voids and shells, supporting this view. The observational evidence supports the idea that the shielding provided by higher material in Perseus does not lead to lower temperatures of the embedded starless cores. The opposite effect is observed, which may be explained by the greater thermal support needed to balance the increased pressure on the cores by the weight of the molecular cloud.
4.5. Tkin vs. and
Clumpiness formed by turbulence in a molecular cloud is known to significantly affect the temperature of the cloud material, with higher turbulence leading to greater porosity and penetration by the ISRF, and therefore higher temperatures (Bethell et al., 2004). However, Stamatellos et al. (2007) find that the densest portions of the cloud (where starless cores are found) are primarily heated by long wavelength radiation that is not effectively shielded by the clumpy structure. It is therefore not obvious if one would expect starless core temperatures to be correlated with turbulence.
Here we examine whether turbulence affects the temperature of the starless cores in the Perseus molecular cloud. We use the non-thermal linewidth of NH3 as a proxy for the turbulence within the cores, and the total linewidth of 13CO as an estimate of the turbulence in the surrounding medium (the measured 13CO linewidth is roughly a factor of 10 higher than the thermal linewidth). As before, we consider field and cluster starless cores separately to avoid confusing a correlation between Tkin and turbulence with a correlation between Tkin and the field vs. cluster environment.
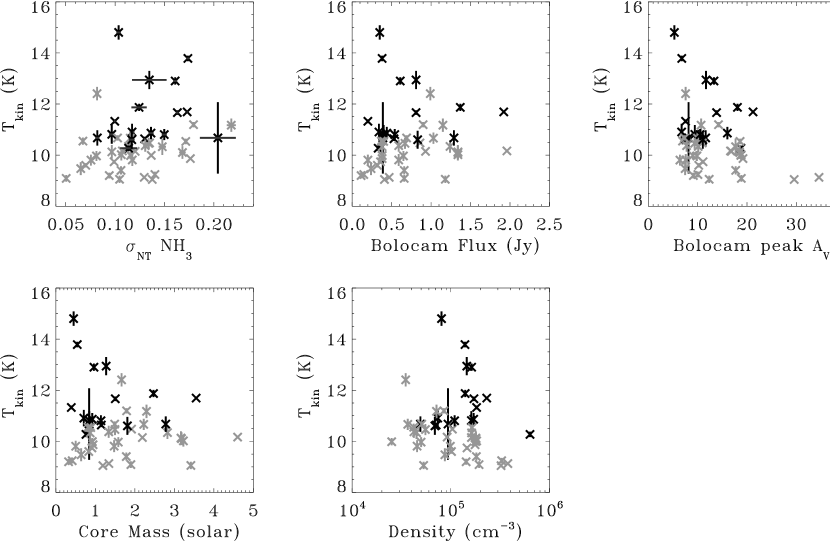
Figure 3 and Table 3 show that there is no correlation between the non-thermal linewidth of NH3 and Tkin when considering the field and cluster popoluations of starless cores separately, but there is a significant positive correlation for the ensemble. This implies that those starless cores in Perseus are more turbulent when found in clusters than in the field, but the turbulence itself does not necessarily lead to higher temperatures. Our expectation of starless core geometry is that they are in some sense “relaxed” structures and therefore not porous, regardless of the level of internal turbulence. CO linewidth does not correlate with Tkin for those cores in clusters, but it is significantly positively correlated with Tkin for field starless cores, as shown in Figure 2. One interpretation of of the field/cluster difference is that within clusters the CO linewidth is likely to be affected strongly by the ongoing star formation, while the CO linewidth in the field better traces the cloud geometry, so only in the field does a larger CO linewidth imply better penetration by the ISRF.
4.6. Tkin vs. 1.1mm Continuum Derived Properties
It might be supposed that the temperatures of starless cores are partly determined by the internal properties of the cores themselves, and not just by their environment. Here we compare Tkin with 1.1mm Bolocam flux, the peak column density (expressed in ), the mass and the average volume density derived from the 1.1mm map and NH3-derived temperature of each core.
The peak is derived from the peak 1.1mm flux () of each core and the NH3-derived temperature.
| (1) |
with H cm2 mag-1 (Frerking et al., 1982). Here is the beam solid angle, is the mass of hydrogen, cm2 g-1 is the dust opacity per gram of gas interpolated from Table 1 column 5 of Ossenkopf & Henning (1994) for dust grains with thin ice mantles, is the Planck function, and is the mean molecular weight per H2 molecule. A gas to dust mass ratio of 100 is included in .
The core mass is derived from the total 1mm flux () and Tkin using the equation,
| (2) |
where is the dust opacity, is the distance to Perseus (250 pc). The density is derived from the core mass and the deconvolved average FWHM size () of the core (), where is the mean molecular weight per particle, as explained in Enoch et al. (2006).
When deriving the core mass, peak column density and average volume density from the 1.1mm continuum emission, we use the gas temperature (Tkin) in the calculation, under the assumption that the gas and dust temperatures are coupled. Although this assumption is valid for the densities ( cm-3) derived for these cores (Goldsmith, 2001; Galli et al., 2002), we are introducing a potential bias in our analysis because Tkin and the derived mass are not independent. It would be preferable to use the Tdust rather than Tkin to determine the 1.1mm-derived core properties, but this requires mapping the dust emission from each core at several wavelengths, sampling both the peak of the spectral energy distribution (SED) as well as the Rayleigh-Jeans tail to derive the dust temperature, column desnity and emissivity spectral index profiles. Existing surveys of Perseus (Enoch et al., 2006; Kirk et al., 2006) have only sampled the Rayleigh-Jeans portion of the SED, so we do not have accurate estimates of the dust temperatures within the starless cores, and we are forced to use the gas temperature in our calculations.
Note that some of the Bolocam cores, whose numbers are given in Table 1 (Per-Bolo 24, 75, 100 and 122), have been observed in multiple GBT pointings with each position corresponding to different sub-condensations within the core. Each of these pointings is assigned the same 1.1mm total and peak flux and dimensions as that of the entire Bolocam core, and the peak , mass and density are all derived from the overall core Bolocam flux measurements and the Tkin derived for the sub-core. An alternative analysis would have been to break up each Bolocam core with more than one NH3 pointing into sub-cores and assign different fractions of the total 1.1mm flux to each portion, but the procedure to do the division would be somewhat arbitrary, just as the decision of which cores should be observed only once and which in multiple positions was not based on an absolute prescription. Since neither analysis is obviously the correct one, we decided to go with the simpler of the two and double-count the 1.1mm properties of the four Bolocam cores with more than one NH3 observation.
In Fig. 3 and Table 3 we compare Tkin with the 1.1mm flux and properties derived from the Enoch et al. (2006) Bolocam map of Perseus. We find no correlation between Tkin and the 1.1mm flux, core mass, average volume density or peak for those cores in IC348 and NGC1333. On the other hand, for starless cores in the field there are significant negative correlations between Tkin and the peak and average volume density, and a positive correlation between Tkin and the Bolocam flux. If we assume that starless cores are effectively self-shielded from the ISRF because they are not porous, then we would expect higher peak column densities and volume densities to correspond to higher volumetric shielding and lower internal temperatures. It is not obvious why the self-shielding argument does not hold for those starless cores in NGC1333 and IC348. The connection between 1.1mm flux and Tkin may be simply that for a given mass a warmer core will produce more emission, but this argument does not explain why the positive correlation is not seen in cluster starless cores.
5. Conclusions
In this paper we investigate the temperature distribution of starless cores in Perseus. Although, the range of temperatures derived from NH3 (1,1) and (2,2) pointing is quite narrow, from K, there are several interesting correlations and lack of correlations.
The location of a starless core does affect its temperature. We find that those cores inside the two main star-forming regions in Perseus (IC348 and NGC1333) are warmer than those not in clusters. Although there is no correlation between Tkin and the distance to the nearest class 0/I protostar for those starless cores in clusters, starless cores in the field are colder the further away they are from protostars.
Certain properties of the molecular cloud are related to the temperatures of the starless cores embedded in it. Tkin is higher when the extinction-derived column density of the molecular cloud is larger, despite the additional shielding from the ISRF that the higher column density implies, which may be due to the increased pressure on the cores from the molecular cloud in higher column density regions. This correlation is not seen when column density along the line of sight in Perseus is measured from far-infrared dust emission. After controlling for the cluster/field temperature difference, we find that Tkin does not depend on the temperature of the molecular cloud, as measured by CO or dust emission. The clusters have higher values of TCO and Td on average, so presumably the same processes that are heating the clusters are also heating the cores within them. Those starless cores outside NGC1333 and IC348 are warmer in regions with higher 13CO linewidth, suggesting the the turbulence causing the high linewidths makes the cloud more porous to the ISRF, which in turn heats the embedded cores. There is no significant correlation between and Tkin for those cores in the clusters.
Some internal properties of starless cores are correlated with their temperature. For those starless cores in the field, total 1.1mm flux is higher in cores that are warmer, and peak column density and average volume density are higher in cores that are colder. A higher temperature naturally leads to more 1.1mm flux for a given core mass, and the correlations between Tkin and peak core column density and volume density can be explained by the amount of shielding from the ISRF that the additional material provides. However, it is surprising that none of these correlations exist for starless cores inside the clusters. Support was provided to MLE by NASA through the Spitzer Space Telescope Fellowship Program.
References
- Belikov et al. (2002) Belikov, A. N., Kharchenko, N. V., Piskunov, A. E., Schilbach, E., & Scholz, R.-D. 2002, A&A, 387, 117
- Bergin & Tafalla (2007) Bergin, E. A., & Tafalla, M. 2007, ARA&A, 45, 339
- Bertoldi & McKee (1992) Bertoldi, F., & McKee, C. F. 1992, ApJ, 395, 140
- Bethell et al. (2004) Bethell, T. J., Zweibel, E. G., Heitsch, F., & Mathis, J. S. 2004, ApJ, 610, 801
- Černis & Straižys (2003) Černis, K., & Straižys, V. 2003, Baltic Astronomy, 12, 301
- Crapsi et al. (2007) Crapsi, A., Caselli, P., Walmsley, M. C., & Tafalla, M. 2007, A&A, 470, 221
- Dunham et al. (2008) Dunham, M. M., Crapsi, A., Evans, N. J., II, Bourke, T. L., Huard, T. L., Myers, P. C., & Kauffmann, J. 2008, ArXiv e-prints, 806, arXiv:0806.1754
- Enoch et al. (2008b) Enoch, M. L. et al. 2008b, in prep.
- Enoch et al. (2008) Enoch, M. L., Evans, N. J., II, Sargent, A. I., Glenn, J., Rosolowsky, E., & Myers, P. 2008, ArXiv e-prints, 805, arXiv:0805.1075
- Enoch et al. (2006) Enoch, M. L., et al. 2006, ApJ, 638, 293
- Evans et al. (2001) Evans, N. J., II, Rawlings, J. M. C., Shirley, Y. L., & Mundy, L. G. 2001, ApJ, 557, 193
- Evans et al. (2007) Evans, N. J., II, et al. 2007, Final Delivery of Data from the c2d Legacy Project: IRAC and MIPS
- Evans et al. (2003) Evans, N. J., II, et al. 2003, PASP, 115, 965
- Frerking et al. (1982) Frerking, M. A., Langer, W. D., & Wilson, R. W. 1982, ApJ, 262, 590
- Galli et al. (2002) Galli, D., Walmsley, M., & Gonçalves, J. 2002, A&A, 394, 275
- Goldsmith (2001) Goldsmith, P. F. 2001, ApJ, 557, 736
- Gonçalves et al. (2004) Gonçalves, J., Galli, D., & Walmsley, M. 2004, A&A, 415, 617
- Goodman et al. (1998) Goodman, A. A., Barranco, J. A., Wilner, D. J., & Heyer, M. H. 1998, ApJ, 504, 223
- Goodman et al. (2008) Goodman, A. A., Pineda, J. & Schnee, S. ApJ, submitted
- Harvey et al. (2007) Harvey, P., Merín, B., Huard, T. L., Rebull, L. M., Chapman, N., Evans, N. J., II, & Myers, P. C. 2007, ApJ, 663, 1149
- Hatchell et al. (2007) Hatchell, J., Fuller, G. A., Richer, J. S., Harries, T. J., & Ladd, E. F. 2007, A&A, 468, 1009
- Jijina et al. (1999) Jijina, J., Myers, P. C., & Adams, F. C. 1999, ApJS, 125, 161
- Jørgensen et al. (2007) Jørgensen, J. K., Johnstone, D., Kirk, H., & Myers, P. C. 2007, ApJ, 656, 293
- Kirk et al. (2006) Kirk, H., Johnstone, D., & Di Francesco, J. 2006, ApJ, 646, 1009
- Kirk et al. (2007) Kirk, J. M., Ward-Thompson, D., & André, P. 2007, MNRAS, 375, 843
- Lada et al. (2008) Lada, C. J., Muench, A. A., Rathborne, J., Alves, J. F., & Lombardi, M. 2008, ApJ, 672, 410
- Lombardi & Alves (2001) Lombardi, M., & Alves, J. 2001, A&A, 377, 1023
- Miville-Deschênes & Lagache (2005) Miville-Deschênes, M.-A., & Lagache, G. 2005, ApJS, 157, 302
- Ossenkopf & Henning (1994) Ossenkopf, V., & Henning, T. 1994, A&A, 291, 943
- Pineda et al. (2008) Pineda, J., Caselli, P., & Goodman, A. 2008 ApJ, accepted
- Rebull et al. (2007) Rebull, L. M., et al. 2007, ApJS, 171, 447
- Ridge et al. (2006) Ridge, N. A., et al. 2006, AJ, 131, 2921
- Rosolowsky et al. (2008) Rosolowsky, E. W., Pineda, J. E., Foster, J. B., Borkin, M. A., Kauffmann, J., Caselli, P., Myers, P. C., & Goodman, A. A. 2008, ApJS, 175, 509
- Schnee et al. (2006) Schnee, S., Bethell, T., & Goodman, A. 2006, ApJ, 640, L47
- Schnee et al. (2008) Schnee, S., Li, J., Goodman, A. A., & Sargent, A. I. 2008, ArXiv e-prints, 805, arXiv:0805.4215
- Stamatellos & Whitworth (2003) Stamatellos, D., & Whitworth, A. P. 2003, A&A, 407, 941
- Stamatellos et al. (2004) Stamatellos, D., Whitworth, A. P., André, P., & Ward-Thompson, D. 2004, A&A, 420, 1009
- Stamatellos et al. (2007) Stamatellos, D., Whitworth, A. P., & Ward-Thompson, D. 2007, MNRAS, 379, 1390
- Swade (1989) Swade, D. A. 1989, ApJ, 345, 828
- Tafalla et al. (2002) Tafalla, M., Myers, P. C., Caselli, P., Walmsley, C. M., & Comito, C. 2002, ApJ, 569, 815
- Walmsley & Ungerechts (1983) Walmsley, C. M., & Ungerechts, H. 1983, A&A, 122, 164
- Zucconi et al. (2001) Zucconi, A., Walmsley, C. M., & Galli, D. 2001, A&A, 376, 650
| RA11J2000 position of NH3 pointing, 2J2000 position of NH3 pointing, 3Kinetic temperature of core derived from NH3 (1,1) and (2,2) spectra, 4Non-thermal 1-D velocity dispersion of NH3 spectra, 5Total 1.1mm flux of the Bolocam core, 6Peak column density of the core derived from the peak 1.1mm flux and Tkin, 7Total mass of Bolocam core derived from the integrated 1.1mm flux and Tkin, 8Average density of free particles of Bolocam core derived from its mass and size, 9Per-Bolo number taken from Table 4 in Enoch et al. (2008) | Dec22footnotemark: | Tkin33footnotemark: | 44footnotemark: | 1.1mm Flux55footnotemark: | Peak 66footnotemark: | Mass77footnotemark: | Density88footnotemark: | Number99footnotemark: |
|---|---|---|---|---|---|---|---|---|
| J2000 | J2000 | K | km s-1 | Jy | mag | Msolar | cm-3 | |
| 3:25:07.8 | 30:24:22 | 9.2 | 0.09 | 0.1 | 9.1 | 0.3 | 1.4E+05 | 1 |
| 3:25:09.7 | 30:23:53 | 9.2 | 0.14 | 0.1 | 10.1 | 0.4 | 3.3E+05 | 2 |
| 3:25:10.1 | 30:44:41 | 10.0 | 0.12 | 0.4 | 9.0 | 0.9 | 2.5E+04 | 3 |
| 3:25:17.1 | 30:18:53 | 10.3 | 0.11 | 1.2 | 10.1 | 2.8 | 4.5E+04 | 4 |
| 3:25:26.9 | 30:21:53 | 9.1 | 0.10 | 1.2 | 12.3 | 3.4 | 5.3E+04 | 6 |
| 3:25:46.1 | 30:44:11 | 11.2 | 0.18 | 0.9 | 14.2 | 1.8 | 8.5E+04 | 11 |
| 3:25:48.8 | 30:42:24 | 9.1 | 0.13 | 0.5 | 34.6 | 1.3 | 3.8E+05 | 13 |
| 3:25:50.6 | 30:42:02 | 9.0 | 0.14 | 0.4 | 29.6 | 1.2 | 3.2E+05 | 14 |
| 3:27:02.1 | 30:15:08 | 10.4 | 0.13 | 0.6 | 7.8 | 1.3 | 4.2E+04 | 19 |
| 3:27:28.9 | 30:15:04 | 10.7 | 0.10 | 0.7 | 7.3 | 1.5 | 5.1E+04 | 20 |
| 3:27:40.0 | 30:12:13 | 10.5 | 0.17 | 0.4 | 18.6 | 0.9 | 1.6E+05 | 23 |
| 3:27:55.9 | 30:06:18 | 9.1 | 0.05 | 0.7 | 18.9 | 1.9 | 1.9E+05 | 24 |
| 3:28:05.5 | 30:06:19 | 9.4 | 0.11 | 0.7 | 17.7 | 1.8 | 1.8E+05 | 24 |
| 3:28:32.4 | 31:04:43 | 10.6 | 0.13 | 0.5 | 7.6 | 1.1 | 7.1E+04 | 26 |
| 3:28:33.4 | 30:19:35 | 10.7 | 0.12 | 1.0 | 10.0 | 2.2 | 3.7E+04 | 27 |
| 3:28:39.5 | 31:18:35 | 11.7 | 0.17 | 1.9 | 21.2 | 3.6 | 2.3E+05 | 31 |
| 3:28:48.5 | 31:16:03 | 11.3 | 0.10 | 0.2 | 7.6 | 0.4 | 1.8E+05 | 35 |
| 3:28:52.2 | 31:18:08 | 13.8 | 0.17 | 0.4 | 6.8 | 0.5 | 1.4E+05 | 37 |
| 3:29:18.5 | 31:25:13 | 11.9 | 0.12 | 1.4 | 18.1 | 2.5 | 1.4E+05 | 53 |
| 3:29:22.5 | 31:36:24 | 9.8 | 0.12 | 0.6 | 7.6 | 1.5 | 4.6E+04 | 56 |
| 3:29:25.8 | 31:28:17 | 10.3 | 0.11 | 0.3 | 18.8 | 0.8 | 6.3E+05 | 58 |
| 3:30:24.1 | 30:27:39 | 10.5 | 0.07 | 0.4 | 7.0 | 0.8 | 4.2E+04 | 61 |
| 3:30:45.6 | 30:52:36 | 10.5 | 0.13 | 0.7 | 9.4 | 1.5 | 5.5E+04 | 63 |
| 3:30:50.5 | 30:49:17 | 9.8 | 0.08 | 0.2 | 6.4 | 0.5 | 9.9E+04 | 64 |
| 3:32:26.9 | 30:59:11 | 10.5 | 0.13 | 0.9 | 11.0 | 1.9 | 1.0E+05 | 67 |
| 3:32:44.1 | 31:00:01 | 10.2 | 0.11 | 2.0 | 16.7 | 4.6 | 9.2E+04 | 70 |
| 3:32:51.3 | 31:01:48 | 11.2 | 0.22 | 1.1 | 10.7 | 2.3 | 7.2E+04 | 71 |
| 3:32:57.0 | 31:03:21 | 10.1 | 0.12 | 0.9 | 16.8 | 2.2 | 1.6E+05 | 72 |
| 3:33:02.0 | 31:04:33 | 10.0 | 0.14 | 0.4 | 18.8 | 0.9 | 1.8E+05 | 74 |
| 3:33:04.3 | 31:04:57 | 9.9 | 0.18 | 0.4 | 19.2 | 0.9 | 1.8E+05 | 75 |
| 3:33:06.3 | 31:06:26 | 10.3 | 0.15 | 0.4 | 17.7 | 0.9 | 1.6E+05 | 75 |
| 3:33:25.2 | 31:05:35 | 9.7 | 0.10 | 0.4 | 11.1 | 0.9 | 1.5E+05 | 82 |
| 3:40:49.5 | 31:48:35 | 12.4 | 0.08 | 1.0 | 7.6 | 1.7 | 3.5E+04 | 89 |
| 3:41:40.2 | 31:58:05 | 9.5 | 0.07 | 0.2 | 7.5 | 0.6 | 8.7E+04 | 92 |
| 3:41:46.0 | 31:57:22 | 9.6 | 0.07 | 0.3 | 10.2 | 0.8 | 1.0E+05 | 94 |
| 3:43:44.0 | 32:02:52 | 12.9 | 0.13 | 0.8 | 11.7 | 1.3 | 1.5E+05 | 100 |
| 3:43:45.5 | 32:01:44 | 14.0 | 0.10 | 0.3 | 5.3 | 0.4 | 8.0E+04 | 101 |
| 3:43:45.8 | 32:03:11 | 11.7 | 0.16 | 0.8 | 13.8 | 1.5 | 1.7E+05 | 100 |
| 3:43:57.8 | 32:04:06 | 12.9 | 0.16 | 0.6 | 13.3 | 1.0 | 1.6E+05 | 105 |
| 3:44:05.1 | 32:00:28 | 10.7 | 0.20 | 0.4 | 8.2 | 0.8 | 9.4E+04 | 109 |
| 3:44:05.3 | 32:02:05 | 10.9 | 0.14 | 0.4 | 16.0 | 0.9 | 1.7E+05 | 110 |
| 3:44:14.6 | 31:57:59 | 10.6 | 0.12 | 0.8 | 11.1 | 1.8 | 6.9E+04 | 111 |
| 3:44:36.4 | 31:58:40 | 10.8 | 0.15 | 0.5 | 10.5 | 1.1 | 1.1E+05 | 115 |
| 3:44:48.8 | 32:00:29 | 10.8 | 0.10 | 0.4 | 9.4 | 0.8 | 1.6E+05 | 117 |
| 3:44:56.1 | 32:00:32 | 10.9 | 0.12 | 0.3 | 6.8 | 0.7 | 7.4E+04 | 118 |
| 3:45:15.9 | 32:04:49 | 10.7 | 0.08 | 1.3 | 11.6 | 2.8 | 4.9E+04 | 119 |
| 3:47:33.5 | 32:50:55 | 10.0 | 0.08 | 0.7 | 9.9 | 1.6 | 5.0E+04 | 121 |
| 3:47:38.6 | 32:52:19 | 10.1 | 0.17 | 1.3 | 18.5 | 3.2 | 1.8E+05 | 122 |
| 3:47:39.7 | 32:53:57 | 10.1 | 0.10 | 1.3 | 18.5 | 3.2 | 1.8E+05 | 122 |
| 3:47:39.8 | 32:53:34 | 10.0 | 0.11 | 1.3 | 18.8 | 3.2 | 1.8E+05 | 122 |
| RA11J2000 position of NH3 pointing, 2J2000 position of NH3 pointing, 3Kinetic temperature of core derived from NH3 (1,1) and (2,2) spectra, 4Dust temperature of the Perseus molecular cloud derived from FIR emission, 5Gas temperature of the Perseus molecular cloud derived from 12CO (1–0) emission, 6Column density of the Perseus molecular cloud derived from NIR extinction, 7Column density of the Perseus molecular cloud derived from FIR emission, 8 1-D velocity dispersion of 13CO (1–0), 9Distance to nearest Class 0/I protostar, 10Is the core within a cluster (NGC1333 or IC348)? | Dec22footnotemark: | Tkin33footnotemark: | Td44footnotemark: | TCO55footnotemark: | NIR 66footnotemark: | FIR 77footnotemark: | 88footnotemark: | Distance Class 0/I99footnotemark: | In a Cluster?1010footnotemark: |
|---|---|---|---|---|---|---|---|---|---|
| J2000 | J2000 | K | K | K | mag | mag | km s-1 | pc | |
| 3:25:07.8 | 30:24:22 | 9.2 | 14.6 | 11.6 | 5.0 | 2.6 | 0.5 | 1.51 | N |
| 3:25:09.7 | 30:23:53 | 9.2 | 14.6 | 11.2 | 5.0 | 2.6 | 0.6 | 1.50 | N |
| 3:25:10.1 | 30:44:41 | 10.0 | 15.2 | 12.9 | 5.1 | 4.0 | 0.6 | 0.19 | N |
| 3:25:17.1 | 30:18:53 | 10.3 | 12.9 | 12.0 | 5.0 | 7.2 | 0.7 | 1.28 | N |
| 3:25:26.9 | 30:21:53 | 9.1 | 12.9 | 12.7 | 3.7 | 6.7 | 0.5 | 1.20 | N |
| 3:25:46.1 | 30:44:11 | 11.2 | 15.5 | 11.0 | 5.5 | 5.1 | 0.7 | 0.12 | N |
| 3:25:48.8 | 30:42:24 | 9.1 | 14.3 | 11.2 | 4.8 | 5.4 | 0.7 | 0.20 | N |
| 3:25:50.6 | 30:42:02 | 9.0 | 12.5 | 10.6 | 4.8 | 10.4 | 0.7 | 0.24 | N |
| 3:27:02.1 | 30:15:08 | 10.4 | 13.5 | 13.1 | 4.8 | 3.8 | 0.6 | 0.39 | N |
| 3:27:28.9 | 30:15:04 | 10.7 | 14.9 | NaN | 9.5 | 2.9 | NaN | 0.16 | N |
| 3:27:40.0 | 30:12:13 | 10.5 | 17.4 | NaN | 8.8 | 2.8 | NaN | 0.04 | N |
| 3:27:55.9 | 30:06:18 | 9.1 | 13.7 | NaN | 3.1 | 3.1 | NaN | 0.17 | N |
| 3:28:05.5 | 30:06:19 | 9.4 | 13.7 | NaN | 2.9 | 3.1 | NaN | 0.16 | N |
| 3:28:32.4 | 31:04:43 | 10.6 | 12.8 | 18.8 | 5.4 | 8.3 | 1.1 | 0.14 | Y |
| 3:28:33.4 | 30:19:35 | 10.7 | 13.0 | NaN | 4.5 | 6.0 | NaN | 0.90 | N |
| 3:28:39.5 | 31:18:35 | 11.7 | 12.3 | 18.6 | 7.8 | 19.1 | 0.8 | 0.05 | Y |
| 3:28:48.5 | 31:16:03 | 11.3 | 16.0 | 16.2 | 8.5 | 0.0 | 0.9 | 0.15 | Y |
| 3:28:52.2 | 31:18:08 | 13.8 | 15.0 | 19.4 | 9.2 | 10.7 | 1.3 | 0.10 | Y |
| 3:29:18.5 | 31:25:13 | 11.9 | NaN | 49.0 | 6.5 | NaN | 0.7 | 0.13 | Y |
| 3:29:22.5 | 31:36:24 | 9.8 | 15.2 | 15.5 | 5.9 | 2.9 | 0.5 | 0.23 | N |
| 3:29:25.8 | 31:28:17 | 10.3 | 15.6 | 23.3 | 5.5 | 0.0 | 1.2 | 0.14 | Y |
| 3:30:24.1 | 30:27:39 | 10.5 | 14.2 | NaN | 7.0 | 5.5 | NaN | 0.16 | N |
| 3:30:45.6 | 30:52:36 | 10.5 | 13.3 | 12.4 | 2.7 | 4.8 | 0.9 | 0.74 | N |
| 3:30:50.5 | 30:49:17 | 9.8 | 13.5 | 11.6 | 2.1 | 2.8 | 0.8 | 0.54 | N |
| 3:32:26.9 | 30:59:11 | 10.5 | 13.4 | 13.5 | 10.3 | 9.0 | 0.7 | 0.23 | N |
| 3:32:44.1 | 31:00:01 | 10.2 | 12.2 | 12.8 | 10.0 | 21.7 | 0.9 | 0.30 | N |
| 3:32:51.3 | 31:01:48 | 11.2 | 12.3 | 13.7 | 8.8 | 20.3 | 0.9 | 0.36 | N |
| 3:32:57.0 | 31:03:21 | 10.1 | 12.4 | 14.4 | 8.5 | 15.4 | 0.8 | 0.39 | N |
| 3:33:02.0 | 31:04:33 | 10.0 | 12.5 | 13.9 | 8.5 | 16.7 | 0.9 | 0.27 | N |
| 3:33:04.3 | 31:04:57 | 9.9 | 12.5 | 14.0 | 8.5 | 15.3 | 0.8 | 0.23 | N |
| 3:33:06.3 | 31:06:26 | 10.3 | 12.7 | 13.3 | 8.5 | 13.3 | 0.9 | 0.14 | N |
| 3:33:25.2 | 31:05:35 | 9.7 | 12.5 | 15.8 | 8.6 | 19.1 | 0.9 | 0.10 | N |
| 3:40:49.5 | 31:48:35 | 12.4 | 16.1 | 15.4 | 7.7 | 9.1 | 0.9 | 0.42 | N |
| 3:41:40.2 | 31:58:05 | 9.5 | 16.3 | 21.3 | 8.4 | 7.5 | 0.6 | 1.09 | N |
| 3:41:46.0 | 31:57:22 | 9.6 | 15.6 | 19.7 | 8.4 | 10.3 | 0.7 | 1.09 | N |
| 3:43:44.0 | 32:02:52 | 12.9 | NaN | 21.8 | 9.5 | NaN | 0.6 | 0.11 | Y |
| 3:43:45.5 | 32:01:44 | 14.0 | 14.6 | 20.7 | 10.1 | 15.8 | 0.5 | 0.14 | Y |
| 3:43:45.8 | 32:03:11 | 11.7 | 15.1 | 21.4 | 8.7 | 21.3 | 0.6 | 0.07 | Y |
| 3:43:57.8 | 32:04:06 | 12.9 | 15.4 | 27.0 | 7.4 | 19.0 | 0.8 | 0.08 | Y |
| 3:44:05.1 | 32:00:28 | 10.7 | 14.7 | 21.9 | 9.0 | 14.8 | 0.8 | 0.13 | Y |
| 3:44:05.3 | 32:02:05 | 10.9 | NaN | 23.5 | 9.0 | NaN | 0.6 | 0.06 | Y |
| 3:44:14.6 | 31:57:59 | 10.6 | NaN | 17.0 | 7.9 | NaN | 0.7 | 0.16 | Y |
| 3:44:36.4 | 31:58:40 | 10.8 | 15.3 | 16.8 | 7.2 | 9.1 | 0.8 | 0.22 | Y |
| 3:44:48.8 | 32:00:29 | 10.8 | 14.8 | 16.9 | 5.9 | 12.5 | 0.6 | 0.10 | Y |
| 3:44:56.1 | 32:00:32 | 10.9 | 14.9 | 18.6 | 5.4 | 10.0 | 0.5 | 0.20 | Y |
| 3:45:15.9 | 32:04:49 | 10.7 | 14.3 | 24.5 | 5.2 | 12.3 | 0.5 | 0.55 | Y |
| 3:47:33.5 | 32:50:55 | 10.0 | 14.0 | 16.5 | 5.8 | 6.5 | 0.5 | 0.14 | N |
| 3:47:38.6 | 32:52:19 | 10.1 | 13.4 | 16.0 | 7.6 | 10.7 | 0.7 | 0.06 | N |
| 3:47:39.7 | 32:53:57 | 10.1 | 12.7 | 14.2 | 7.6 | 11.9 | 0.6 | 0.16 | N |
| 3:47:39.8 | 32:53:34 | 10.0 | 12.4 | 14.8 | 7.6 | 14.8 | 0.6 | 0.13 | N |
| Property | Location | r value11coefficient of correlation (), 2t statistic: , 3% confidence of correlation, 4degrees of freedom, 5distance to a Class 0/I source, as identified in Enoch et al. (2008b) and plotted in Figure 2 | t value22footnotemark: | confidence33footnotemark: | DOF44footnotemark: |
|---|---|---|---|---|---|
| Td | field+cluster | 0.27 | 1.83 | 96.3 | 44 |
| TCO | field+cluster | 0.45 | 3.26 | 99.9 | 42 |
| NIR | field+cluster | 0.47 | 3.66 | 99.9 | 48 |
| FIR | field+cluster | 0.34 | 2.43 | 99.0 | 44 |
| field+cluster | 0.20 | 1.31 | 90.1 | 42 | |
| field+cluster | 0.28 | 2.06 | 97.8 | 48 | |
| 1.1mm Flux | field+cluster | 0.11 | 0.73 | 76.6 | 48 |
| Peak | field+cluster | -0.33 | 2.39 | 99.0 | 48 |
| Mass | field+cluster | -0.11 | 0.78 | 78.0 | 48 |
| Density | field+cluster | -0.18 | 1.25 | 89.1 | 48 |
| dist 055footnotemark: | field+cluster | -0.45 | 2.29 | 98.3 | 21 |
| dist I55footnotemark: | field+cluster | -0.21 | 1.14 | 86.8 | 29 |
| dist 0/I55footnotemark: | field+cluster | -0.29 | 1.71 | 95.1 | 33 |
| Td | field only | 0.16 | 0.93 | 82.0 | 31 |
| TCO | field only | 0.04 | 0.20 | 57.8 | 25 |
| NIR | field only | 0.36 | 2.17 | 98.1 | 31 |
| FIR | field only | 0.16 | 0.91 | 81.5 | 31 |
| field only | 0.50 | 2.90 | 99.6 | 25 | |
| field only | 0.27 | 1.55 | 93.5 | 31 | |
| 1.1mm Flux | field only | 0.35 | 2.06 | 97.6 | 31 |
| Peak | field only | -0.36 | 2.17 | 98.1 | 31 |
| Mass | field only | 0.15 | 0.86 | 80.1 | 31 |
| Density | field only | -0.54 | 3.58 | 99.1 | 31 |
| dist 055footnotemark: | field only | -0.61 | 2.32 | 97.7 | 9 |
| dist I55footnotemark: | field only | -0.54 | 2.43 | 98.6 | 14 |
| dist 0/I55footnotemark: | field only | -0.51 | 2.42 | 98.7 | 17 |
| Td | cluster only | 0.06 | 0.19 | 57.4 | 11 |
| TCO | cluster only | 0.12 | 0.46 | 67.4 | 15 |
| NIR | cluster only | 0.63 | 3.13 | 99.7 | 15 |
| FIR | cluster only | 0.39 | 1.41 | 90.7 | 11 |
| cluster only | -0.09 | 0.36 | 63.8 | 15 | |
| cluster only | 0.14 | 0.56 | 70.8 | 15 | |
| 1.1mm Flux | cluster only | -0.03 | 0.12 | 54.7 | 15 |
| Peak | cluster only | -0.25 | 0.99 | 83.1 | 15 |
| Mass | cluster only | -0.19 | 0.76 | 77.0 | 15 |
| Density | cluster only | -0.19 | 0.75 | 76.8 | 15 |
| dist 055footnotemark: | cluster only | -0.26 | 0.86 | 79.5 | 10 |
| dist I55footnotemark: | cluster only | -0.15 | 0.55 | 70.4 | 13 |
| dist 0/I55footnotemark: | cluster only | -0.18 | 0.69 | 74.9 | 14 |