New Results from the MINOS Experiment
Abstract
In this paper we present the latest results from the MINOS Experiment. This includes a new measurement of the oscillation parameters (, ) based on protons-on-target of data and a first analysis of neutral current events in the Far Detector. The prospects for appearance measurements in MINOS are also discussed.
1 Introduction
MINOS is a two detector long-baseline experiment utilizing the Neutrinos at the Main Injector (NuMI) beamline at Fermilab. The Near and Far Detectors have masses of 0.98 kton and 5.4 kton with the Far Detector located at a distance of 735 km in the Soudan Mine in Minnesota. The experiment is designed to explore oscillations at the large previously probed by atmospheric neutrino experiments and the K2K experiment Ahn:2006zza ; Ashie:2004mr ; Ashie:2005ik . The experimental goals include precision measurements of the oscillation parameters, testing for exotic neutrino disappearance explanations, and searching for subdominant appearance. In addition, charge-separated atmospheric neutrino and cosmic ray studies can be carried out with the Far Detector and neutrino cross section measurements can be carried out in the high-rate environment of the Near Detector. The published result from the experiment on the measurement of oscillation parameters was based on an exposure of protons-on-target (POT) Michael:2006rx .
In the NuMI beam 120 GeV protons from the Fermilab Main Injector are extracted in a 10 s spill every 2.2 s and strike a water-cooled graphite target, producing kaons and pions. Two parabolic magnetic horns focus charged secondaries, producing a beam that is 92.9% , 5.8% and 1.3% + . The beam is now in its third year of operation and is obtaining intensities of POT/spill for a beam power of 0.275 MW, and is regularly achieving POT/day. The energy spectrum of the neutrino beam can be changed by moving the position of the target relative to the horns. Data taken in several different target configurations are used to improve modeling of hadron production off the target and thereby improve the prediction of the neutrino beam Adamson:2007gu .
2 MINOS Analyses
The analyses presented here have several steps in common and are labeled by the dominant scattering mechanism. In the ‘CC Analysis’ we compare selected charged current interactions in the Near and Far Detectors to make a measurement of the oscillation parameters and . In the ‘NC Analysis’ we compare selected neutral current events in the two detectors to investigate the possibility of oscillations into sterile neutrinos. In the ‘ Analysis’ we compare -selected events in the two detectors to search for subdominant oscillations and non-zero . All have been or are being conducted as ‘blind analyses’, i.e. the full set of Far Detector data sensitive to the phenomena in question is not examined until the complete analysis procedure is defined. For all analyses the event selection is applied first to the high-statistics data set from the Near Detector. This measurement is then used to predict what will be measured in the Far Detector under a particular oscillation scenario Adamson:2007gu .
The data are divided into three data sets, Run 1, Run 2, and Run 3, separated by Fermilab shutdowns. The Run 1 data were analyzed in our 2006 publication Michael:2006rx . The CC analysis presented here includes all Run 1 and Run 2 data including POT of data in a high-energy configuration that were taken at the start of Run 2. The NC analysis presented here uses the Run 1 data and a subset of the Run 2 data.
2.1 Charged Current Analysis
The measurement of oscillation parameters is made through a comparison of charged current muon neutrino interactions in the two detectors. Charged current (CC) vs. neutral current (NC) event classification is performed with a -nearest neighbor-based algorithm with four inputs: track length (in planes), and for hits on the track the mean pulse height, fluctuation in pulse height, and transverse track profile Ospanov:Thesis . Relative to the previous analysis this new classifier, in conjunction with new event reconstruction, improves the efficiency for selection of CC events in the absence of oscillations from 75.3% to 81.5% and reduces the NC contamination from 1.8% to 0.6%.
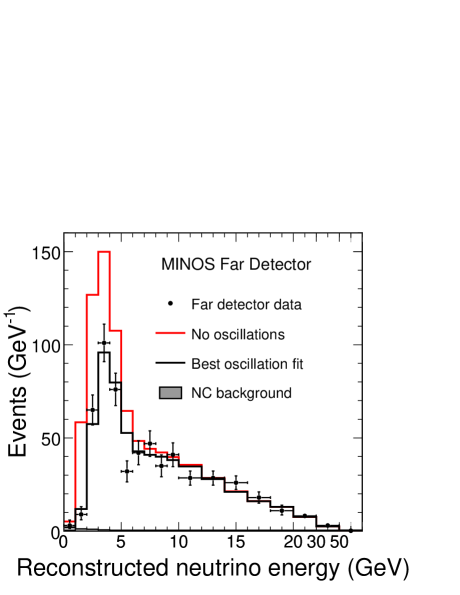
848 events are observed in the Far Detector, while (syst.) are expected in the absence of oscillations. The energy spectrum of events in the Far Detector is shown in Figure 1. The impact of different sources of systematic uncertainty were evaluated by fitting modified MC in place of the data, and the three largest were included as nuisance parameters in the oscillation fit. These are the relative normalization of the Near and Far detectors, the overall hadronic energy scale, and the NC background which are included with penalty terms of 4%, 10.3%, and 50%, respectively. Expected backgrounds in the CC sample are 5.9 NC events, 1.5 CC events, 2.3 events coming from CC interactions in the rock surrounding the detector cavern, and 0.7 events from cosmic rays.
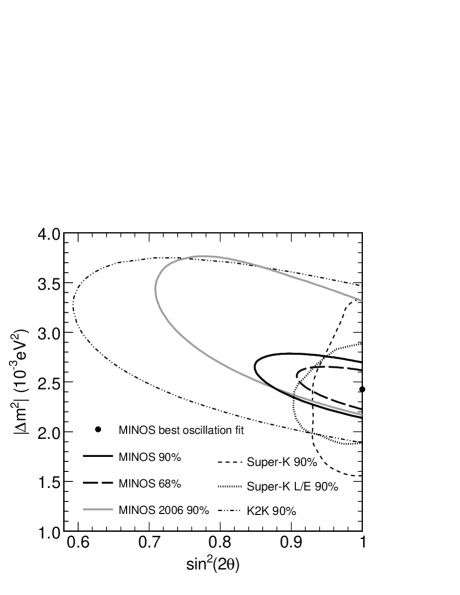
The data are fit using the standard two-generation oscillation formula with constrained to be in the physical region. We obtain eV2 and at 68% CL. At the best fit point the value of is 90 for 97 degrees of freedom. Figure 2 shows the allowed region from this fit compared with the results of previous experiments. If the fit is allowed to go into the unphysical region the best fit value moves to eV2 and with a reduction in of 0.6. We have carried out a Monte Carlo study in which the input true value was that obtained from our constrained fit, and found that 26.5% of unconstrained fits have a best fit with a value of .
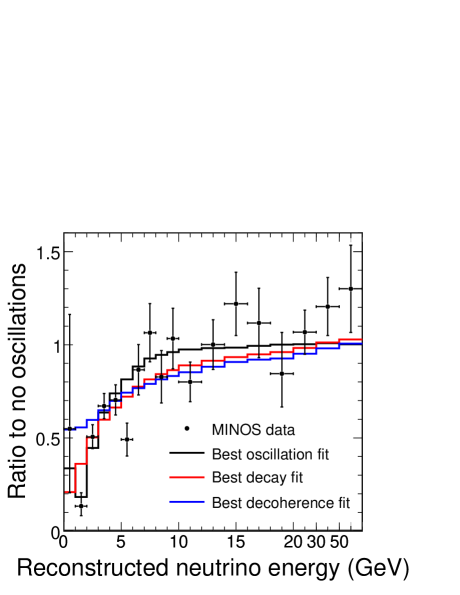
We have also explored how well this data is described by phenomena other than oscillations. In particular we have fit the data to models for neutrino decay Barger:1998xk and decoherence Fogli:2003th . The ratio of the Far Detector data to no oscillations is shown in Figure 3 compared with the results from the best fits to oscillations, decay, and decoherence. The values for the decay and decoherence models are 104 and 123, they are thus disfavored relative to the oscillation hypothesis by 3.7 and 5.7, respectively.
2.2 Neutral Current Analysis
Oscillations into sterile neutrinos would affect the number of neutral current interactions in the Far detector. The goal of the analysis is to look for NC disappearance at the Far detector, and in particular an energy dependent depletion of NC events as evidence for oscillations into sterile neutrinos. The analysis described here is based on POT of data in the Far Detector.
Pre-selection cuts are made for fiducial volume, beam quality, and to remove overlapping events in the high-rate environment of the Near Detector. An event in either detector is then classified as NC if it has a reconstructed shower, is shorter than 60 planes, and does not have a track extending more than 5 planes beyond the end of the shower. With these cuts NC events are selected with 90% efficiency and 60% purity. More information about the NC analysis can be found in Ref. Adamson:2008jh .
In our first examination of NC events in the Far Detector we would like to be as model-independent as possible. To this end we compare our observations with the predictions of the standard picture of oscillations between three active flavors. The NC measurement in the Near Detector is extrapolated to the Far Detector assuming the previous MINOS CC best fit result for the oscillation parameters of eV2, Collaboration:2007zza . In comparing the Far Detector NC energy spectrum with the expectation of standard 3-flavor oscillation physics, one also has to assume some values for the other oscillation parameters. For this analysis eV2, and are taken from combined KamLAND+SNO fits Abe:2008ee . Since CC events will also be classified as NC by this analysis the NC rate in the Far Detector will also be affected by sub-dominant mixing. The data are compared separately to and .
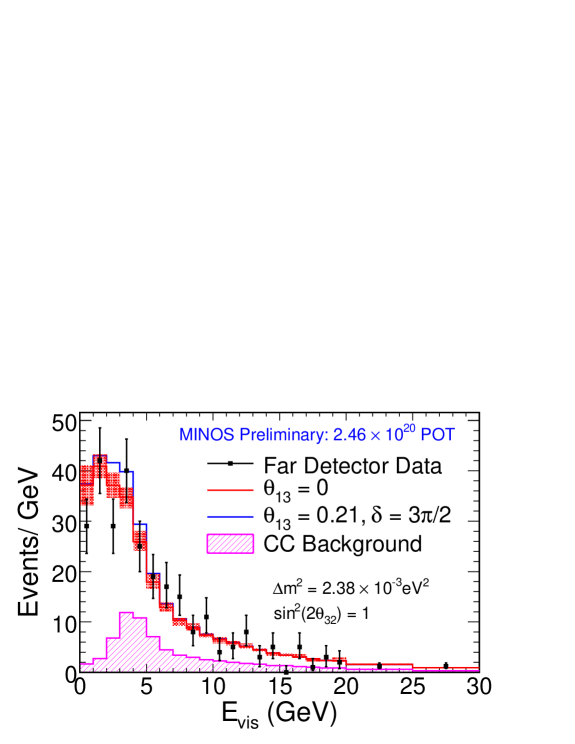
The spectrum of NC events in the Far Detector compared with the expectation under these two oscillation scenarios is shown in Figure 4, together with the contribution to the sample from true CC interactions. The basic statistic for comparison is the number of events in energy ranges 0-3 GeV, 0-5 GeV, and over all energies. Table 1 shows the results of these event rate comparisons for the case, the stated significances are slightly larger for at the Chooz limit. From these data we find that for NC interactions with visible energy less than 3 GeV the fraction that disappear is less than 35% at 90% CL, and that over all energies the fraction that disappear is less than 17% at 90% CL.
| Energy Range | Data | Expectation | Significance () |
|---|---|---|---|
| 0-3 GeV | 100 | 115.16 7.67 | 1.15 |
| 0-5 GeV | 165 | 175.92 10.42 | 0.65 |
| 0-120 GeV | 291 | 292.63 15.02 | 0.10 |
2.3 Electron Neutrino Appearance
Electromagnetic showers can be identified in MINOS by the characteristic topology of their energy deposition. The challenge in MINOS is separating these events from the much more numerous NC interactions which can have similar topologies. identification in both detectors is performed with an artificial neural network. Because of difficulties in modeling hadronic showers at NuMI/MINOS energies there is a large uncertainty on the prediction of the -selected sample in the Near Detector Yang:2007zzt and the observed rate disagrees with the Monte Carlo expectation by around 20%.
The measurement of Near Detector -selected events cannot be immediately extrapolated to the Far Detector since the sample is composed of both NC and CC events, which differ in their extrapolation due to oscillations. Two methods have been developed to independently measure the CC and NC contributions to backgrounds in the Near Detector. These independent, data-driven methods are in good agreement regarding the NC and CC backgrounds. The first technique uses the identified CC sample, removes the muon, and analyzes the remaining hadronic shower as if it were a NC event. The second technique uses the fact that the data set obtained when the magnetic horn is not powered has a very different mix of NC/CC events in the -selected Near Detector sample. The so-called ‘horn-on/horn-off’ method takes advantage of this fact to deconvolute the NC and CC contributions to the measured Near Detector sample.
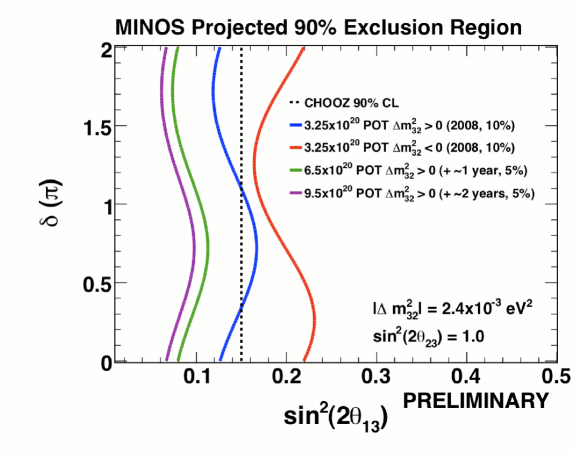
With these measurements in the Near Detector we can now calculate more accurately our expected sensitivity to appearance in a Far Detector measurement. Figure 5 shows the MINOS projected 90% CL exclusion region. At the CHOOZ limit we expect 12 signal events and 42 background events with our current exposure of POT. The reliability of the appearance algorithm as well as the extrapolation technique will be demonstrated on several sideband regions in the Far Detector which are expected to have limited sensitivity to appearance.
3 Acknowledgements
This work was supported by the US DOE and NSF; the UK STFC; the State and University of Minnesota; the University of Athens, Greece; and Brazil’s FAPESP and CNPq. We are grateful to the Minnesota Department of Natural Resources, the crew of the Soudan University Laboratory, and the staff of Fermilab for their contribution to this effort. The author was supported by DOE grant DE-FG02-92ER40702 and would also like to acknowledge the excellent work by the organizers of the Neutrino 08 Conference.
References
- (1) Ahn M H et al. (K2K) 2006 Phys. Rev. D74 072003 (Preprint hep-ex/0606032)
- (2) Ashie Y et al. (Super-Kamiokande) 2004 Phys. Rev. Lett. 93 101801 (Preprint hep-ex/0404034)
- (3) Ashie Y et al. (Super-Kamiokande) 2005 Phys. Rev. D71 112005 (Preprint hep-ex/0501064)
- (4) Michael D G et al. (MINOS) 2006 Phys. Rev. Lett. 97 191801 (Preprint hep-ex/0607088)
- (5) Adamson P et al. (MINOS) 2008 Phys. Rev. D77 072002 (Preprint 0711.0769)
- (6) Ospanov R 2008 Ph.D Thesis, U. Texas-Austin
- (7) Barger V D, Learned J G, Pakvasa S and Weiler T J 1999 Phys. Rev. Lett. 82 2640–2643 (Preprint astro-ph/9810121)
- (8) Fogli G L, Lisi E, Marrone A and Montanino D 2003 Phys. Rev. D67 093006 (Preprint hep-ph/0303064)
- (9) Adamson P et al. (MINOS) 2008 (Preprint 0807.2424)
- (10) Adamson P et al. (MINOS) 2007 (Preprint 0708.1495)
- (11) Abe S et al. (KamLAND) 2008 Phys. Rev. Lett. 100 221803 (Preprint 0801.4589)
- (12) Yang T, Andreopoulos C, Gallagher H and Kehayias P 2007 AIP Conf. Proc. 967 269–275