An Opinion Dynamics Model for the Diffusion of Innovations
Abstract
We study the dynamics of the adoption of new products by agents with continuous opinions and discrete actions (CODA). The model is such that the refusal in adopting a new idea or product is increasingly weighted by neighbor agents as evidence against the product. Under these rules, we study the distribution of adoption times and the final proportion of adopters in the population. We compare the cases where initial adopters are clustered to the case where they are randomly scattered around the social network and investigate small world effects on the final proportion of adopters. The model predicts a fat tailed distribution for late adopters which is verified by empirical data.
keywords:
Opinion Dynamics , Innovation Diffusion , Marketing , SociophysicsPACS:
89.65.-s , 89.65.Gh , 05.65.+b,89.75.-k1 Introduction
Social agents can be mutually influenced by exchanging information on their opinions about a set of issues of interest. This scenario has been studied by a number of Opinion Dynamics models [1, 2, 3, 4, 5, 6, 7, 8]. Some of them suppose opinions to be discrete [4, 5, 6], while others treat opinions as continuous [7, 8]. A third type introduces a dichotomy between internal opinions and discrete actions with dynamical consequences that must not be understated [9, 10, 11, 12]. One should note that opinions studied in those problems can represent political issues or the quality evaluation of some new idea or product [13].
The marketing literature regards products (goods, services or ideas) as new if they are unknown within a particular market [14]. An innovation is defined as a product that is new in each and every market. When an innovation is adopted by consumers, the launcher firm may obtain a competitive advantage for a considerable period of time as legal protection against copies (patents) are usually in place.
The identification of factors leading to a successful innovation in a given market is a question of considerable practical importance. It seems clear that this question may be approached either by delving into issues concerning product launching or by considering the dynamics of innovations adoption [15]. To date the literature on marketing has mainly focused on innovation analysis considering variables under the strict control of the launcher firm. However, we still lack understating of the dynamics followed by innovations adoption, despite the clear relevance of the subject.
In order to describe the process of innovation adoption, practitioners [14, 16, 17] employ a heuristic model, proposed in 1962 by Rogers [18], that summarizes evidence gathered by a number of authors on diverse markets. This model describes the adoption process as following a well defined dynamics with consumers differing in their predisposition to buy. At first, a small number of consumers buys the innovation, sales increase as influence spreads until a saturation level and, finally, the number of new adopters declines as the last consumers with interest on the product are reached [19, 18]. The resulting distribution of adoption times is usually described as being a “normal curve”. Based on these Rogers’ innovation adoption curves, practitioners divide by convention consumers into five groups (segments): innovators, early adopters, early majority, late majority and laggards (late adopters). Each segment is supposed to be composed by homogeneous life-styles which are described following survey studies. Observational studies on innovation diffusion usually postulate these five segments, thus trying to fit consumers into rigidly defined classes [20, 21]. A number of authors, therefore, seek the ad hoc identification of a group of innovative consumers that should correspond to the earliest adopters in the targeted market [22]. The same sort of heterogeneity is also supposed to hold when agent-based models are considered [23].
We propose a simulation of the innovation adoption process without assuming an a priori classification of consumers into segments. In the model we put forward agents assign probabilities to the idea that they should adopt an innovation and then decide accordingly. Probabilities are then updated by observing decisions of neighboring agents. Since the opinion is a continuous variable (a probability) and observations are discrete (adoption of a product), the model is a slightly modified version of the Continuous Opinions and Discrete Actions (CODA) model [10, 11]. The CODA model is modified by introducing dynamic likelihoods that allow the importance of distinct observations to change in time.
In this paper we have used simulations to find adoption curves as an emerging property of the market without the need to rely on the usual ad hoc segments. The resulting curves are shown to be qualitatively similar to Rogers’ normal curves [18], a power law distribution for adopting times is observed for late adopters though.
We have found that consumer expectancies on the time spent by the population to test an innovation determines the final proportion of adopters observed. Additionally, we have studied the dependency of the adopting proportion on the initial distribution of early adopters and on the social network topology. The diffusion process presented here evolves to a state where frozen interfaces separating adopters from non-adopters and preventing further innovation diffusion emerge. We have also compared curves for aggregate adoption as predicted by the model to data from an observational study on the diffusion of a medical diagnostic innovation [24].
This paper is organized as follows. In the next section we propose a variation of the CODA model as a possible explanation to the diffusion of innovations process. In Section 3 we describe the result of simulations on social networks defined by two dimensional regular lattices with periodic boundary conditions and edges rewired with probability . We analyze the cases of random and clustered initial locations for the early adopters. Section 4 presents a non-rigorous comparison of a model prediction with empirical data. Finally, a discussion of our results and further directions are presented in a closing section.
2 The CODA model for the diffusion of innovations
In the CODA model, agents update continuous opinions by observing discrete choices taken by neighboring agents. We consider two choices representing the adoption () or non-adoption () of an innovation. To these binary choices we associate Ising spins (A) or (B). Each agent is provided with a subjective probabilistic opinion assigned to the proposition “ is the best choice that can be made” (and, therefore, a probability of assigned to the proposition “ is the best choice that can be made”). We emphasize that probabilities are employed here in the Bayesian sense, namely, as a subjective belief on the truth of a particular assertion [25].
We suppose that agents always act according to the assertion they believe most likely to be true. The discrete choice is, therefore, a step function of . Namely, if , agent chooses to be an adopter and its state is set to (analogously, a non-adopter is set to state ).
Subjective beliefs (quantified by probabilities) are learned upon social interactions with neighboring agents. Learning comes from the belief that other agents behave rationally, to say, that agents always prefer the option they consider the best. In order to use Bayes theorem [25], we also need a likelihood, that is, the probability associated with the observed choices, assuming that a given assertion ( or ) is true. Consider to be the probability of observing the adoption of the product by a neighbor (), given that is true ( “ is the best choice that can be made”). Similarly, consider to be the probability of observing a neighbor that is a non-adopter (), given that is true.
The belief of agent on at time is encoded into the (posterior) probability updated at every observation of neighboring agents , where stands for the particular sequence of observations made by agent up to interaction . Bayes theorem prescribes how this update can be implemented [26]:
| (1) |
where represents the likelihood of observation given that is true.
Along the lines of [10], rational decisions can be made by looking at log-odds defined as
| (2) |
Log-odds are defined in the interval and can be regarded as a continuous local field over site , the choice of agent being defined by a spin variable .
The Bayesian update of agent belief upon the observation of its social neighbor’s choice, as described by Equation 1, yields the following simple prescription for log-odds:
| (3) |
with
| (4) |
Considering an asynchronous dynamics, at each iteration an agent and one of its neighbors are chosen randomly. Agent observes agent state and updates its field according to Equation 3. Time is measured in terms of the number of iterations averaged over the agents.
To consider that (and, therefore, ) is equivalent to the assumption that both the observation and the observation carry the same weight to the inference process. An observation is in order at this point: since depends only on the sign of , this field can be rescaled as with the dynamics depending only on the ratio .
In the process of diffusion of an innovation the likelihoods are clearly not necessarily equal. The newer an innovation is, the lesser the observation of a non-adopter should weight as evidence against a product [15]. However, the number of adopters of a well valued new product is expected to increase as the innovation becomes progressively better known by the market. Namely, the weight as evidence against an innovation conveyed by the observation of non-adopters () should increase as a product ages.
Suppose, as before, that denotes the probability that a neighbor is an adopter given that it is true that adopting is the best choice that can be made () and that denotes the probability that a neighbor is a non-adopter given that non-adopting is the best choice (). These probabilities should, however, be conditional on the consideration of whether the neighboring agent actually tested the innovation or not.
As adopters have necessarily tested the new product, can be kept constant. Considering , it is possible that a non-adopter has never tried the new product. Hence, let us suppose to be the probability that a neighbor has tested the innovation. We can rewrite the likelihood as , where =“the observed agent tested the innovation”. As the observation of an adopter that has not tested the product is a contradiction we get , where we have assumed that .
The remaining likelihoods can be easily calculated to give:
| (5) |
When is observed () is eliminated by Bayes theorem and Equation 4 holds for , as expected. For , Equation 4 is replaced by
| (6) |
Notice that when , Equation 6 yields Equation 4, as it is expected in the case where an agent assumes that every other agent has tested the innovation. When an agent assumes that the new product has never been tested by anyone, to say, when , we find , also as expected.
The general message is that agents need an estimate of how the proportion of agents that tried the new product changes with time. Obviously, should increase monotonically and a simple assumption would be considering a linear growth from at to at a time . Time can be regarded as the agents estimate for the duration of a period in which a product can be considered as a novelty (novelty period). We should be careful as at would imply, due to the update Equation 1, a certainty that non-adoption is the best choice that can be made. This problem is, however, dealt with by the introduction of log-odds.
Thus we may define a schedule for as
| (7) |

Even if the actual changed in a more complex way, agents could still decide by supposing such a schedule. The main idea here is to provide the agents with a world model as simple as possible. Another possibility would be considering the use of the actual fraction of agents that tested the innovation as an estimate for . This alternative would be, however, rather unrealistic since, in the absence of an external field, agents should only process local information.
3 Simulation results
A series of simulations has been performed to study the variation of the CODA model proposed above. The dynamics has been run until it reaches a stable state around the novelty period duration , when adopters and non-adopters influence each other with equal weight and the dynamics becomes that of the CODA model, with reinforcement of opinions within homogeneous domains. Since the topology of the social network is probably relevant to the dynamics, simulations have been run with a regular square lattice and with a random lattice generated by rewiring links with probability .
Initial conditions have been chosen so that a very small proportion of agents are early adopters (typically, between 0.1% and 1.0%, depending on the number of agents). In order to study the influence of the location of early adopters we have simulated two scenarios: 1. setting random sites as adopters (), while keeping the remaining sites as non-adopters (random). 2. setting a random sequence of neighboring sites as adopters (cluster).
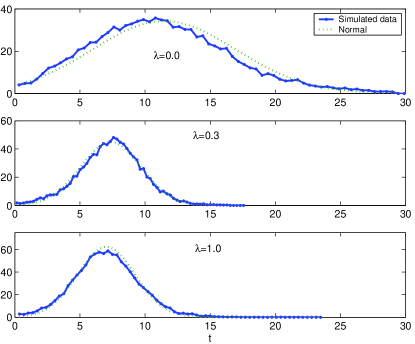
The left panel of Figure 1 shows the distribution of first adoption times for a single run of size agents in a regular lattice () and for . The simulations depicted have been performed with the novelty period duration set to (in lattice steps). Initial adopters have been chosen to be of the population and have been placed at random sites. The fraction of testers has been updated at each iteration following Equation 7. The general shape of the distribution matches, as expected, that of Rogers’ normal. A first period with few people adopting the innovation is followed by a period when adopting is the typical choice and, finally, by a few late adopters being reached. In contrast with the marketing literature, no ad-hoc classification of consumers (agents) into segments has been employed. Except for the initial random choice of a few early adopters, every agent behaves in an homogeneous manner.
While, the normal distribution seems to be a good description of the observed behavior, a closer look shows that late adopters are more common than predicted by Rogers’ proposal. That it is so can be clearly verified in the right panel of Figure 1, where the same curves have been plotted in log-log scales. Finding a fat tailed behavior for long first adoption times actually seems to be more reasonable than a Gaussian decay, as it seems plausible that consumers might still be willing to adopt an innovation many standard deviations away from the mean adopting time. In Section 4 we provide empirical evidence for this assertion.
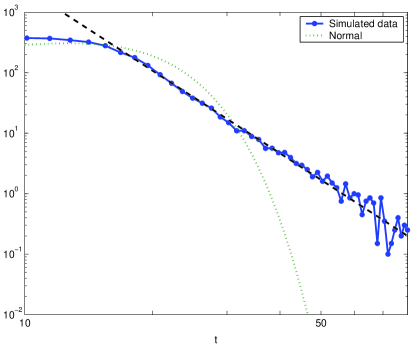
In order to examine still closer large first adoption times, we have run simulations for a larger system of size agents. The distribution of first adoption times for this case is shown in Figure 2, where we have taken . A power law has been fit to the tail, in even clearer contrast to the usual assumption of normality.
Another noticeable feature of Figure 1 is the dependence of first adoption times on the mean distance between agents in a social network. As increases, the social network changes from a regular lattice into a small world network and, finally, into a random graph. A larger implying shorter mean distance and also shorter mean first adoption time.
As opinions are reinforced the diffusion process may freeze before the novelty period duration is actually reached and a fraction of non-adopters may survive. The panels of Figure 3 depict the proportion of adopters for initial adopters spread randomly throughout the network (left panel) and in an initial cluster (right panel). Results shown correspond to averages over runs with one standard deviation wide error bars. In both figures durations of the novelty period are in terms of lattice steps. The final proportion of adopters grows with .

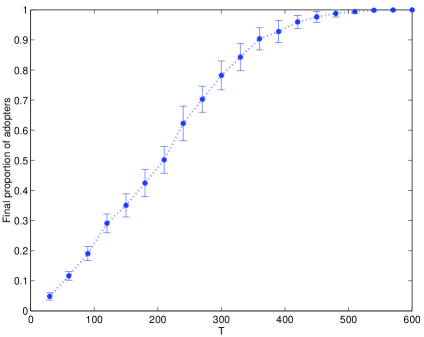
The left panel of Figure 3 shows that even a small rewiring probability leads to noticeable effects on the final proportion of adopters. As grows, the mean distance decreases, diffusion becomes easier, yielding an increased proportion of adopters. For large enough a qualitative change is observed with an abrupt transition from a state dominated by non-adopters to a state dominated by adopters appearing at a specified .
The right panel of Figure 3 shows the case of an initial cluster of adopters in a 2D square lattice (). The process of innovation diffusion from an initial cluster is much slower than in the case of randomly spread adopters. This observation may suggest that in order to reach a larger proportion of adopters it should be favored to launch an innovation at locations as diverse as possible.

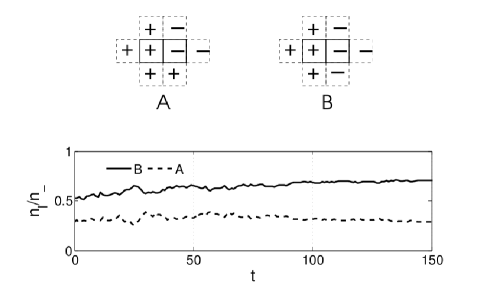
In order to quantify the diffusion process we choose as initial configuration a small cluster of adopters () inside a non-adopting homogeneous phase and study the growth of the adopting phase by coarsening. We proceed by attaching an Euclidian metric to the lattice and computing the average over adopters of their square radius to the center of mass as it evolves with time. The center left panel of Figure 4 depicts the growth law yielded. The growth process can be regarded as a diffusion that slows down following a particular prescription for . The top left panel of Figure 4 shows a domain of adopters as it grows with time. The survival of non-adopters can be explained by the diffusion process becoming progressively slower with time. The bottom left panel of Figure 4 shows the evolution of the modification in the local fields as a non-adopter is observed. For the local field at a site in the center of any heterogeneous neighborhood drifts towards adoption and the domain grows unhindered. The adoption process takes place at interfaces, namely, at non-adopting sites with at least one neighboring adopter. On a 2D regular lattice an interface can be of four types depending on the number of nighboring adopters. We call type a non-adopting site with two neighboring adopters, type when a single neighboring adopter is present, type when there are three neighboring adopters and type when all neighbors are adopters. We define to be the total number of non-adopting sites in interfaces. The number of interfaces of each type is represented by , with . The right panel of Figure 4 shows relative frequencies of the two main kinds of interfaces observed in a 2D regular lattice. For , type interfaces, that represent more than of all interfaces, freeze as both the adopting and non-adopting sites have their local fields reinforced. At , type interfaces freeze as the adopting site field is reinforced and the non-adopting field experiences a vanishing drift. For sites surrounded by homogeneous neighborhoods, local fields increase by mutual reinforcement, homogeneous domains are formed and opinion changes become progressively more difficult with time.
All in all, the model we have proposed may actually suggest two practical product launching strategies. If the main goal is reaching all consumers quickly, launching and communicating tasks have to be as wide as possible throughout a social network. If the goal is instead reaching just a few selected consumers, launching and communicating have to be more localized. It should be noted, however, that launching may fail completely for small and randomly spread agents. The same is not observed if launching is initiated from a cluster, since opinions are mutually reinforced from the beginning, thus adding the virtue of reduced failure risk to the second strategy.
4 Comparison to empirical data
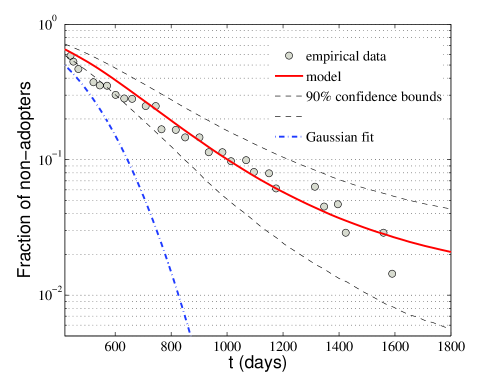
Despite the drastic simplifications we have imposed by our prescriptions of social structure, interaction patterns and agent behavior, in this section we compare a general prediction of the model to empirical data. In particular, as a first test we seek to compare statistics for late adopting times, where we have found a sharp contrast between model predictions and what is generally believed in the innovation diffusion literature. A survey study on the introduction of a new non-invasive medical diagnostic technology (laparoscopic cholecystectomy) in Denmark is described in [24]. This technology was introduced at two Danish hospitals by January 1991, corresponding to of a population with hospitals. By 1998 an adoption rate of ( adopters) was observed in that country. In Figure 5 we show as circles empirical data for the fraction of non-adopters as a function of time (in days). As we are interested solely on late adopters, only times larger than the median ( days) are depicted. The best fit of a cumulative Gaussian distribution with mean equal to and variance estimated for () is shown in the same figure as a (blue) dot-dashed line. In order to perform a non-rigorous comparison to the model we have chosen the lattice step (or the time needed for an average of one iteration per agent to take place) to represent the period of one month ( days). A good heuristic fit to the data has been found by setting parameters to be: (lattice size), (probability of rewiring), (novelty period in months) and a fraction of of innovators. In Figure 5 we show a runs average as a full (red) line. A confidence interval, calculated as the maximum and minimum curves in runs, is also shown as dashed (black) lines. It is important to observe that the general curve observed is independent of the lattice size as the fraction of adopters used is normalized by the number of final adopters for comparison purposes. The fat tail behavior observed in the simulations is statistically significant and satisfactorily matches the data.
5 Conclusions
Before concluding, two further comments are in order. Firstly, agents in the model we have proposed are not fully rational as the inference rules employed are just an approximation of the full Bayesian analysis that should be employed to extract all information contained in the observation of neighboring choices. Allowing likelihoods to change in time can actually be regarded as a step towards the perfect foresight required by agents to be fully rational. Secondly, several discrete models can be seen as special cases of the same dynamics [27], however, the variation of the CODA model we have analyzed belongs to a more general class of models based on Bayesian rules and that includes continuous models [28].
We have been able to show that Rogers’ normal curves can emerge without the need for presuming ad-hoc consumer behavioral heterogeneities, such that the introduction of “opinion leaders”. It is apparent instead that market segments described in the literature on marketing (innovators, early adopters, early majority, late majority and laggards) are unnecessary to explain the emergence of such “normal curves”. While heterogeneous agents can be behind the observed adoption curve, it is clear that the assumption of homogeneous agents can also yield a similar behavior.
An interesting feature of the model we have studied is that the diffusion coefficient decreases with time, vanishing as the system reaches a stable state at . For , the model reproduces the CODA model with extremist clusters emerging. In that case, interfaces between adopters and non-adopters freeze. A number of functional shapes for in Equation 7 can still be tried in further work and might lead to a distinct dynamics for the adopting domain growth.
Although we have chosen to employ the marketing literature parlance, any new idea spreading throughout a model society would be expected to exhibit a similar behavior as we have described, given that no external agent (e.g. an advertising campaign or the possibility of objective experimentation) is introduced. For times , the model predicts that new ideas can spread very easily, however, as novelty effects vanish, domains of supporters and non-supporters and extremely confident opinions emerge.
Finally, a fat tailed distribution for late adopting times emerges in this model. Since it makes sense that a few agents may become late adopters even several standard deviations away from the mean time, we believe that to represent a more accurate description of reality. We test this feature of the model against empirical data to find a statistically significant match. Further investigation on quantitative modeling of the innovation diffusion phenomena is clearly still necessary. Nevertheless, considering the degree of simplification employed, we have found the first results here reported to be encouraging.
6 Acknowledgement
This work has been funded by Fundação de Amparo à Pesquisa do Estado de São Paulo (FAPESP), under grant 2008/00383-9 (ACRM) and by Conselho Nacional de Desenvolvimento Científico e Tecnológico (CNPq), under grant 550981/2007 (RV). We would like to thank Francisco Javier Sebastian M. Alvarez for a number of truly relevant insights.
References
- [1] C. M. Bordogna, E. V. Albano, Statistical methods applied to the study of opinion formation models: a brief overview and results of a numerical study of a model based on the social impact theory, J. Phys.: Condens. Matter 19 (2007) 065144.
- [2] C. Castellano, S. Fortunato, V. Loreto, Statistical physics of social dynamics, Reviews of Modern Physics, (to appear) arxiv:0710.3256.
- [3] S. Galam, Y. Gefen, Y. Shapir, Sociophysics: A new approach of sociological collective behavior: Mean-behavior description of a strike, J. Math. Sociol. 9 (1982) 1–13.
- [4] S. Galam, S. Moscovici, Towards a theory of collective phenomena: Consensus and attitude changes in groups, Eur. J. Soc. Psychol. 21 (1991) 49–74.
- [5] K. Sznajd-Weron, J. Sznajd, Opinion evolution in a closed community., Int. J. Mod. Phys. C 11 (2000) 1157.
- [6] D. Stauffer, How to convince others? monte carlo simulations of the sznajd model., in: J. E. Gubernatis (Ed.), AIP Conf. Proc. v. 690: The Monte Carlo Method in the Physical Sciences: Celebrating the 50th Anniversary of the Metropolis Algorithm, American Institute of Physics, 2003, pp. 147–155.
- [7] G. Deffuant, D. Neau, F. Amblard, G. Weisbuch, Mixing beliefs among interacting agents., Adv. Compl. Sys. 3 (2000) 87–98.
- [8] R. Hegselmann, U. Krause, Opinion dynamics and bounded confidence models, analysis and simulation, Journal of Artificial Societies and Social Simulations 5 (3) (2002) 3.
- [9] D. Urbig, Attitude dynamics with limited verbalisation capabilities, Journal of Artificial Societies and Social Simulations 6 (1) (2003) 2.
- [10] A. C. R. Martins, Continuous opinions and discrete actions in opinion dynamics problems, Int. J. of Mod. Phys. C 19 (4) (2008) 617–624.
- [11] A. C. R. Martins, Mobility and social network effects on extremist opinions, Phys. Rev. E 78 (2008) 036104.
- [12] R. Vicente, A. C. R. Martins, N. Caticha, Opinion dynamics of learning agents: Does seeking consensus lead to disagreement?, arXiv:0811.2099 (2008).
- [13] S. Galam, A. Vignes, Fashion, novelty and optimality: an application from physics, Physica A 351 (2005) 605–619.
- [14] P. Kotler, G. Armstrong, Principles of Marketing, Prentice Hall, 2003.
- [15] B. Wejnert, Integrating models of diffusion of innovations: A conceptual framework, Annual Review of Sociology 28 (2002) 297–326.
- [16] M. Solomon, Consumer Behavior: Buying, Having, and Being, 6th Edition, Prentice-Hall, 2002.
- [17] J. Tidd, J. Bessant, K. Pavitt, Managing Innovation: Integrating technological, market and organization change, 3rd Edition, John Wiley and Sons, 2005.
- [18] E. Rogers, Diffusion of Innovations, 5th Edition, Free Press, New York, 2003.
- [19] F. Bass, A new product growth model for consumer durables, Management Science 15 (1969) 215–227.
- [20] P. Beaudoin, M. Lachance, J. Robitalle, Fashion innovativeness, fashion diffusion and brand sensitivy among adolescents, Journal of Fashion Marketing and Management 7 (1) (2003) 23–30.
- [21] T. Valente, Social network thresholds in the diffusion of innovations, Social Networks 18 (1996) 69–89.
- [22] R. Goldsmith, L. Flynn, Identifying innovators in consumer product markets, European Journal of Marketing 26 (12) (1992) 42–55.
- [23] R. Garcia, Uses of agend-based modeling in innovation/new product development research, The Journal of Product Innovation Management 22 (2005) 380–398.
- [24] P. Poulsen, S. Adamsen, , H. Vondeling, T. Jorgensen, Diffusion of laparoscopic technologies in Denmark, Health Policy 45 (1998) 149–167.
- [25] E. Jaynes, Probability Theory: The Logic of Science, Cambridge, Cambridge University Press, 2003.
- [26] A. O’Hagan, Kendall’s Advanced Theory of Statistics: Bayesian Inference, Vol. 2B, Arnold, 1994.
- [27] S. Galam, Local dynamics vs. social mechanisms: A unifying frame, Europhysics Letters 70 (6) (2005) 705–711.
- [28] A. C. R. Martins, A bayesian framework for opinion updates, arXiv:0811.0113v1 (2008).