Upper limits on the masses of 105 supermassive black holes from HST/STIS archival data 111Based on observations with the NASA/ESA Hubble Space Telescope obtained at STScI, which is operated by the Association of Universities for Research in Astronomy, Incorporated, under NASA contract NAS5-26555.
Abstract
Based on the modeling of the central emission-line width measured over sub-arcsecond apertures with the Hubble Space Telescope, we present stringent upper bounds on the mass of the central supermassive black hole, , for a sample of 105 nearby galaxies () spanning a wide range of Hubble types (E Sc) and values of the central stellar velocity dispersion, (58 419 ). For the vast majority of the objects the derived upper limits run parallel and above the well-known relation independently of the galaxy distance, suggesting that our nebular line-width measurements trace rather well the nuclear gravitational potential. For values of between 90 and 220 the 68% of our upper limits falls immediately above the relation without exceeding the expected values by more than a factor 4.1. No systematic trends or offsets are observed in this range as a function of the galaxy Hubble type or with respect to the presence of a bar. For 6 of our 12 upper limits with our line-width measurements are more sensitive to the stellar contribution to the gravitational potential, either due to the presence of a nuclear stellar cluster or because of a greater distance compared to the other galaxies at the low- end of the relation. Conversely, our upper bounds appear to lie closer to the expected in the most massive elliptical galaxies with values of above 220 . Such a flattening of the relation at its high- end would appear consistent with a coevolution of supermassive black holes and galaxies driven by dry mergers, although better and more consistent measurements for and -band luminosity are needed for these kind of objects before systematic effects can be ruled out.
Subject headings:
black hole physics, galaxies: kinematics and dynamics, galaxies: structure1. Introduction
Supermassive black holes (SMBHs) have now been discovered in the center of a sufficiently large number of nearby galaxies to probe possible links between the masses of SMBHs () and the global properties of their host galaxies. In fact, it has emerged that correlates with the luminosity (Kormendy & Richstone, 1995; Marconi & Hunt, 2003), mass (Magorrian et al., 1998; Häring & Rix, 2004), stellar velocity dispersion (Ferrarese & Merritt, 2000; Gebhardt et al., 2000; Tremaine et al., 2002; Ferrarese & Ford, 2005), light concentration (Graham et al., 2001), and gravitational binding energy (Aller & Richstone, 2007) of the host-galaxy spheroidal component, i.e., the entire galaxy in the case of elliptical galaxies or the bulge of disk galaxies. In light of these findings it is now widely accepted that the mass-accretion history of a SMBH is tightly related through feedback to the formation and evolution of the host spheroid (e.g., Silk & Rees, 1998; Haehnelt & Kauffmann, 2000; Di Matteo et al., 2005), some studies having suggested a link with the mass of the dark-matter halo (Ferrarese, 2002; Pizzella et al., 2005).
The slope and scatter of all these correlations remain quite uncertain (Novak et al., 2006), however, in particular since they are still based on a limited sample of galaxies with reliable that is biased towards early-type systems and that is clustered around a rather limited range of stellar velocity dispersion (), approximately between and . Given the great theoretical interest spurred by these findings, there is a pressing need to acquire better statistics, both in terms of the number of targets and in terms of broadening the range of parent galaxies, in particular towards spiral galaxies.
Secure measurements in external galaxies are traditionally obtained through the modeling of the stellar and/or gaseous kinematics, most often as derived using Hubble Space Telescope (HST) observations in the optical domain. The advent of adaptive-optics systems working at near-infrared wavelengths has led to more stellar-dynamical measurements of from the ground (Houghton et al., 2006; Nowak et al., 2007). Yet, such measurements are still quite expensive, not only because good-quality measurements of the stellar kinematics in the near-infrared require relatively long observations, but also because proper modeling of the stellar kinematics in the immediate vicinity of SMBHs needs robust constraints on the importance of radial orbits and thus additional large-scale observations, possibly with integral-field spectroscopy (Valluri et al., 2004; Cappellari & McDermid, 2005). Water-masers have provided the most accurate extragalactic measurements to date, but such gaseous systems are exceedingly rare (Braatz et al., 1994; Greenhill et al., 2003). The modeling of the nuclear ionized-gas kinematics has also led to accurate measurements (e.g., Barth et al., 2001; Dalla Bontà et al., 2008), and at a relatively cheap cost in terms of observation time compared to stellar-dynamical determinations (e.g., Verolme et al., 2002; Gebhardt et al., 2003). Yet, only an handful of the objects targeted by HST turned out to have sufficiently regular gas velocity fields for the purpose of modeling (Sarzi et al., 2001). Thus, unless a large number of galaxies pre-selected to have regular nuclear gas kinematics (for instance following Ho et al., 2002) is observed with HST if and when the Space Telescope Imaging Spectrograph (STIS) is successfully refurbished, it is unlikely that the number of galaxies with secure measurements will increase dramatically in the near future.
The HST Science Archive already contains an untapped resource that can be used to better constrain the black-hole mass budget across the different morphological types of galaxies, which consists of the vast number of the STIS spectra from which a central emission-line width can be measured. The modeling of this kind of data can indeed lead to tight upper limits on , as first shown by Sarzi et al. (2002). For this reason we started a program aimed at deriving upper limits based on HST spectra for the largest possible number of galaxies and a wide range of morphological types. In this paper we present the results based on a sample of 105 nearby galaxies for which STIS/G750M spectra in the H region and measurements of the stellar velocity dispersion were available from the HST archive and in the literature, respectively. Although we will be able only to set an upper limit on the of our galaxies, the lack of exact measurements will be compensated for by the large number of upper limits when studying SMBH mass-host galaxy relationships.
The paper is organized as follows. In § 2 we describe our sample selection and the measurement of central emission-line width, before briefly describing our modeling. We will then present our results and discuss our findings in the context of the relation between the SBHM mass and central stellar velocity dispersion of the host spheroid in § 3.
2. Data compilation and analysis
2.1. Sample selection and data reduction
In order to assemble the largest possible sample of homogeneous measurements of the central emission-line width, we queried the HST Science Archive for objects with STIS spectra obtained with the G750M grating through either the or the slit placed across the galaxy nucleus, most often at random position angles. This is indeed by far the most common configuration in the archive, which always gives us access to the [N ii], H and [S ii] emission lines. Limiting ourselves to galaxies within 100 Mpc to minimize the impact of the stellar potential on our results, we retrieved data for 177 galaxies spanning the whole range of morphological types. When available, galactic distances were adopted from measurements based either on surface-brightness fluctuations (Tonry et al., 2000; Tonry et al., 2001), Cepheid variables (Freedman et al., 2001) or from Tully (1988). Otherwise we used the weighted mean recessional velocity corrected to the reference frame defined by the microwave background radiation from de Vaucouleurs et al. (1991, RC3 hereafter) to derive the distance to our sample galaxies by assuming , , and . The median distance of the sample galaxies is 21.4 Mpc.
The archival spectra were reduced using IRAF111IRAF is distributed by NOAO, which is operated by AURA Inc., under contract with the National Science Foundation and the STIS reduction pipeline maintained by the Space Telescope Science Institute (Dressel et al., 2007). The basic reduction steps included overscan subtraction, bias subtraction, dark subtraction, and flatfield correction. Different spectra obtained for the same slit position were aligned using IMSHIFT and knowledge of the adopted shifts along the slit position. Cosmic ray events and hot pixels were removed using the task LACOS_SPEC by van Dokkum (2001). Residual bad pixels were corrected by means of a linear one-dimensional interpolation using the data quality files and stacking individual spectra with IMCOMBINE, This allowed to increase the signal-to-noise ratio of the resulting spectra.. We performed wavelength and flux calibration as well as geometrical correction for two-dimensional distortion following the standard reduction pipeline and applying the X2D task. This task corrected the wavelength scale to the heliocentric frame too.
To measure the nuclear emission-line width we generally extracted aperture spectra three () and five pixels wide () centered on the continuum peak, for the and -wide slit cases, respectively. When the spectra were obtained with a 2-pixel binning read-out mode along the spatial direction, we extracted aperture spectra three pixels wide () for the -wide slit (Table 1). The extracted spectra thus consist of the central emission convolved with the STIS spatial point-spread function (PSF) and sampled over nearly square apertures of , or , roughly corresponding to a circular aperture with a radius of , , and , respectively. The wavelength range of our spectra is either 64827054 Å or 6295 6867 Å, depending on whether the G750M grating was used at the primary or secondary tilt. The instrumental FWHM was 0.87 Å ( ) and 1.6 Å ( ) for the and the -wide slit, respectively. The atlas of all the extracted spectra will be presented in a forthcoming paper.
To place our upper limits with the relation, here we consider only galaxies with velocity dispersion measurements in the literature, which were available for 137 objects. We also dropped a further five objects, since upon closer inspection they revealed unrelaxed morphologies. For a number of objects with a sharp central surface-brightness profile, the two-dimensional rectification of the spectrum performed during the data reduction produced anomalous undulations in the flux level of continuum of the very central rows (see KimQuijano et al., 2007, for details). This introduced also artificial fluctuations in the emission-line flux profiles across the nucleus. As constraining the concentration of the nebular emission is key to our modeling (see §2.3), this problem forced us to remove a further eight galaxies from our sample.
2.2. Measurement of the emission lines
In order to derive upper limits on following the method of Sarzi et al. (2002, see also §2.3) we need to measure both the width of the central nebular emission and the radial profile of the emission-line flux, so that we can gauge both the depth of the potential well and the concentration of its gaseous tracer. To side-step the impact of broad and/or asymmetric emission arising from regions much smaller than our resolution limit, we focus on the width of the narrow component of the emission from forbidden transitions and disregard the broad-line emission in our spectra. In the wavelength range of our spectra that means measuring the central width and flux profile of the [N ii] lines since these are usually brighter than the [S ii] lines. The [N ii] doublet also traces the nuclear kinematics better than H, given that this line could be significantly affected by emission from circumnuclear star-forming regions (e.g., Verdoes Kleijn et al., 2000; Coccato et al., 2006).
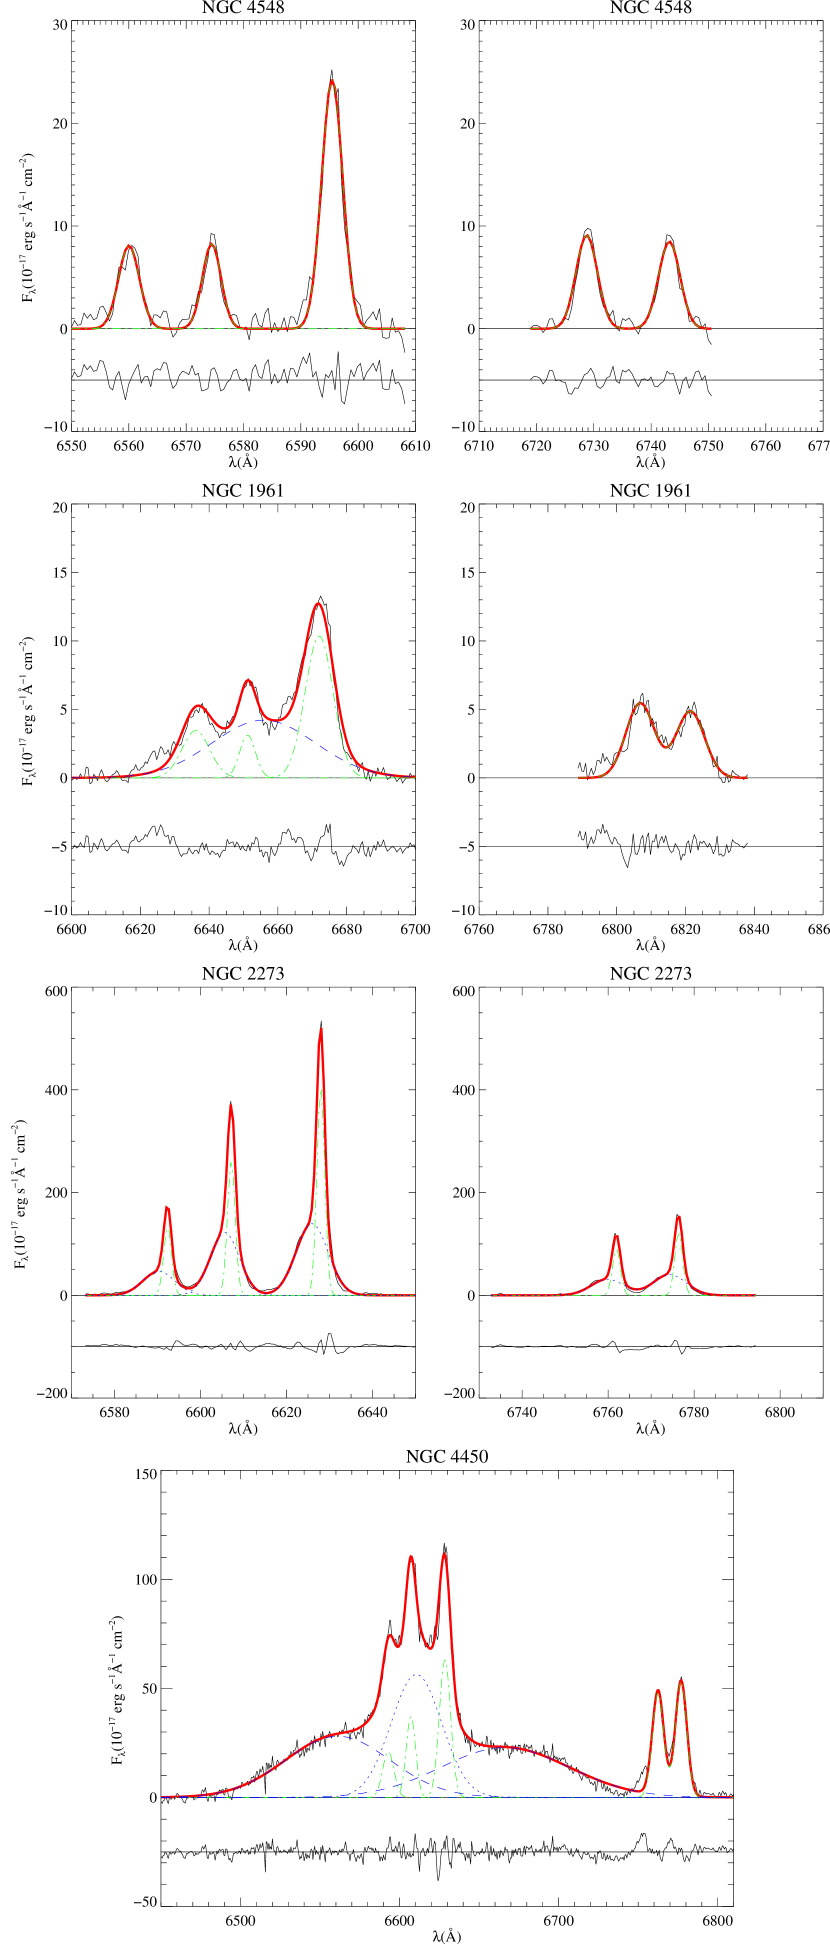
To measure the central width and flux profile of the narrow component of the [N ii] lines we fit our spectra with multiple Gaussians to match both the broad and narrow components of all the observed lines, while describing the stellar continuum with a low-order polynomial. A flux ratio of 1:3 was assumed for the [N ii] doublet, as dictated by atomic physics (e.g., Osterbrock, 1989), and in the presence also of [S ii] emission, both the [N ii] and [S ii] doublets were assumed to share a common line centroid and width. In most cases only one additional Gaussian component was needed in our fits, to describe the H emission from the broad-line region, although in many objects also the forbidden [N ii] and [S ii] lines required double-Gaussian profiles. This allowed us to describe also lines with Voigt profiles, where tests on 18 galaxies showed that our narrowest Gaussian component tend to be only slightly broader than the thermal component in the Voigt profiles, generally by less than 20%. The extra Gaussian in the [N ii] and [S ii] lines was also used to isolate the contribution of blue- or redshifted wings. To help deblending the H+[N ii] region in some cases we followed Ho et al. (1997) and assigned to both the [N ii] lines and the narrow H emission the line profile that was predetermined by fitting the [S ii] lines. The best-fitting Gaussian parameters were derived using a non-linear least-squares minimization based on the robust Levenberg-Marquardt method (e.g., Press et al., 1996) implemented by Moré et al. (1980). The actual computation was done using the MPFIT algorithm222The updated version of this code is available on http://cow.physics.wisc.edu/craigm/idl/idl.html implemented by C. B. Markwardt under the IDL333Interactive Data Language is distributed by Research System Inc. environment. In objects with conspicuous stellar absorption features that cannot be accounted for by our minimisation routine we checked our results against the line-width and flux measurements obtained with the GANDALF software444The updated version of this code is available at http://www.strw.leidenuniv.nl/sauron/software.html of Sarzi et al. (2006), adopting either very young (300 Myr) or old (10 Gyr) stellar population templates. In most cases the measurements agreed within the errors, except for IC 342 and NGC 7331 where the H absorption line is particularly prominent. For these galaxies we adopted the GANDALF values. Finally, in defining our detection thresholds we compared the amplitude () of the best-fitting line profile to the noise level () in the residuals of the continuum fit, adopting as detected only those emission lines for which the ratio was larger than . Figure 1 shows a few sample spectra illustrating the various fitting strategies explained above. A more detailed description of our emission-line measurements for each of our sample galaxy will be presented with our spectral atlas.
In 14 galaxies the nebular emission was too faint for it to be detected given the quality of the corresponding spectra, and were consequently dropped from our sample. Three further galaxies had also to be discarded because their line profile could not be well represented as a simple sum of Gaussian components. Finally, two galaxies were rejected because the radial profile of the flux of the [N ii] lines was strongly asymmetric and not suitable for modelling. Table 1 lists the final sample of galaxies analyzed in this paper, which comprises of 105 galaxies which 28 () are classified as ellipticals, 20 () are lenticulars, and 57 () are spirals. The central velocity dispersion of the ionized-gas component and the size of the aperture we measured are also given in Table 1. Prior to modeling, the instrumental resolution corresponding to the adopted apertures (17 and 32 for the and slit widths, respectively) was subtracted in quadrature from the observed line-width values to obtain the intrinsic gas velocity dispersion.
Table 2 lists the 74 rejected galaxies.
2.3. Modeling the central line width
Assuming that the width of the nuclear emission traces the depth of the gravitational well, we can derive stringent upper bounds on the mass of the SMBHs in our sample galaxies thanks to the exquisite spatial resolution of HST. Although the stellar contribution to the gravitational potential could affect such estimates, the fundamental reason for which a lower limit on can not be set from such a simple measurements is that the observed line-broadening may, in principle, be entirely due to additional contributions such as non-gravitational forces (e.g., gas pressure or magnetic forces).
In this study we follow the procedure described in Sarzi et al. (2002), where a detailed description of the method can be found. In short, we assume that the observed line-broadening arises from the motion of ionized-gas in a coplanar thin inner disk of unknown inclination, where the gas moves in circular and Keplerian orbits around the putative SMBHs. For a given radial profile of the nebular emission, perfectly edge-on disks lead to the broadest lines and therefore to a lower estimate of . Conversely, the value needed to explain the observed line width diverges to infinity as we approach perfectly face-on configurations. Fortunately, such extreme orientations are statistically rare. Since randomly oriented disks have uniformly distributed , it is possible to derive upper and lower limits on by simply considering models with nearly edge-on (, ) and face-on (, ) orientations, respectively, comprising 68% of the distribution of values that can explain a given line width (e.g., Sarzi et al., 2002).
In our models we could disregard the effect on the unknown position angle of the disk since we extracted our spectra in nearly square apertures, and thus assumed that the STIS slit was placed along the disk major axis.
Clearly, for a given disk orientation the concentration of the gas tracer impacts heavily on the value needed to explain a given line width, to the point that no lower limit on can be set when the gas profile is unresolved. This is why the intrinsic emissivity distribution of the gaseous disk has to be constrained from the data. As in Sarzi et al. (2002), we assumed an intrinsically Gaussian flux profile centered on the stellar nucleus, which makes it easier to match the observed flux profile while accounting for instrumental effects. The choice of a Gaussian parametrization is also conservative, since cuspier functions would have led us to estimate smaller . For instance, adopting an exponential profile for the subsample of objects studied also by Sarzi et al. (2002) leads on average to a decrease for the estimates.
In this work we disregarded the contribution of the stellar potential, which would lead to tighter upper limits on . In principle, it is possible to estimate the stellar mass contribution by deprojecting the stellar surface brightness observed in the STIS acquisition images while assuming spherical symmetry and a constant mass-to-light ratio (Sarzi et al., 2002). In practice, however, this would only be feasible for a limited number of objects in our sample, given the limited quality of the acquisition images for most of our sample galaxies, and the pervasive presence of dust absorption features, in particular in spiral host galaxies. Still, the impact of the stellar potential is unlikely to change dramatically our estimates, in particular for the upper limits derived for nearly face-on configurations. For their sample of nearby galaxies (at Mpc), Sarzi et al. (2002) found that including the stellar mass contribution reduced the median value of the upper limits by just . For the median distance our sample (21.4 Mpc) the stellar mass contribution to our upper-limits would be . Similar considerations would apply to the sensitivity limit of our experiment. In the case of the Sarzi et al. (2002) sample this value was found to be on average M⊙, which is well below most of the limits derived here and comparable to the smallest limits obtained for the closest objects in our sample.
To conclude, we note that the range spanned by the two values delivered by our Keplerian-disk model includes also that would be estimated under radically different assumptions. For instance, the gaseous disk model at is equivalent to that of an isotropic gas sphere in hydrostatic equilibrium (see Sarzi et al., 2002, for details). The estimates we derived for and are listed in Table 1 for the sample galaxies. Although strictly speaking both values should be regarded as upper-limits, we will refer only to the estimates as upper limits, hereafter.

3. Results and discussion
We have determined the upper and lower confidence limits for the for randomly orientated disks for 105 galaxies with measurable spectra and stellar velocity dispersions available in the literature. For 19 galaxies of the sample, either measurements or upper limits based on resolved kinematics were available (Table 1). Fig. 2 shows how such measurements compare with our limits, once our values are rescaled accordingly to the distances adopted in these studies. Our upper-limits are consistent within 1 with such estimates, except for NGC 3031 and NGC 4261. Furthermore no systematic offset appears when our upper limits are compared with similar upper bounds in the literature, rather than definite measurements. A particularly complex blend of narrow H+[N ii] and broad H lines may have biased our estimates in NGC 3031.
To place our limits on the various versions of the relation, we applied to the aperture correction of Jørgensen et al. (1995) to the literature values of stellar velocity dispersion in order to obtain the values and and that would have been measured within a circular aperture of radius and , respectively. The effective radii of the spheroidal components of our sample galaxies were taken from various sources in the literature (Table 1) except for few disk galaxies for which was obtained from our own photometric decomposition (following Méndez-Abreu et al., 2008) of the -band images retrieved from the archive of the Two Micron All Sky Survey (Skrutskie et al., 2006, hereafter 2MASS).
In Figs. 3 and 4 we compare our upper limits to the relation, as given by both Ferrarese & Ford (2005) and Lauer et al. (2007), initially to establish the validity of our method over a wide range of velocity dispersions. Our upper bounds show a well defined trend with both and , running closely above the and relations. In the plane a Spearman’s rank coefficient of 0.9 suggests the presence of a correlation at 9 confidence level whereas a Pearson correlation coefficient of 0.8 supports a linear fit to the logaritmic data, which returns a slope of . At first glance such a value would imply a shallower trend than found by Ferrarese & Ford (2005) and a slope closer to that of the Lauer et al. (2007) relation, but we need to keep in mind that the derived slope could be significantly affected by just a few outliers. In particular, for small value of our upper-limits could be biased owning to a larger stellar contribution to the gravitational potential in small and distant galaxies. On the other hand, we found that our limits appear to parallel particularly well both versions of the relation for , whereas at lower and higher a substantial fraction of our limits lie either considerably above or almost on top of the relation, respectively.
In the following sections we better quantify and interpret these first considerations.
3.1. Main trend in the sample
In the interval between and our upper limits appear to correlate particularly well with , paralleling the relation. In this region a value of 0.8 for the Spearman’s rank correlation coefficient suggests the presence of a correlation at a 7- confidence level, whereas a Pearson coefficient of 0.8 indicates that the logarithm values of our upper limits and are very likely to be linearly correlated. A linear fit in the plane delivers a best-fitting slope of for our upper limits, compared to the slope of the Ferrarese & Ford (2005) relation, with a scatter of 0.39 dex (Figs. 5a). In the interval we have 66 upper limits, which have a median 2.7 times higher than the expected value (Fig. 5c). These upper-limits can range from falling short of the expected values by a factor 3.7 to exceeding them by a factor 17.3, although 68% of them actually do not top the expected values by more than a factor 4.1 and fall immediately above the relation. For comparison, by fitting our upper limits in the plane we obtain a slope of , very close to the value of found by Lauer et al. (2007). In fact, the parallel trend of our upper limits holds as far as , with a Spearman’s rank coefficient of 0.8, a Pearson linear correlation coefficient of 0.8 and a linear slope of .
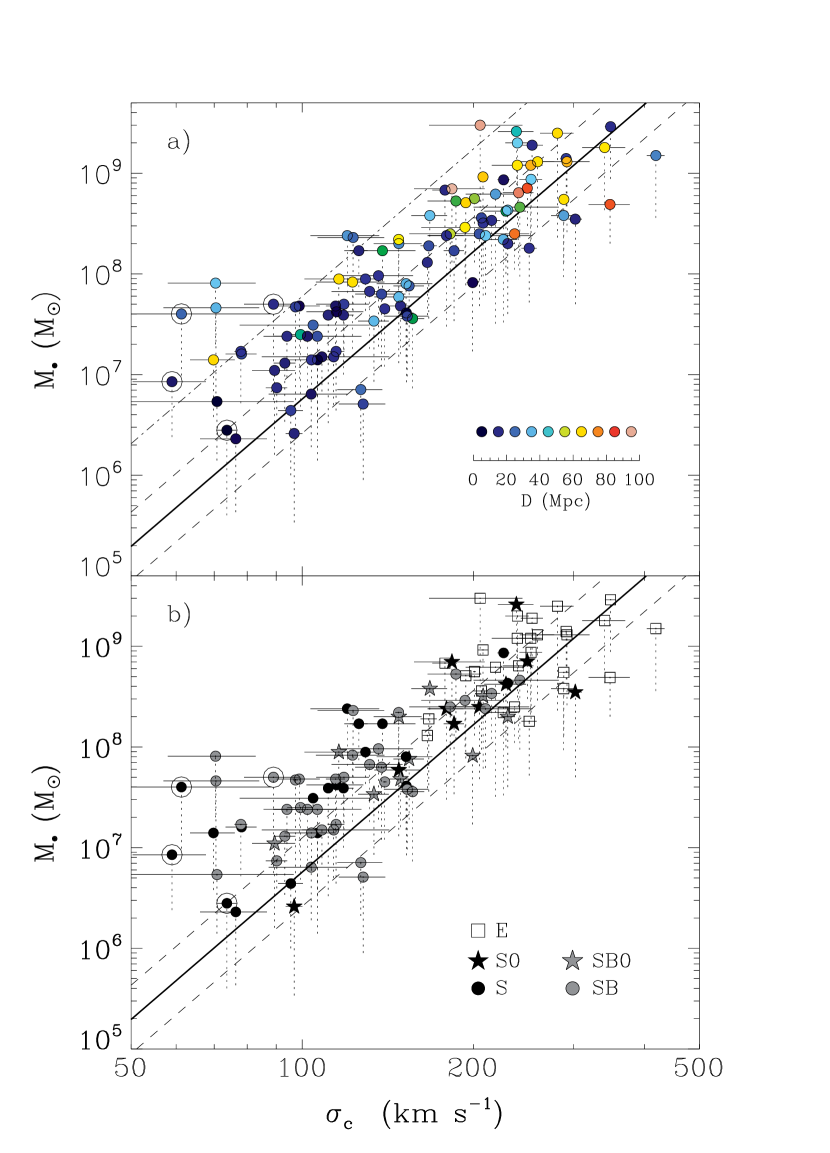
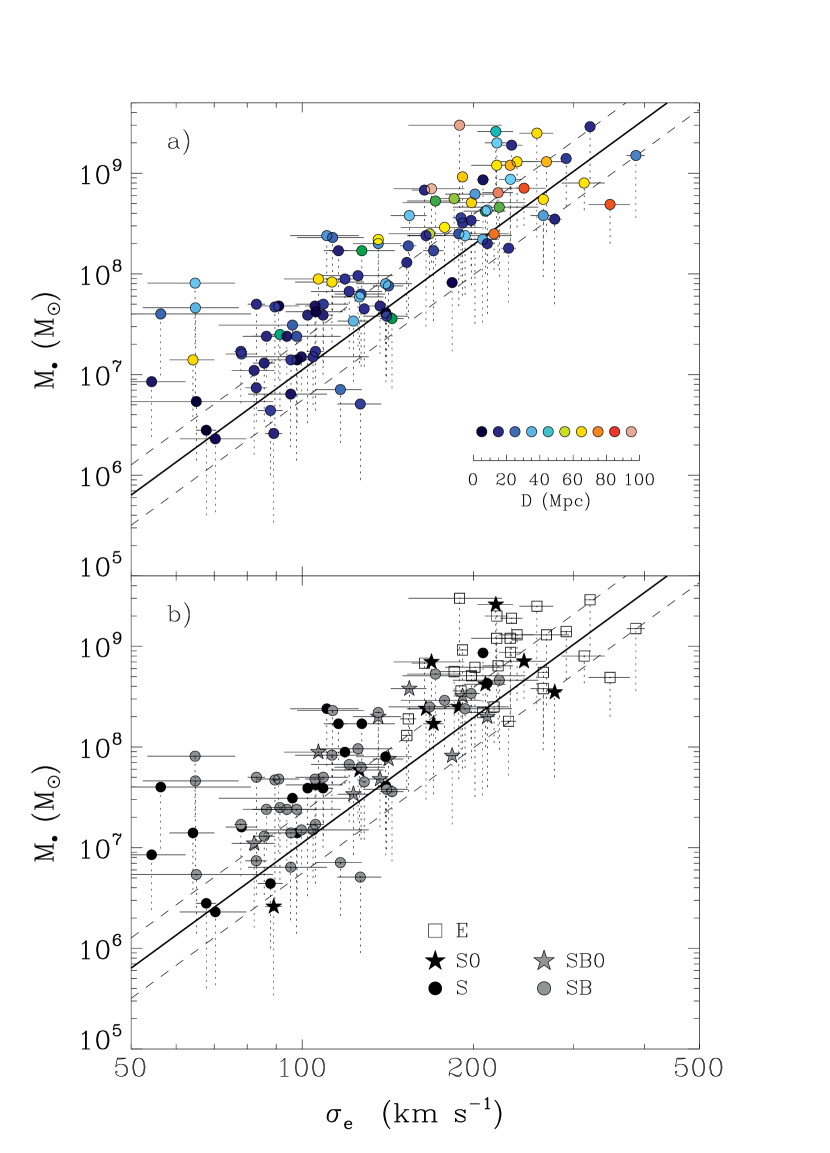
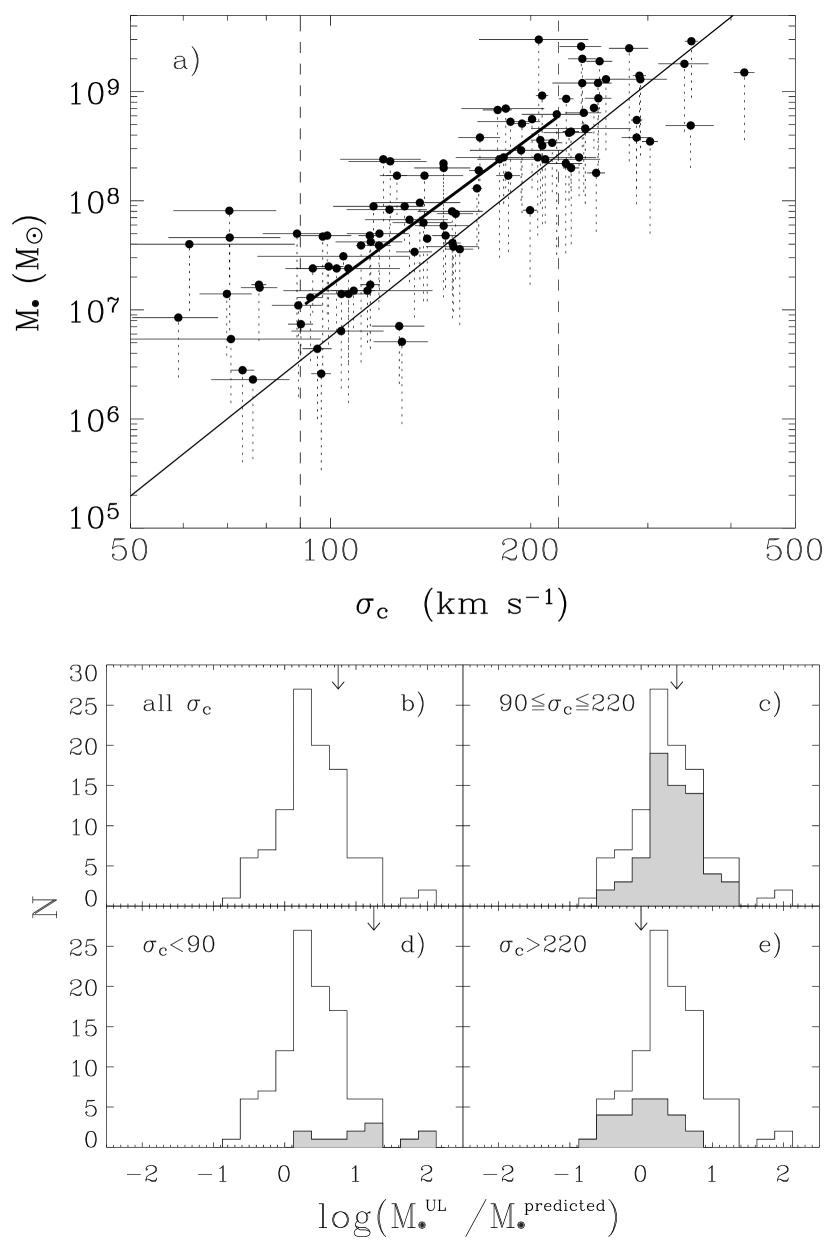
Fig. 3a shows that such a trend holds independent of galactic distance – objects as far away as 60 Mpc appear to run parallel to the relation. In particular, the objects at and below 20 Mpc are well distributed. In fact, if in this range of we perform separate linear regression for the three different populations of upper limits with Mpc, Mpc and Mpc, we find slope values that are consistent within the errors, namely of 4.050.51, 3.511.01, 4.521.14, respectively. This finding shows that the observed nuclear line widths do not simply trace an increasingly larger subtended stellar mass, as galaxies with progressively larger stellar velocity dispersions are found preferentially at larger distances. Instead, the fact that our upper limits scale in the same way with as precisely-measured determinations indicates that the nuclear emission we measured arises predominantly in regions of the gravitational potential that are dominated by the influence of the central SMBHs.
This is not completely unexpected given that a number of HST observations revealed that the narrow-line regions of active nuclei appear to be quite concentrated with scales less than 50 pc, much more so than the underlying stellar density profile (see, e.g., Ho, 2008). Most recently, Walsh et al. (2008) have mapped the behavior of the narrow-line region for galaxies observed with multiple-slit STIS observations. They found that all galaxies of their sample exhibit a centrally peaked surface-brightness profile, with the majority of them further showing a marked gradient of the emission-line widths within the sphere of influence of the central SMBH. The high degree of concentration of the gaseous tracer of the gravitational potential is what allows us to closely trace the presence of the SMBH even in objects where formally its sphere of influence is not resolved. This is similar to the case of the stellar-dynamical estimates of for M32, which have not significantly changed when moving from ground- to space-based observations (e.g., Kormendy, 2004, and references therein) due to the exceptional concentration of its stellar light profile. Actually, that fact that our upper limits run so closely to the relations also suggests that non-gravitational forces do not generally contribute much to the observed line widths (unless for some reason their importance scales with ), although their role cannot be firmly excluded on a single-case basis.
Fig. 3b also shows that in the range the upper limits derived in galaxies of different Hubble types lie neither closer nor further away from the relation, although only a relatively small number of elliptical galaxies falls in this interval. Similarly, even though only of the spiral and lenticular galaxies in this region are unbarred we do not notice any systematic trend with the presence of a bar, unlike what was found by Graham (2008).
Since our upper limits appear to trace quite closely the expected values for , we can take advantage of the significant number of galaxies in our sample to understand whether the objects that within the present range appear to show remarkably large or small upper-bounds are in fact exceptional. Assuming that our limits bracket symmetrically the expected values of and that our upper bounds lie 2.7 times above the relation, with the aid of a Monte Carlo simulation we found that of our upper limits should lie above the relation by more than 3 times its scatter (adopting 0.34 dex by Ferrarese & Ford, 2005), while of them should lie below it by more than its scatter. As Fig.3 shows, only four out of 66 objects in the range fall that far above the relation, with an equal number falling below it by more than its scatter. Both sets of objects correspond to of the galaxies in the considered range.
The previous considerations strongly argue against the presence of exceedingly large (i.e., above the relation by more than 3 times its scatter) in nearby galactic nuclei, and further suggests that galaxies with considerably smaller -budgets (i.e., below the relation by more than its scatter) may be particularly rare. The presence of undermassive SMBHs in field galaxies have been suggested for instance by Vittorini et al. (2005), who argued that in a low galactic-density environment the growth may be hampered by the lack of gaseous fuel. A population of undermassive SMBH was discovered also by Volonteri (2007) in her simulations of the last stages of black-hole mergers, when the binary experiences a recoil due to asymmetric emission of gravitational radiation. According to Fig. 4 of Volonteri (2007) up to of the galaxies with could contain undermassive SMBHs, with less than the expectected . Unfortunately, only a handful of objects in our sample are massive and close enough (e.g., for and Mpc) to allow us to probe such a low regime, where our simulations indicate that we should expect only % of our upper-limits. Furthermore, although the wide range of Hubble types and of values for spanned by our sample galaxies suggest these are fairly representative of the general properties of the nearby population, our sample is almost certainly incomplete, in particular as we probe the low-end of the luminosity function where most galaxies are found. Our constraints should therefore be regarded with caution.
3.2. The lower end of the relation
At small ( ) half of our upper limits systematically exceed the expected values by 3 times the scatter of the relation. They are in average larger by more than a factor 40 (Fig. 5d), consistent with previous works on much more smaller samples (Sarzi et al., 2002; Sarzi, 2004; Verdoes Kleijn et al., 2006). They are hosted by NGC 3021, NGC 4245, NGC 5347, NGC 5427, NGC 5879, and UGC 1395, which are late-type spirals with different degrees of nuclear activity, as measured by Ho, Filippenko, & Sargent (1997, see Table 1).
We have considered different possibilities related to the measurement and modeling of the [N ii] emission line to explain the high values of found in these 6 objects. For instance, the presence of broad or asymmetric components in our spectra could affect the width of the narrow component of the [N ii] lines that we measured and consequently the upper limits giving larger masses. A similar bias would be introduced if the extent of the flux profile were to be systematically overestimated. Blue asymmetries are observed in the top outliers NGC 5347 and NGC 5427, which are also part of the sample of active galactic nuclei studied by Rice et al. (2006), who investigated the resolved kinematics of their narrow-line region with STIS spectra and first reported the presence of blue wings in the [S ii] lines. In our fits, however, the contribution of such additional features was isolated using double Gaussian profiles. As regards the flux profile of the [N ii] doublet of the small- outliers, these are not systematically shallower than the other galaxies following the relation in the same range. Therefore, the upper limits that we have calculated are not biased by either of these effects.
To explain the largest upper limits found at low values we also considered the impact of the presence of a nuclear star cluster (NC), and in general that of a larger stellar contribution due to a greater distance. NCs are massive stellar clusters coincident with the galaxy photocenter (Côté et al., 2006) that are found in about of late-type spiral galaxies (Böker et al., 2002). Their mean effective radius is pc (Böker et al., 2004), small enough for them to be completely enclosed within the central aperture of our spectra. Ferrarese et al. (2006) found a different relation for NCs, with similar slope but a normalization that is larger by roughly an order of magnitude than that the one found for SMBHs. The presence of NCs in our low- outliers could therefore explain why they show such high central mass concentrations as indicated by their high values. To assess the incidence of NCs in the sample galaxies with we analyzed their surface-brightness radial profile obtained with the IRAF task ELLIPSE on the STIS acquisition images. For half of the low- outliers we could recognize the presence of a NC (NGC 3021, NGC 4245, and NGC 5879). On the other hand, we could identify a NC only in one (NGC 4212) of the six galaxies () which run close to the relation (IC 342, NGC 2685, NGC 2748, NGC 3982, NGC 4212, and NGC 5194). The presence of a NC in the galaxies at the low- end of our sample is shown in Fig. 3, and in the case of NGC 3021 and and NGC 5879 it was already known (see Scarlata et al., 2004; Seth et al., 2008, respectively). If our limits trace indeed the dynamical signature of a NC in these nuclei, better data and more detailed modelling (e.g., Barth et al., 2008) would be required to disentagle the contribution of the NC and SMBH to the total mass budget. As regards the distance of the low- outliers, although we can only rely on distances inferred from their recessional velocities it is significant that half of them (NGC 5347, NGC 5427, and UGC 1395) are found beyond 30 Mpc, whereas all the other low- galaxies are significantly closer, including those for which our upper limits lie well within 3 times the scatter of relation.
These findings suggest that part, if not all, of the exceedingly large values we found at the low- end of the relation could be ascribed to a more significant stellar contribution to the gravitational potential. This is either because of the presence of a nuclear stellar cluster (in NGC 3021, NGC 4245, and NGC 5879) or due to a larger galactic distance (for NGC 5347, NGC 5427, and UGC 1395) than otherwise required to trace the relation at these regimes. Therefore, we presently do not need to invoke either non-gravitational forces (see Sarzi et al., 2002) or a population of more massive SMBHs (see Greene & Ho, 2006) to explain the observed flattening of the relation at low values.
3.3. The upper end of the relation
At high ( ) our upper limits nicely bracket the relation (Fig. 5e) and most of them are consistent with its scatter (Fig. 3). In fact, only four objects (; NGC 2911, NGC 4552, NGC 4594, and NGC 5077) fall above the relation by more than its scatter, with the same number of galaxies falling as far below the relation (NGC 3998, NGC 4278, NGC 6861, and UGC 1841). These outliers do not stand out from the rest of the objects with for any obvious property such as morphology, nuclear activity or distance. This behavior is suggestive of an actual flattening of the high-mass end of relation, in particular considering that in the most massive and radio-loud galaxies the ionized-gas velocity dispersion can show a significant excess over a purely gravitational model (e.g., Verdoes Kleijn et al., 2006)555In fact, for the two radio-loud galaxies in our sample that were also studied by Verdoes Kleijn et al. (NGC 383 and UGC 7115) the derived upper limits lie above the relation.
The flattening at high- values is less evident when our upper limits are compared to the shallower relation of Lauer et al. (2007), but is nonetheless present upon closer inspection. In particular, excluding objects with where the impact of the stellar potential on our estimates could be more important, we found a systematic flattening in the main trend of our upper limits as the high- end of the plane is progressively populated. Specifically, whereas a linear fit to objects with yields a slope of (§3.3), extending this range to , and up to the maximum value in our sample of 386 results in best-fitting values of , and , respectively.
This finding would be in agreement with the predictions of semi-analytic models for the coevolution of SMBHs and galaxies at the highest end of the mass spectrum, whereby galaxies and SMBHs grow mainly via gas-poor, dry mergers (Schawinski et al., 2006). Yet, the behavior of relation in this regime is still under debate. In particular, the limited number of galaxies with reliable measurement in the range M⊙ are actually consistent with a steepening of the relation (e.g., Wyithe, 2006; Dalla Bontà et al., 2008). Furthermore, the cutoff at of the local velocity dispersion function (Seth et al., 2008) implies either that SMBHs with M⊙ are extremely rare or that if they exists their host galaxies should lay considerably above the present relation. In fact, at these regimes Lauer et al. (2007) argue that the stellar luminosity is better suited than to trace . The relation should steepen at its high- end if Lauer et al. arguments are correct, since the observed saturates for the most massive of ellipticals while considering increasingly large values of .
Although our results suggest a flattening of the relation, we need to keep in mind that systematic effects related to the measurement of the bulge properties may be significant at the high- end of the plane. In particular, the aperture correction for the stellar velocity dispersion may be both more important and more uncertain for the most massive of ellipticals than for smaller elliptical and lenticular galaxies. Indeed, giant ellipticals tend to have shallower central surface brightness profiles than their less massive counterparts, which makes the aperture correction more sensitive to the quality and spatial coverage of the stellar kinematics and to uncertainties on the value of the galaxy effective radius, . Incidentally, measurements or are also generally less accurate for giant ellipticals, due the presence of extended stellar halos. Ideally, rather than one would like to have a quantity that is more closely connected to the stellar mass, such as the total -band luminosity, which is also known to relate to (Marconi & Hunt, 2003), or a direct measurement of . Obtaining the -band luminosity of our sample galaxies would require much deeper images than the available 2MASS data, whereas properly measuring requires integral-field observations, such as those derived in the case of the SAURON survey (Emsellem et al., 2007).
3.4. Summary
Owing to the exquisite spatial resolution of HST and to the concentrated character of the ionized-gas emission in low-luminosity AGNs, we have been able to set tight upper limits on for a sample of 105 nearby galaxies () using STIS/G750M spectra. This sample spans a wide range of Hubble types (with 54% of spirals) and includes objects with published values for their central stellar velocity dispersion . Our main findings are:
-
•
Independent of the galaxy distance, our upper limits run parallel and above the relation, in particular for values of between 90 and 220 . The median of the 66 upper limits in this regime exceeds the expected value by a factor 2.7, with 68% of our upper limits falling immediately above the relation and without exceeding the expected values by more than a factor 4.1.
-
•
That our nebular line-width measurements trace rather well the nuclear gravitational potential, makes large samples of upper-limit measurements useful in constraining the frequency of objects with exceedingly low or high values of and in probing the black-hole mass budget across the entire Hubble sequence.
-
•
No systematic trends or offsets are observed in this range as a function of the galaxy Hubble type, or with respect to the presence of a bar. Furthermore, no evidence was found to suggest that the largest or smallest upper limit in the range between 90 and 220 are actually bracketing exceptionally high or low values of . Thus, galaxies with exceedingly high budgets must be very rare.
-
•
For values below 90 half of our upper limits systematically exceed the expected values by more than a factor 40, consistent with previous work on much smaller samples.
The line-width measurements for such low- outliers are most likely affected by the stellar contribution to the gravitational potential, either due to the presence of a nuclear stellar cluster or because of a greater distance compared to the other galaxies at the low- end of the relation, for which our upper limits are closer to the expected values.
-
•
At the opposite end of the relation, for values of above 220 , our upper bounds appear to lie much closer the expected in the most massive elliptical galaxies, even falling below the relation. This flattening is less evident when our upper limits are compared with the shallower relation by Lauer et al. (2007), but is nonetheless present upon closer inspection. In particular, excluding objects with , we found a systematic flattening in the main trend of our upper limits as the high- end of the plane is progressively populated.
Although such a flattening of the relations at its high- end would appear consistent with models for the coevolution of supermassive black holes and galaxies driven by dry mergers, we caution that better and more consistent measurements for either the -band luminosity or the integrated value of the stellar velocity dispersion within the bulge effective radius (both better tracers of the bulge mass than ) are needed before systematic effects can be ruled out.
Acknowledgments. We acknowledge the anonymous referee for his/her many comments that improved our manuscript. We are indebted with James Binney, Stéphane Courteau, Sadegh Khochfar, Lorenzo Morelli, Kevin Schawinski, and Massimo Stiavelli for many useful discussions and suggestions. We are also indebted with Jonelle Walsh and her collaborators for sharing with us the results of their work prior to publication. We thank Jairo Méndez Abreu for the GASP2D package which we used for measuring the photometric parameters of some of the sample galaxies. We acknowledge the grant CPDA068415/06 by Padua University, which provided support for this research. AB is grateful to the University of Hertfordshire for its hospitality while this paper was in progress. This research has made use of the Lyon-Meudon Extragalactic Database (LEDA), NASA/IPAC Extragalactic Database (NED), and the Two Micron All Sky Survey (2MASS).
References
- Aller & Richstone (2007) Aller, M. C., & Richstone, D. O. 2007, ApJ, 665, 120
- Andredakis & Sanders (1994) Andredakis, Y. C. & Sanders, R. H. 1994, MNRAS, 267, 283
- Atkinson et al. (2005) Atkinson, J. W., et al. 2005, MNRAS, 359, 504
- Baggett et al. (1998) Baggett, W. E., Baggett, S. M., & Anderson, K. S. J. 1998, AJ, 116, 1626
- Balcells et al. (1995) Balcells, M., Morganti, R., Oosterloo, T., Perez-Fournon, I., & Gonzalez-Serrano, J. I. 1995, A&A, 302, 665
- Barth et al. (2002) Barth, A. J., Ho, L. C., & Sargent, W. L. W. 2002, AJ, 124, 2607
- Barth et al. (2001) Barth A. J., Sarzi M., Rix H.-W., Ho L. C., Filippenko A. V., & Sargent W. L. W., 2001, ApJ, 555, 685
- Barth et al. (2008) Barth A. J., Strigari L. E., Bentz M. C., Greene J. E., Ho L. C., 2008, arXiv, 809, arXiv:0809.1066
- Batcheldor et al. (2005) Batcheldor, D., et al. 2005, ApJS, 160, 76
- Bender et al. (1994) Bender, R., Saglia, R. P., & Gerhard, O. E. 1994, MNRAS, 269, 785
- Bender et al. (1996) Bender, R., Kormendy, J., & Dehnen, W. 1996, ApJ, 464, L123
- Bernardi et al. (2002) Bernardi, M., Alonso, M. V., da Costa, L. N., Willmer, C. N. A., Wegner, G., Pellegrini, P. S., Rité, C., & Maia, M. A. G. 2002, AJ, 123, 2990
- Bettoni & Galletta (1997) Bettoni, D. & Galletta, G. 1997, A&AS, 124, 61
- Böker et al. (2002) Böker, T., Laine, S., van der Marel, R. P., Sarzi, M., Rix, H.-W., Ho, L. C., & Shields, J. C. 2002, AJ, 123, 1389
- Böker et al. (2004) Böker, T., Sarzi, M., McLaughlin, D. E., van der Marel, R. P., Rix, H.-W., Ho, L. C., & Shields, J. C. 2004, AJ, 127, 105
- Bonfanti et al. (1995) Bonfanti, P., Rampazzo, R., Combes, F., Prugniel, P., & Sulentic, J. W. 1995, A&A, 297, 28
- Bower et al. (1998) Bower, G. A., et al. 1998, ApJ, 492, L111
- Braatz et al. (1994) Braatz, J.A., Wilson, A.S., & Henkel, C. 1994, ApJ, 437, L99
- Cappellari & McDermid (2005) Cappellari M., & McDermid R. M., 2005, CQGra, 22, 347
- Carollo et al. (1993) Carollo, C. M., Danziger, I. J., & Buson, L. 1993, MNRAS, 265, 553
- Coccato et al. (2006) Coccato, L., et al. 2006, MNRAS, 366, 1050
- Corsini et al. (1999) Corsini, E. M., et al. 1999, A&A, 342, 671
- Côté et al. (2006) Côté, P., et al. 2006, ApJS, 165, 57
- Dalla Bontà et al. (2008) Dalla Bontà, E., Ferrarese, L., Corsini, E. M., Miralda-Escudé, J., Coccato, L. & Sarzi, M. 2008, ApJ, accepted
- Davies et al. (2006) Davies, R. I., et al. 2006, ApJ, 646, 754
- Davies et al. (1987) Davies, R. L., Burstein, D., Dressler, A., Faber, S. M., Lynden-Bell, D., Terlevich, R. J., & Wegner, G. 1987, ApJS, 64, 581
- de Francesco et al. (2008) de Francesco, G., Capetti, A., & Marconi, A. 2008, A&A, 479, 355
- de Francesco et al. (2006) de Francesco, G., Capetti, A., & Marconi, A. 2006, A&A, 460, 439
- de Souza et al. (2004) de Souza, R. E., Gadotti, D. A., & dos Anjos, S. 2004, ApJS, 153, 411
- de Vaucouleurs et al. (1991) de Vaucouleurs, G., de Vaucouleurs, A., Corwin, H. G., Jr., Buta, R. J., Paturel, G., & Fouque, P. 1991, Third Reference Catalogue of Bright Galaxies (Berlin: Springer-Verlag)
- Devereux et al. (2003) Devereux, N., Ford, H., Tsvetanov, Z., & Jacoby, G. 2003, AJ, 125, 1226
- Di Matteo et al. (2005) Di Matteo, T., Springel, V., & Hernquist, L. 2005, Nature, 433, 604
- di Nella et al. (1995) di Nella, H., Garcia, A. M., Garnier, R., & Paturel, G. 1995, A&AS, 113, 151
- Dressel et al. (2007) Dressel, L., et al. 2007, STIS Data Handbook, Version 5.0, (Baltimore: STScI)
- Dumas et al. (2007) Dumas, G., Mundell, C. G., Emsellem, E., & Nagar, N. M. 2007, MNRAS, 379, 1249
- Emsellem et al. (2007) Emsellem, E., et al. 2007, MNRAS, 379, 401
- Faber & Jackson (1976) Faber, S. M., & Jackson, R. E. 1976, ApJ, 204, 668
- Falcón-Barroso et al. (2002) Falcón-Barroso, J., Peletier, R. F., & Balcells, M. 2002, MNRAS, 335, 741
- Falcón-Barroso et al. (2006) Falcón-Barroso, J., et al. 2006, MNRAS, 369, 529
- Ferrarese et al. (1996) Ferrarese, L., Ford, H. C., & Jaffe, W. 1996, ApJ, 470, 444
- Ferrarese & Merritt (2000) Ferrarese, L., & Merritt, D. 2000, ApJ, 539, L9
- Ferrarese (2002) Ferrarese, L. 2002, ApJ, 578, 90
- Ferrarese & Ford (2005) Ferrarese, L. & Ford, H. 2005, Sp. Sci. Rev., 116, 523
- Ferrarese et al. (2006) Ferrarese, L., et al. 2006, ApJ, 644, L21
- Filippenko & Halpern (1984) Filippenko, A. V., & Halpern, J. P. 1984, ApJ, 285, 458
- Filippenko & Sargent (1988) Filippenko, A. V., & Sargent, W. L. W. 1988, ApJ, 324, 134
- Fisher (1997) Fisher, D. 1997, AJ, 113, 950
- Fisher et al. (1995) Fisher, D., Franx, M., & Illingworth, G. 1995, ApJ, 448, 119
- Freedman et al. (2001) Freedman, W. L., et al. 2001, ApJ, 553, 47
- Garcia-Rissmann et al. (2005) Garcia-Rissmann, A., Vega, L. R., Asari, N. V., Cid Fernandes, R., Schmitt, H., González Delgado, R. M., & Storchi-Bergmann, T. 2005, MNRAS, 359, 765
- Gebhardt et al. (2000) Gebhardt, K., et al. 2000, ApJ, 539, L13
- Gebhardt et al. (2003) Gebhardt, K., et al. 2003, ApJ, 583, 92
- Graham et al. (2001) Graham, A. W., Erwin, P., Caon, N., & Trujillo, I. 2001, ApJ, 563, L11
- Graham (2008) Graham, A. W. 2008, ApJ, 680, 143
- Greene & Ho (2006) Greene, J. E., & Ho, L. C. 2006, ApJ, 641, L21
- Greenhill et al. (2003) Greenhill, L. J., Kondratko, P. T., Lovell, J. E. J., Kuiper, T. B. H., Moran, J. M., Jauncey, D. L., & Baines, G. P. 2003, ApJ, 582, L11
- Gu et al. (2006) Gu, Q., Melnick, J., Fernandes, R. C., Kunth, D., Terlevich, E., & Terlevich, R. 2006, MNRAS, 366, 480
- Jarvis et al. (1988) Jarvis, B. J., Dubath, P., Martinet, L., & Bacon, R. 1988, A&AS, 74, 513
- Jørgensen et al. (1995) Jørgensen, I., Franx, M., & Kjaergaard, P. 1995, MNRAS, 276, 1341
- Haehnelt & Kauffmann (2000) Haehnelt, M. G., & Kauffmann, G. 2000, MNRAS, 318, L35
- Häring & Rix (2004) Häring, N., & Rix, H.-W. 2004, ApJ, 604, L89
- Héraudeau & Simien (1998) Héraudeau, P. & Simien, F. 1998, A&AS, 133, 317
- Héraudeau et al. (1999) Héraudeau, P., Simien, F., Maubon, G., & Prugniel, P. 1999, A&AS, 136, 509
- Ho, Filippenko, & Sargent (1997) Ho L. C., Filippenko A. V., & Sargent W. L. W., 1997, ApJS, 112, 315
- Ho et al. (1997) Ho, L. C., Filippenko, A. V., Sargent, W. L. W., & Peng, C. Y. 1997, ApJS, 112, 391
- Ho et al. (2000) Ho, L. C., Rudnick, G., Rix, H.-W., Shields, J. C., McIntosh, D. H., Filippenko, A. V., Sargent, W. L. W., & Eracleous, M. 2000, ApJ, 541, 120
- Ho et al. (2002) Ho, L. C., Sarzi, M., Rix, H.-W., Shields, J. C., Rudnick, G., Filippenko, A. V., & Barth, A. J. 2002, PASP, 114, 137
- Ho (2008) Ho, L. C. 2008, ARA&A, in press (arXiv:0803.2268)
- Houghton et al. (2006) Houghton R. C. W., Magorrian J., Sarzi M., Thatte N., Davies R. L., & Krajnović D., 2006, MNRAS, 367, 2
- Kassin et al. (2006) Kassin, S. A., de Jong, R. S., & Pogge, R. W. 2006, ApJS, 162, 80
- Kazantzidis et al. (2005) Kazantzidis, S., et al. 2005, ApJ, 623, L67
- KimQuijano et al. (2007) Kim Quijano, J., et al. 2007, STIS Instrument Handbook, Version 8.0 (Baltimore: STScI)
- Koprolin & Zeilinger (2000) Koprolin, W., & Zeilinger, W. W. 2000, A&AS, 145, 71
- Kormendy (1988) Kormendy, J. 1988, ApJ, 335, 40
- Kormendy & Richstone (1995) Kormendy, J., & Richstone, D. 1995, ARA&A, 33, 581
- Kormendy (2004) Kormendy, J. 2004, in Coevolution of Black Holes and Galaxies, ed. L. C. Ho (Cambridge: Cambridge Univ. Press), 1
- Lauer et al. (1995) Lauer, T. R., et al. 1995, AJ, 110, 2622
- Lauer et al. (2007) Lauer T. R., Tremaine S., Richstone D., & Faber S. M., 2007, ApJ, 670, 249
- Lauer et al. (2007) Lauer, T. R., et al. 2007, ApJ, 662, 808
- Laurikainen et al. (2004) Laurikainen, E., Salo, H., Buta, R., & Vasylyev, S. 2004, MNRAS, 355, 1251
- Laurikainen et al. (2005) Laurikainen, E., Salo, H., & Buta, R. 2005, MNRAS, 362, 1319
- Macchetto et al. (1997) Macchetto, F., Marconi, A., Axon, D. J., Capetti, A., Sparks, W., & Crane, P. 1997, ApJ, 489, 579
- Magorrian et al. (1998) Magorrian, J., et al. 1998, AJ, 115, 2285
- Marconi & Hunt (2003) Marconi, A., & Hunt, L. K. 2003, ApJ, 589, L21
- Marconi et al. (2003) Marconi, A., et al. 2003, ApJ, 586, 868
- McLaughlin et al. (2006) McLaughlin, D. E., King, A. R., & Nayakshin, S. 2006, ApJ, 650, L37
- Méndez-Abreu et al. (2008) Méndez-Abreu, J., Aguerri, J. A. L., Corsini, E. M., & Simonneau, E. 2008, A&A, 478, 353
- Moré et al. (1980) Moré, J. J., Garbow, B. S., & Hillstrom, K. E. 1980, User guide for MINPACK-1, Report ANL-80-74 Argonne: Argonne National Laboratory)
- Miyoshi et al. (1995) Miyoshi, M., Moran, J., Herrnstein, J., Greenhill, L., Nakai, N., Diamond, P., & Inoue, M. 1995, Nature, 373, 127
- Nelson & Whittle (1995) Nelson, C. H. & Whittle, M. 1995, ApJS, 99, 67
- Noel-Storr et al. (2007) Noel-Storr, J., Baum, S. A., & O’Dea, C. P. 2007, ApJ, 663, 71
- Novak et al. (2006) Novak, G. S., Faber, S. M., & Dekel, A. 2006, ApJ, 637, 96
- Nowak et al. (2007) Nowak, N., Saglia, R. P., Thomas, J., Bender, R., Pannella, M., Gebhardt, K., & Davies, R. I. 2007, MNRAS, 379, 909
- Osterbrock (1989) Osterbrock, D. E. 1989, Astrophysics of Gaseous Nebulae and Active Galactic Nuclei (Mill Valley: University Science Books)
- Pastorini et al. (2007) Pastorini, G., et al. 2007, A&A, 469, 405
- Pizzella et al. (2005) Pizzella, A., Corsini, E. M., Dalla Bontà, E., Sarzi, M., Coccato, L., & Bertola, F. 2005, ApJ, 631, 785
- Proctor & Sansom (2002) Proctor, R. N. & Sansom, A. E. 2002, MNRAS, 333, 517
- Press et al. (1996) Press, W. H., Teukolsky, S. A., Vetterling, W. T., & Flannery, B. P. 1996, Numerical Recipes in Fortran 77: The Art of Scientific Computing (Cambridge: Cambridge University Press)
- Rice et al. (2006) Rice, M. S., Martini, P., Greene, J. E., Pogge, R. W., Shields, J. C., Mulchaey, J. S., & Regan, M. W. 2006, ApJ, 636, 654
- Sarzi et al. (2001) Sarzi, M., Rix, H.-W., Shields, J. C., Rudnick, G., Ho, L. C., McIntosh, D. H., Filippenko, A. V., & Sargent, W. L. W. 2001, ApJ, 550, 65
- Sarzi et al. (2002) Sarzi, M., et al. 2002, ApJ, 567, 237
- Sarzi (2004) Sarzi M., 2004, in Coevolution of Black Holes and Galaxies, ed. L. C. Ho (Cambridge: Cambridge Univ. Press), 1
- Sarzi et al. (2006) Sarzi M., et al., 2006, MNRAS, 366, 1151
- Scarlata et al. (2004) Scarlata, C., et al. 2004, AJ, 128, 1124
- Shapiro et al. (2006) Shapiro, K. L., Cappellari, M., de Zeeuw, T., McDermid, R. M., Gebhardt, K., van den Bosch, R. C. E., & Statler, T. S. 2006, MNRAS, 370, 559
- Schawinski et al. (2006) Schawinski, K., et al. 2006, Nature, 442, 888
- Schechter (1983) Schechter, P. L. 1983, ApJS, 52, 425
- Seth et al. (2008) Seth, A., Agüeros, M., Lee, D., & Basu-Zych, A. 2008, ApJ, 678, 116
- Skrutskie et al. (2006) Skrutskie, M. F., et al. 2006, AJ, 131, 1163 (2MASS)
- Silk & Rees (1998) Silk, J., & Rees, M. J. 1998, A&A, 331, L1
- Simien & Prugniel (1997a) Simien, F. & Prugniel, P. 1997a, A&AS, 122, 521
- Simien & Prugniel (1997b) Simien, F. & Prugniel, P. 1997b, A&AS, 126, 15
- Simien & Prugniel (1997c) Simien, F. & Prugniel, P. 1997c, A&AS, 126, 519
- Simien & Prugniel (1998) Simien, F. & Prugniel, P. 1997c, A&AS, 131, 287
- Simien & Prugniel (2002) Simien, F. & Prugniel, P. 2002, A&AS, 384, 371
- Smith et al. (2000) Smith, R. J., Lucey, J. R., Hudson, M. J., Schlegel, D. J., & Davies, R. L. 2000, MNRAS, 313, 469
- Terlevich et al. (1990) Terlevich, E., Díaz, A. I., & Terlevich, R. 1990, MNRAS, 242, 271
- Tonry & Davis (1981) Tonry, J. L. & Davis, M. 1981, ApJ, 246, 666
- Tonry et al. (2001) Tonry, J. L., Dressler, A., Blakeslee, J. P., Ajhar, E. A., Fletcher, A. B., Luppino, G. A., Metzger, M. R., & Moore, C. B. 2001, ApJ, 546, 681
- Tully (1988) Tully, R. B. 1988, Nearby Galaxies Catalog (Cambridge: Cambridge University Press)
- Tonry et al. (2000) Tonry, J. L., Blakeslee, J. P., Ajhar, E. A., & Dressler, A. 2000, ApJ, 530, 625
- Tremaine et al. (2002) Tremaine, S., et al. 2002, ApJ, 574, 740
- Valluri et al. (2004) Valluri, M., Merritt, D., & Emsellem, E. 2004, ApJ, 602, 66
- van den Bosch & van der Marel (1995) van den Bosch, F. C. & van der Marel, R. P. 1995, MNRAS, 274, 884
- van Dokkum (2001) van Dokkum, P. G., 2001, PASP, 113, 1420
- van der Marel & van den Bosch (1998) van der Marel, R. P. & van den Bosch, F. C. 1998, AJ, 116, 2220
- Vega Beltrán et al. (2001) Vega Beltrán, J. C., Pizzella, A., Corsini, E. M., Funes, J. G., Zeilinger, W. W., Beckman, J. E., & Bertola, F. 2001, A&A, 374, 394
- Verdoes Kleijn et al. (1999) Verdoes Kleijn, G. A., Baum, S. A., de Zeeuw, P. T., & O’Dea, C. P. 1999, AJ, 118, 2592
- Verdoes Kleijn et al. (2000) Verdoes Kleijn, G. A., van der Marel, R. P., Carollo, C. M., & de Zeeuw, P. T. 2000, AJ, 120, 1221
- Verdoes Kleijn et al. (2002) Verdoes Kleijn, G. A., van der Marel, R. P., de Zeeuw, P. T., Noel-Storr, J., & Baum, S. A. 2002, AJ, 124, 2524
- Verdoes Kleijn et al. (2006) Verdoes Kleijn, G., et al. 2006, AJ, 131, 1961
- Verolme et al. (2002) Verolme, E. K., et al. 2002, MNRAS, 335, 517
- Volonteri (2007) Volonteri, M. 2007, ApJ, 663, L5
- Vittorini et al. (2005) Vittorini, V., Shankar, F., & Cavaliere, A. 2005, MNRAS, 363, 1376
- Wagner & Appenzeller (1988) Wagner, S. J. & Appenzeller, I. 1988, A&A, 197, 75
- Walsh et al. (2008) Walsh, J. L., Barth A. J., Ho L. C., Filippenko A. V., Rix H.-W., Shields, J. C., Sarzi M., & Sargent W. L. W. 2008, ApJ, submitted.
- Wegner et al. (2003) Wegner, G., et al. 2003, AJ, 126, 2268
- Wyithe (2006) Wyithe J. S. B., 2006, MNRAS, 365, 1082
- Whitmore & Kirshner (1981) Whitmore, B. C. & Kirshner, R. P. 1981, ApJ, 250, 43
- Whitmore et al. (1979) Whitmore, B. C., Schechter, P. L., & Kirshner, R. P. 1979, ApJ, 234, 68
- Xanthopoulos (1996) Xanthopoulos, E. 1996, MNRAS, 280, 6
![[Uncaptioned image]](/html/0809.5103/assets/x6.png)
![[Uncaptioned image]](/html/0809.5103/assets/x7.png)
Notes. — Col.(1): Galaxy name. Col.(2): Morphological type from RC3. Col.(3): Nuclear spectral class from Ho, Filippenko, & Sargent (1997), where H = H II nucleus, L = LINER, S = Seyfert , T = transiton object (LINER/HII), 1 = type 1, 2 = type 2, and a fractional number between 1 and 2 denotes various intermediate types; uncertain and highly uncertain classifications are followed by a single and double colon, respectively. The nuclear spectral class of galaxies marked with * is from NASA/IPAC Extragalactic Database (NED). Col.(4): Distance. Col.(5): Reference for col. 4. All the distances were taken from literature (see attached list), except those we obtained from , the weighted mean recessional velocity corrected to the reference frame of the microwave background radiation given in RC3. These were derived as with km s-1 Mpc-1. Col.(6): Absolute corrected magnitude derived from (RC3) with the adopted distance. Col.(7): Effective radius of the spheroidal component.
Col.(8): Band in wich the effective radius were measured. Col.(9): Reference for col.(7). All the effective radii were taken from literature (see attached list), except for those we measured by a photometric decomposition of the -band images available in the 2MASS science archive Skrutskie et al. (2006). Col.(10): Central velocity dispersion of the stellar component within . Col.(11): Reference for the measured stellar velocity dispersion and corresponding size of the central aperture from which we calculated the value given in col.(10) by following Jørgensen et al. (1995). We did not apply any aperture correction to the measured stellar velocity dispersions of NGC 2748, NGC 3982, and UGC 1841, because no information about the size of the aperture was available. Col.(12): HST proposal number under which was obtained the STIS/G750M spectrum from which we measured the central velocity dispersion of the ionized gas. Col.(13): Size of the central aperture where we measured the velocity dispersion of the ionized gas. Col.(14): Physical size of the central aperture where we measured the velocity dispersion of the ionized gas. Col.(15): Central velocity dispersion of the ionized-gas component within the aperture in Col. (13). This is the intrinsic velocity dispersion obtained from the observed one by subtracting the instrumental velocity dispersion. Col.(16): upper limit for a Keplerian disk model assuming . Col.(17): upper limit for . Col.(18): Mass (and confidence interval) of the SMBH derived from modeling based on the resolved kinematics. The of NGC 3227 and NGC 4258 were obtained by studying the dynamics of stars and water masers, respectively. The ionized-gas dynamics was used for all the remaining galaxies. Col.(19): Reference for col.(18).
References. — (1) Tully (1988); (2) de Vaucouleurs et al. (1991); (3) Tonry et al. (2001); (4) Freedman et al. (2001); (5) Skrutskie et al. (2006); (6) Kassin et al. (2006); (7) de Souza et al. (2004); (8) Laurikainen et al. (2004); (9) Xanthopoulos (1996); (10) Baggett et al. (1998); (11) Andredakis & Sanders (1994); (12) Marconi & Hunt (2003); (13) Falcón-Barroso et al. (2002); (14) Laurikainen et al. (2005); (15) Fisher et al. (1995); (16) Scarlata et al. (2004); (17) Terlevich et al. (1990); (18) Garcia-Rissmann et al. (2005); (19) Wegner et al. (2003); (20) Batcheldor et al. (2005); (21) Davies et al. (1987); (22) Simien & Prugniel (1997a); (23) Bernardi et al. (2002); (24) Schechter (1983); (25) Bonfanti et al. (1995); (26) Nelson & Whittle (1995); (27) Barth et al. (2002); (28) Corsini et al. (1999); (29) Simien & Prugniel (1997b); (30) Simien & Prugniel (1997c); (31) Héraudeau & Simien (1998); (32) di Nella et al. (1995); (33) Héraudeau et al. (1999); (34) Vega Beltrán et al. (2001); (35) Carollo et al. (1993); (36) Simien & Prugniel (1998); (37) Whitmore et al. (1979); (38) Smith et al. (2000); (39) Sarzi et al. (2002); (40) Fisher (1997); (41) Simien & Prugniel (2002); (42) Falcón-Barroso et al. (2006); (43) Verdoes Kleijn et al. (2002); (44) Whitmore & Kirshner (1981); (45) Jarvis et al. (1988); (46) Proctor & Sansom (2002); (47) Bettoni & Galletta (1997); (48) Bender et al. (1994); (49) Noel-Storr et al. (2007); (50) Dumas et al. (2007); (51) Gu et al. (2006); (52) Wagner & Appenzeller (1988); (54) van den Bosch & van der Marel (1995); (55) Balcells et al. (1995); (55) Tonry & Davis (1981); (57) Atkinson et al. (2005); (58) Sarzi et al. (2001); (59) Devereux et al. (2003); (60) Davies et al. (2006); (61) Barth et al. (2001); (62) Pastorini et al. (2007); (63) de Francesco et al. (2006); (64) Marconi et al. (2003); (65) Miyoshi et al. (1995); (67) Ferrarese et al. (1996); (68) Coccato et al. (2006); (69) Macchetto et al. (1997); (70) Kormendy (1988); (71) de Francesco et al. (2008); (72) van der Marel & van den Bosch (1998); (66) Bower et al. (1998); (53) Koprolin & Zeilinger (2000).
| Galaxy | Morp. T. | Prop. | Rej. |
|---|---|---|---|
| (RC3) | |||
| IC 5096 | Sbc sp | 9046 | ns |
| NGC 0134 | SABbc(s) | 8228 | ns |
| NGC 0157 | SABbc(rs) | 8228 | ns |
| NGC 0255 | SABbc(rs) | 8228 | ns |
| NGC 0278 | SABb(rs) | 7361 | s |
| NGC 0520 | pec | 8669 | i |
| NGC 1097 | SBb(s) | 9782 | ds |
| NGC 1255 | SABbc(rs) | 8228 | n |
| NGC 1300 | SBbc(rs) | 8228 | p |
| NGC 1832 | SBbc(r) | 8228 | ns |
| NGC 2623 | pec | 8669 | i |
| NGC 2654 | SBab sp: | 9046 | s |
| NGC 2892 | E+ pec: | 8236 | s |
| NGC 2976 | SAc pec | 8591 | s |
| NGC 3003 | Sbc? | 8228 | s |
| NGC 3049 | SBab(rs) | 7513 | s |
| NGC 3067 | SABab(s) | 8596 | f |
| NGC 3162 | SABbc(rs) | 8228 | r |
| NGC 3254 | SAbc(s) | 8228 | n |
| NGC 3256 | pec | 8669 | i |
| NGC 3259 | SABbc(rs) | 8228 | s |
| NGC 3379 | E1 | 8589 | f |
| NGC 3403 | SAbc: | 8228 | ns |
| NGC 3489 | SAB0+(rs) | 7361 | p |
| NGC 3516 | (R)SB0(s) | 8055 | d |
| NGC 3521 | SABbc(rs) | 8228 | ns |
| NGC 3684 | SAbc(rs) | 8228 | ns |
| NGC 3686 | SBbc(s) | 8228 | s |
| NGC 3705 | SABab(r) | 8607 | n |
| NGC 3756 | SABbc(rs) | 8228 | ns |
| NGC 3887 | SBbc(r) | 8228 | s |
| NGC 3917 | SAcd: | 8607 | ns |
| NGC 3921 | (R′)SA0/a(rs) pec | 8669 | i |
| NGC 3949 | SAbc(s) | 8228 | ns |
| NGC 3972 | SAbc(s) | 8228 | ns |
| NGC 4030 | SAbc(s) | 8228 | r |
| NGC 4038 | SBm(s) pec | 8669 | is |
| NGC 4039 | SBm(s) pec | 8669 | is |
| NGC 4051 | SABbc(rs) | 8228 | r |
| NGC 4100 | (R′)SAbc(rs) | 8228 | s |
| NGC 4138 | SA0+(rs) | 1039 | n |
| NGC 4303 | SABbc(rs) | 8228 | p |
| NGC 4343 | SAb(rs) | 9068 | s |
| NGC 4380 | SAb(rs):? | 7361 | n |
| NGC 4389 | SBbc(rs) | 8228 | ns |
| NGC 4414 | SAc(rc)? | 8607 | n |
| NGC 4420 | SBbc(r): | 8228 | s |
| NGC 4527 | SABbc(s) | 8607/8228 | fn |
| NGC 4536 | SABbc(rs) | 8228 | r |
| NGC 4569 | SABab(rs) | 8607 | r |
| NGC 4676A | S0 pec ? (Irr) | 8669 | s |
| NGC 4696 | E+1 pec | 8690 | n |
| NGC 5054 | SAbc(s) | 8228 | s |
| NGC 5055 | SAbc(rs) | 7361/8228 | n |
| NGC 5135 | SBab(s) | 9143 | r |
| NGC 5141 | S0 | 8236 | s |
| NGC 5247 | SAbc(s) | 8228 | ns |
| NGC 5364 | SAbc(rs) pec | 8228 | n |
| NGC 5398 | (R′)SBdm(s): pec | 7513 | s |
| NGC 5577 | SAbc(rs) | 8228 | ns |
| NGC 5635 | S pec | 7354 | s |
| NGC 5713 | SABbc(rs) | 8228 | s |
| NGC 5746 | SABb(rs) sp: | 9046 | n |
| NGC 5905 | SBb(r) | 9177 | d |
| NGC 5921 | SBbc(r) | 8228 | s |
| NGC 6384 | SABbc(r) | 8228 | n |
| NGC 6503 | SAcd(s) | 8607 | n |
| NGC 6621 | Sb: pec | 8669 | s |
| NGC 7252 | (R)SA00: | 8669 | i |
| NGC 7314 | SABbc(rs) | 8228 | pr |
| NGC 7592 | S0+ pec: | 8669 | s |
| UGC 10814 | Scd: | 9782 | ds |
Notes. — Col.(1): Galaxy name. Col.(2): Morphological type from RC3. Col.(3): HST proposal number under which was obtained the STIS/G750M spectrum. Col.(4): Reason of rejection, where d = problem in deblending the emission lines, i = interacting galaxy, f = irregular or strongly asymmetric radial profile of the flux of the [N ii] emission linea n = faint or absent emission lines, p = double-peaked emission lines, r = unsuccessful two-dimensional rectification of the spectrum, s = no stellar velocity dispersion available in literature.