Ultra-Compact Dwarf Candidates Near the Lensing Galaxy in Abell S074011affiliation: Based on observations made with the NASA/ESA Hubble Space Telescope, obtained from the Space Telescope Science Institute, which is operated by the Association of Universities for Research in Astronomy, Inc., under NASA contract NAS 5-26555. These observations are associated with program #10429.
Abstract
We analyze three-band imaging data of the giant elliptical galaxy ESO 325-G004 from the Hubble Space Telescope Advanced Camera for Surveys (ACS). This is the nearest known strongly lensing galaxy, and it resides in the center of the poor cluster Abell S0740 at redshift . Based on magnitude, color, and size selection criteria, we identify a sample of 15 ultra-compact dwarf (UCD) galaxy candidates within the ACS field. This is comparable to the numbers of UCDs found within similar regions in more nearby clusters (Virgo, Fornax, Hydra). We estimate circular half-light radii from 2-D Sérsic and King model fits and apply an upper cutoff of 100 pc for our UCD selection. The selected galaxies have typical Sérsic indices , while larger sources with pc are more nearly exponential, perhaps indicating that the latter are dominated by background disk galaxies. Many of the UCD candidates are surrounded by a faint “fuzz” of halo light, which may be the remnants of stripped material, and there is some evidence for intrinsic flattening of the UCDs themselves. An apparent separation in size between the most compact UCDs with pc and larger ones with pc may hint at different formation mechanisms. We do not find any M32 analogues in this field. The colors of the UCD candidates span the range from blue to red globular clusters, although the brightest ones are predominantly red. The UCD candidates follow the flattened, elliptical distribution of the globular clusters, which in turn follow the galaxy halo light, suggesting a common evolution for these three components. Planned follow-up spectroscopy can determine which candidates are truly members of Abell S0740 and how similar they are in distribution to the globulars.
Subject headings:
galaxies: elliptical and lenticular, cD — galaxies: dwarf — galaxies: evolution — galaxies: individual (ESO 325-G004) — galaxies: clusters: individual (Abell S0740)1. Introduction
A new class of stellar system has emerged in recent years. Due to the size of these objects, being larger than average globular clusters (GCs) and smaller than dwarf galaxies, they have been dubbed ultra-compact dwarf galaxies, or UCDs (Phillips et al. 2001). They are typically a few in mass, with effective radii in the range 10-100 pc. First discovered in the Fornax Cluster (Hilker et al. 1999; Drinkwater et al. 2000), UCDs have now been found in significant numbers in the Virgo, Centaurus, and Hydra clusters (Haşegan et al. 2005; Mieske et al 2007; Wehner & Harris 2007), all systems within 50 Mpc of the Local Group. They are apparently very rare outside of galaxy clusters (Evstigneeva et al. 2007b).
As they have absorption line spectra and appear to be transitional between GCs and early-type dwarfs (cf. Haşegan et al. 2005), there are two basic ideas for the nature of UCDs: they are related to globulars, or to dwarf galaxies. More specifically, UCDs may be the largest members of the rich GC populations found inside galaxy clusters (Mieske et al. 2002), possibly growing to such large size through dissipational merging early in their lifetimes (Fellhauer & Kroupa 2002). Or, they may be the small, tidally stripped remains of nucleated dwarf galaxies on orbits that carried them too close to the center of the cluster potential (Bekki et al. 2001; Drinkwater et al. 2003). This latter explanation has come to be known as galaxy “threshing,” but the idea has been around for many years. Bassino et al. (1994) numerically simulated the evolution of nucleated dwarfs in Virgo and showed that stripped nuclei could constitute a large fraction of M87’s very rich GC system, while larger UCD-like remnants would occur farther out. Recent Hubble Space Telescope (HST) imaging has revealed nuclei in a much higher percentage of Virgo early-type dwarfs than previously thought (Côté et al. 2006). Thus, stripping of nucleated dwarfs may account for both UCDs and many of the GCs in the center of cluster potentials.
Some evidence based on the color-magnitude sequence of UCDs suggests that they may be an extension of the red GC component to brighter magnitudes (Wehner & Harris 2007). The UCDs in the Virgo and Fornax clusters also have spectroscopic metallicities and -element enhancements consistent with their being the high-mass mass extreme of the red GC population (Evstigneeva et al. 2007a; Mieske et al. 2006), and less consistent with simple versions of the threshing model. Estigneeva et al. (2008) attempted to distinguish between the two formation scenarios on the basis of the structural properties of UCDs in the nearby Virgo and Fornax clusters measured using the HST High Resolution Channel. Even with such high resolution measurements, the data were consistent with either explanation, although more detailed predictions of the size evolution of the nuclei during threshing are needed to test this scenario. The relatively low velocity dispersions of cluster UCD populations are expected in either model (e.g., Bekki 2007). However, detailed comparison between the spatial distributions of large samples of UCDs and their possible nucleated dwarf progenitors in clusters may help uncover their evolutionary histories (e.g., Goerdt et al. 2008; Thomas et al. 2008).
Given the difficulty in distinguishing between the formation scenarios, further UCD surveys can provide valuable information on the properties of this new type of stellar system. A larger sample of groups and clusters is especially useful for constraining environmental effects on the formation of UCDs. Here, we present a search with HST for UCD candidates near ESO 325-G004, the central giant elliptical in Abell S0740. This is one of the systems in the supplementary list of poor clusters tabulated by Abell et al. (1989) that did not meet the lowest richness criteria of the original Abell (1958) catalogue. The cluster velocity dispersion is only 300 km s-1 (see plot in Smith et al. 2005), similar to that of Fornax, where UCDs were first discovered. The absolute magnitude of ESO 325-G004 is , making it about 60% more luminous than M87, or 2.5 times the luminosity of NGC 1399 in Fornax. At , ESO 325-G004 is also the closest known gravitational lens and has both dynamical and lensing mass estimates (Smith et al. 2005). This makes it an interesting target for UCD searches, since it is a very massive, dominant elliptical in a poor cluster or rich group environment.
The following section describes our data in detail. In § 3, we present our photometric and size measurements and discuss the selection of UCD candidates. The properties of the UCD candidates are discussed in § 4 and compared with those of GCs and other objects in the field. The final section summarizes the results. Throughout this paper, we use the WMAP 3-year cosmology results (Spergel et al. 2007) and assume a distance modulus for ESO 325-G004 of mag, or a luminosity distance of 143 Mpc, and an angular scale of 0.65 kpc arcsec-1. This translates to an image scale of about 33 pc pix-1 for our observations with Advanced Camera for Surveys Wide Field Channel (ACS/WFC).
2. Observations and Reductions
ESO 325-G004 was imaged with the ACS/WFC in the F475W, F625W, and F814W filters. Throughout this paper, we refer to magnitudes in these filters as , , and , respectively. The galaxy was initially observed in F814W and F475W as part of HST GO Program 10429 during January 2005. This program, which is conducting a surface brightness fluctuation survey in the Shapley supercluster region, is described in Blakeslee (2007). There were 22 F814W exposures of varying times totaling of 18,882 s, and three exposures in F475W of 367s each. In February 2006, further imaging of the ESO 325-G004 field was carried out by HST DD Program 10710 for a Hubble Heritage public release image.111http://heritage.stsci.edu/2007/08/index.html This provided six additional exposures in each of the F475W and F625W filters. The total exposure times for this field were therefore 5901, 4650, and 18882 s in F475W, F625W, and F814W, respectively.
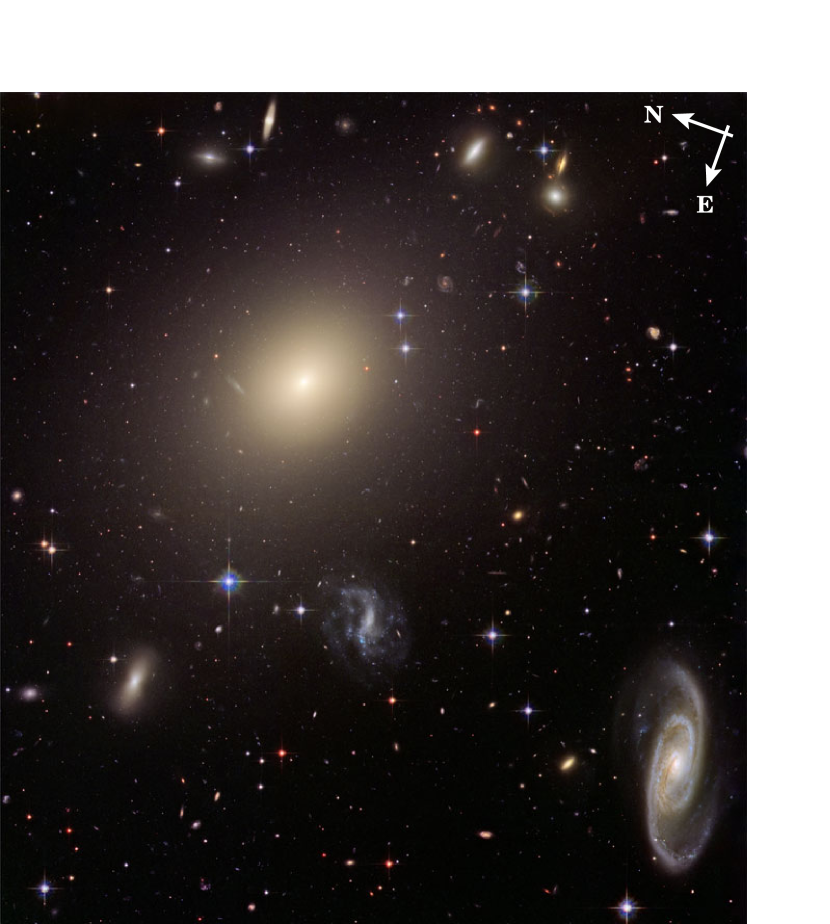
The images were processed with the Apsis pipeline (Blakeslee et al. 2003) to produce summed, geometrically corrected, cosmic ray cleaned images for each bandpass. Figure 1 shows a color composite image constructed from the data in the three bandpasses. Apsis corrects the astrometric zero point of the images to within an uncertainty of about 01. It also produces an RMS image giving the total noise for each pixel. We calibrated the photometry using the Vega-based ACS/WFC zero points for each filter from Sirianni et al. (2005): , , and . We corrected the photometry for Galactic extinction using mag (Schlegel et al. 1998) and the extinction ratios from Sirianni et al. (2005). We find the following extinction corrections in each band: mag, and mag, and mag.
We modeled the main galaxy ESO 325-G004 using the elliprof software (Tonry et al. 1997), as well as several of the other smaller galaxies in the field to obtain a better fit. The small galaxy models were subtracted from the image, and bright stars, diffraction spikes, and other galaxies were masked so a final model of ESO 325-G004 could be made. This final model was then subtracted to create a residual image, which was used to find sources with the object detection software SExtractor (Bertin & Arnouts 1996). We used the Apsis RMS image, which includes the noise from the subtracted galaxies, for the SExtractor detection weighting. To the F814W RMS image, we also added additional noise to account for the galaxy surface brightness fluctuations, as described in more detail by Jordán et al. (2004) and Barber DeGraaff et al. (2007). We used SExtractor in “dual image mode” with the much deeper F814W image as the detection image in each case, and individual filter images used for the photometry. This ensures that the same object centroids and measurement apertures are used for all the images, resulting in the most accurate color measurements (see Benítez et al. 2004). We adopt the SExtractor mag_auto value for the total magnitude and isophotal magnitudes to measure galaxy colors.
3. Sample Selection
3.1. Color and Magnitude Cuts
In order to search for UCDs in this field, we first applied cuts in color and magnitude to select a list of objects for size and shape measurements. Large numbers of GCs are visible in the image, but we expect the turnover, or peak luminosity, of the GC luminosity function (GCLF) to occur near . Therefore, only 1% of the GCs should have magnitudes , which is about 2.7 brighter than GCLF peak, and we chose as the faint limit for UCD candidates. This corresponds to an absolute magnitude , which typically marks the transition between GCs and UCDs (e.g., Haşegan et al. 2005). However, we performed the surface photometry fits and size measurements described below to a limit one magnitude fainter than this.
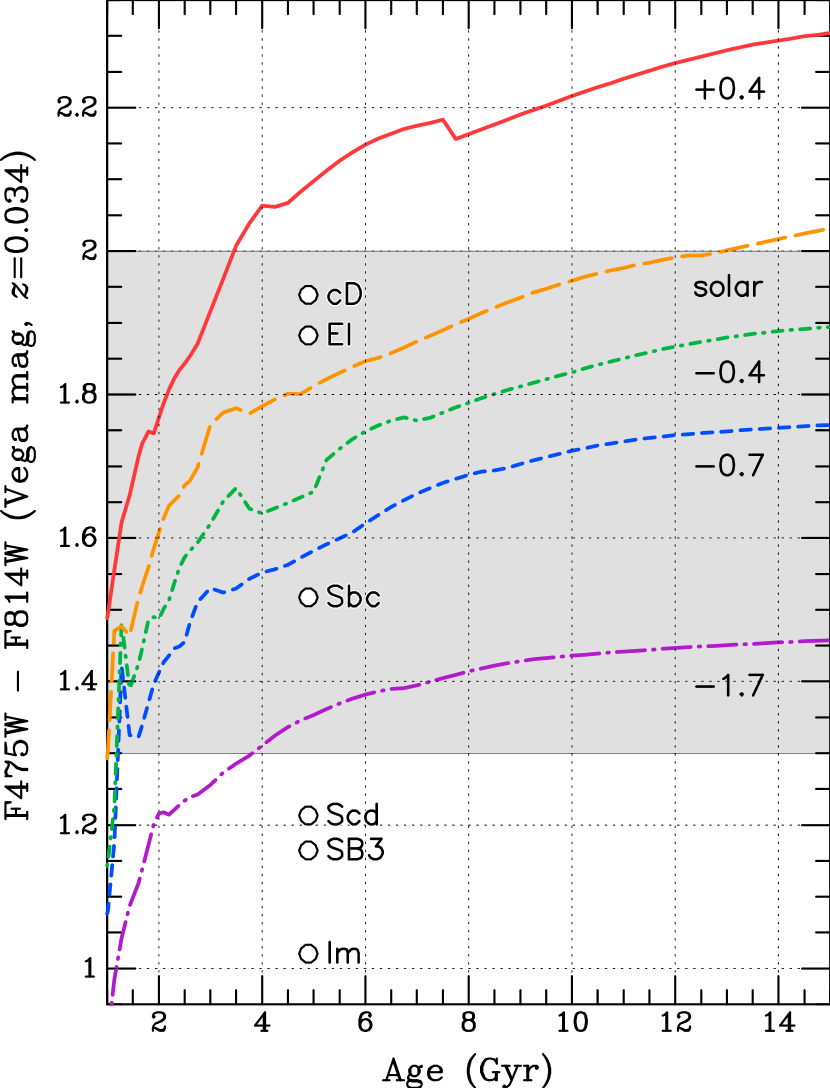
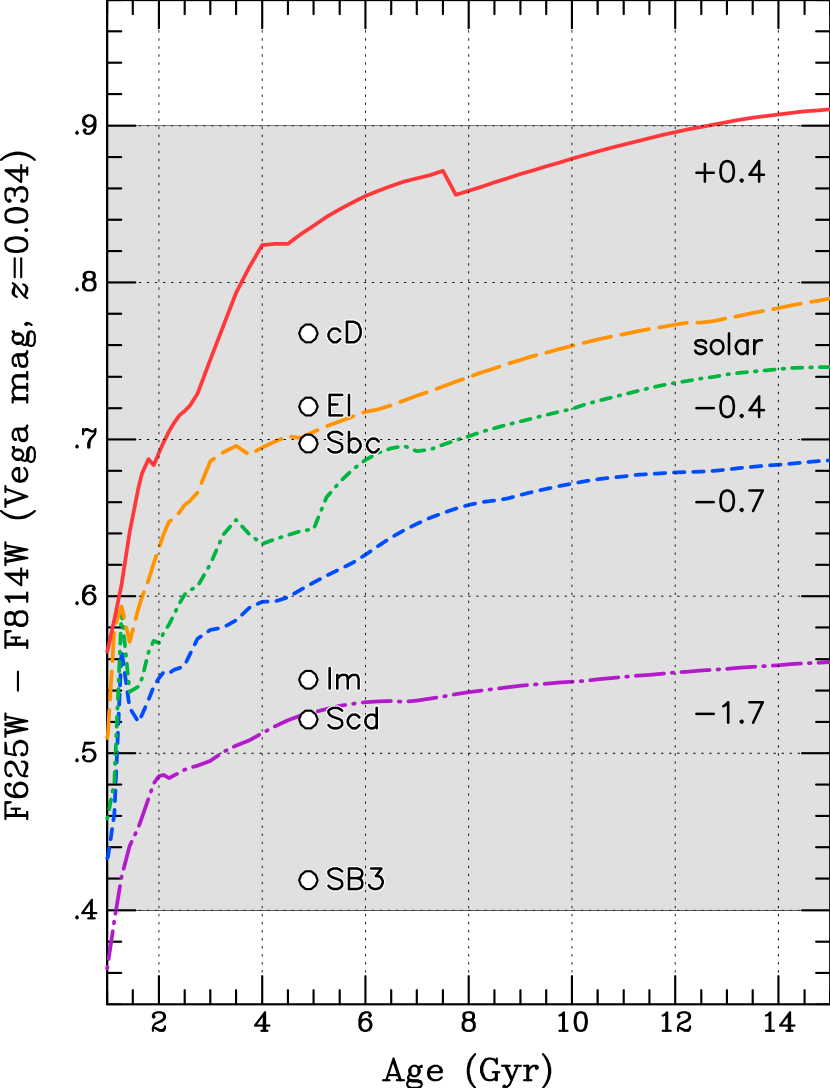
To derive color cuts, we calculated the color evolution for Bruzual & Charlot (2003) simple stellar population (SSP) models in the observed bandpasses at , as well as the colors of empirical galaxy templates from Benítez et al. (2004) and NGC 4889 in the Coma cluster, which we use as a template cD galaxy. Figure 2 shows the results of these calculations. The broader baseline has more discriminating power, and we use it for our more stringent color selection criterion: , which corresponds to , based on the models. This range includes the photometrically transformed colors of all confirmed UCDs from previous studies (e.g., Mieske et al. 2004b, 2007; Haşegan et al. 2005, Evstigneeva et al. 2008). The color cut spans the range from Sc-type spirals to the reddest giant ellipticals, and from intermediate age, very metal-poor models to metal-rich models. Note that the models do not include alpha-enhancement, and the absolute metallicity scale should be viewed as approximate; the empirical templates are the more useful comparison.
Additionally, we require , a broad cut which simply ensures that the objects have reasonable colors for a galaxy at this redshift. We also attempted to use our multi-band imaging data to estimate photometric redshifts as part of the selection criteria, similar to Mieske et al. (2004a) who searched for UCD-like objects in the more distant cluster Abell 1689 and had the benefit of a fourth bandpass. However, we found that the photometric redshifts based on just these three bands were not very robust for objects in this low-redshift cluster. We therefore decided to use the simple color cuts highlighted in Figure 2. No additional objects would be included in our final sample of best UCD candidates if we relaxed the color cut to a very red limit of 2.2.
The color-magnitude diagrams in Figure 3 illustrate our adopted photometric cuts as applied to the sample of objects detected in the ESO 325-G004 field. Figure 4 shows the color cuts in the versus plane for all objects with . We plot both the complete sample of objects (left panel), and the subset with SExtractor class_star parameter greater than 0.85 (very compact or stellar objects; right panel). Although we do not use class_star as a selection criterion, comparison of the plots indicates the location in this diagram of the likely GCs and UCD candidates.


3.2. Size and Shape Measurements
To measure object sizes, we used the programs Ishape (Larsen 1999) and Galfit (Peng et al. 2002) to model the 2-D profiles of objects in the very deep F814W image. Ishape is designed for modeling the light distributions of marginally resolved sources such as extragalactic GCs, while Galfit is intended for modeling resolved galaxy light distributions. It therefore seemed fitting to use both in a search for UCDs, which straddle the range between GCs and dwarf galaxies. For the Ishape fits, we used the “KING30” profile, a King (1962) model with concentration parameter , which works well for marginally resolved GCs (e.g., Larsen & Brodie 2000). For Galfit, we used a single Sérsic (1968) model, which has one more degree of freedom than KING30. Both programs are quite robust, with typical errors of 10-15% for compact but high signal-to-noise sources such as we have here (see Blakeslee et al. 2006; Barber DeGraaff et al. 2007). We fitted elliptical models, and use the circularized effective radius , where is the effective radius along the major axis, is the fitted axis ratio, and is the ellipticity.
We modeled all objects in the field with , within the color ranges given in § 3.1, and with SExtractor Kron radius pix (1 kpc). The Kron radius selection removes objects much larger than the UCD and compact elliptical candidates that we are interested in; it should not exclude any objects in Abell S0740 with Sérsic-like profiles and half light radii below 500 pc (see Graham & Driver 2005). Figure 5 shows the magnitude-size diagrams using the values from Galfit (left panel) and Ishape (right panel), converted to parsecs using the adopted distance. The two panels are similar in overall appearance, except Ishape resolves many objects with pc (0.3 pix) that are not resolved by Galfit; these are probably mainly globular clusters. In both cases, there are about a dozen bright, unresolved objects (, ) that are most likely stars.
Figure 6 shows a direct comparison of Galfit and Ishape sizes for objects with , the magnitude limit for our UCD candidate selection. To this limit, the agreement is quite good, apart from the objects unresolved by Galfit (the agreement worsens for fainter objects). Ishape does not do as well for the sizes of larger objects, because it has a limited fit radius of only a few pixels and overestimates the sizes of larger objects by about 50%. The two worst outliers among the objects that are resolved by both software packages are irregular objects: #2228 is a blended double source, and #575 is a bright clump within a larger edge-on galaxy. For the final list of object sizes, we adopted the Galfit measurement if it was greater than 2 pix (66 pc); otherwise, we used the Ishape value for .
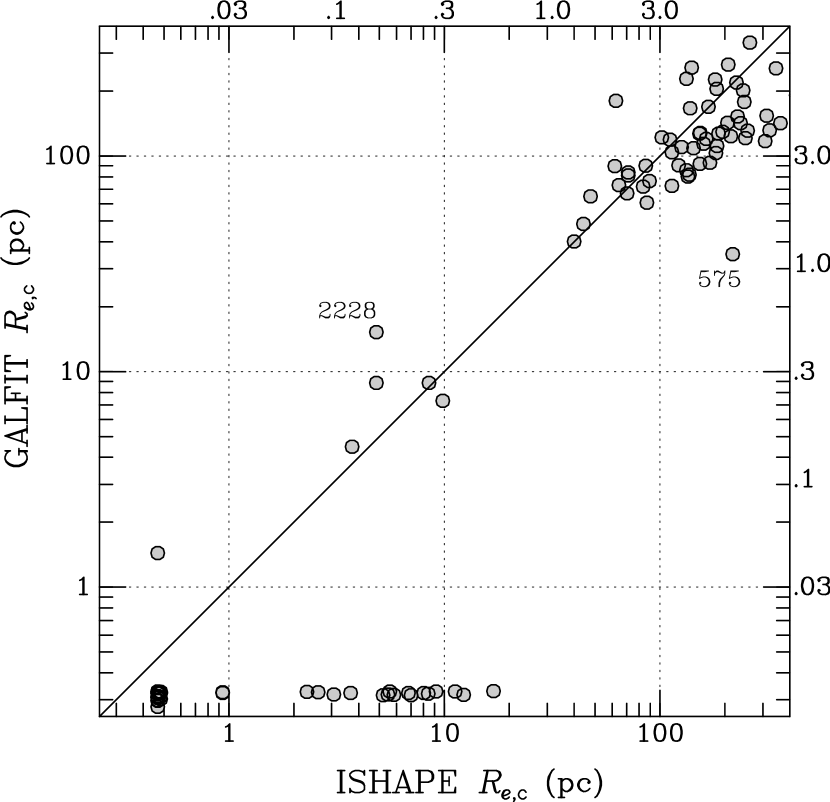
Figure 7 plots the Sérsic index against from the Galfit Sérsic model fits. Interestingly, the mean value appears to be lower for objects with pc. The biweight mean (to reduce the effect of outliers) is for objects with = 10-100 pc, and for pc, a 2.4- difference. (This includes all objects fitted by Galfit with sizes in this range, even when the Ishape model was used for the final size.) The biweight scatters in for the two groups are 0.66 and 0.51, respectively. In comparison, the median Sérsic index for the 21 Virgo and Fornax UCDs analyzed by Evstigneeva et al. (2008) was 2.2, with a large range. There is a good correspondence between Sérsic indices measured by Galfit and morphological type (Blakeslee et al. 2006). Thus, Figure 7 may indicate that the larger objects in the ESO 325-G004 field are dominated by background galaxies with exponential profiles, while the ones in the 10-100 pc range include a sizable fraction of UCDs. Follow-up spectroscopy is necessary to confirm if this is actually the case.

4. Properties of UCD candidates
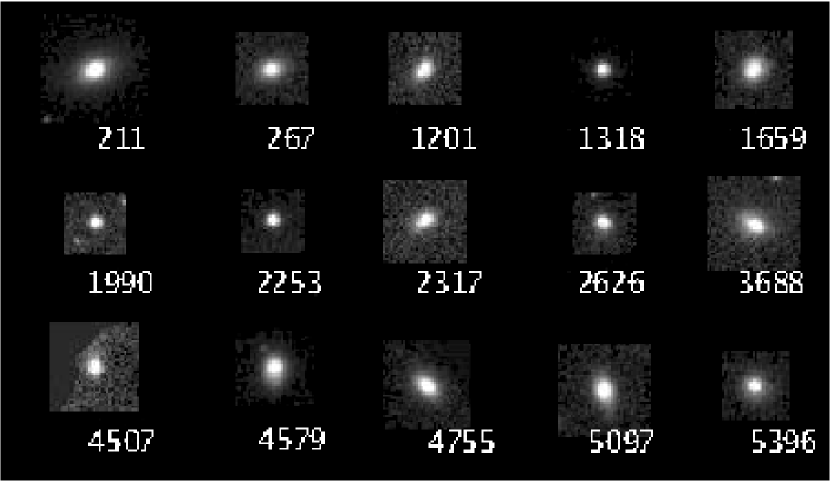
For the final sample of most likely UCD candidates, we select all objects with , , , 10 pc 100 pc, and (to eliminate disks and other very elongated objects). Cut-out images of the 15 UCDs candidates meeting these criteria are displayed in Figure 8. We removed one object, #575, from the sample because it appears to be a subclump of a very elongated galaxy (although it could be a projection). All of the remaining UCD candidates appear to be genuine compact, but nonstellar, early-type galaxies having colors consistent with being members of Abell S0740. When examined closely, many of these objects also show a faint “fuzz” of halo light at radii and surface brightness levels -24.5 mag arcsec-1, which is well in excess of PSF blurring effects.
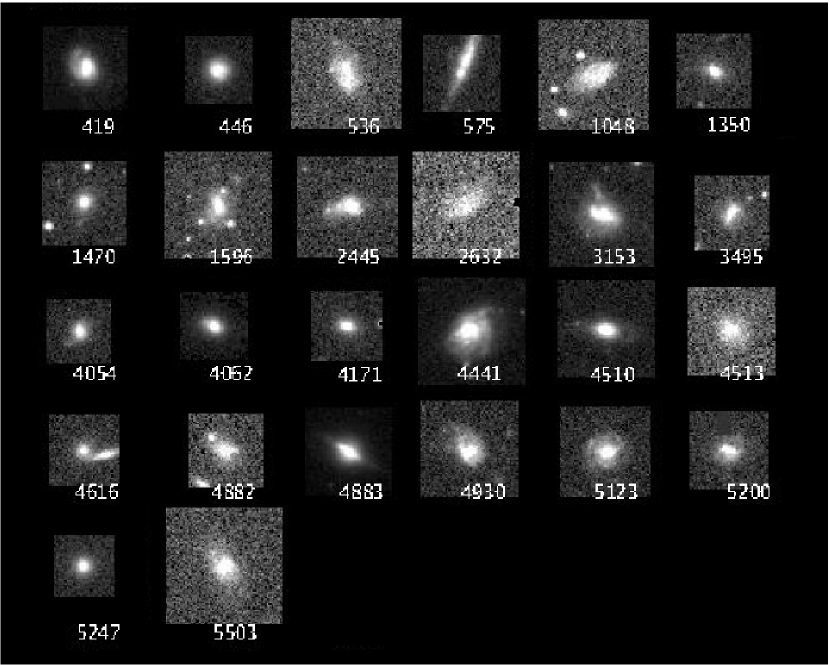
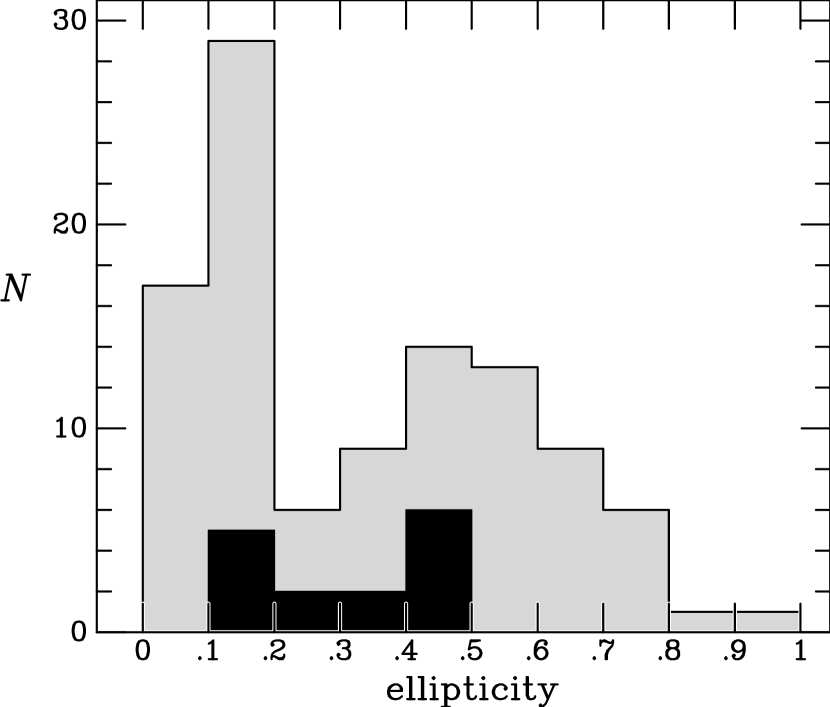
In Figure 9, we show an additional set of 26 compact galaxies meeting all of the UCD selection criteria except that they have larger sizes in the range 100-300 pc; we also include object #575 in this figure. Although some of these galaxies appear simply to be larger UCD candidates, and we label these as compact ellipticals (cE), others are irregular galaxies, and a few appear to be small background spirals. Table 1 lists the positions, magnitudes, colors, and sizes of the 41 objects in Figures 8 and 9. Magnitudes and colors are corrected for extinction as described above. The last column of Table 1 reports our classifications for these objects as UCD (all objects in Fig. 8), cE, Sp (spiral), S0 (disky galaxy without obvious spiral structure), Irr (irregular), or clump (subcomponent of an irregular or interacting system). The ellipticity distributions of the 15 UCD candidates and other objects in the field within the same magnitude and color ranges are shown in Figure 10. The UCDs have a mean and a range from 0.16 to 0.46. The UCD sample selection excludes objects with , but it is interesting that none has . This may reflect intrinsic flattening in the UCDs, since there are many objects in the larger sample that are found to have lower ellipticity values.
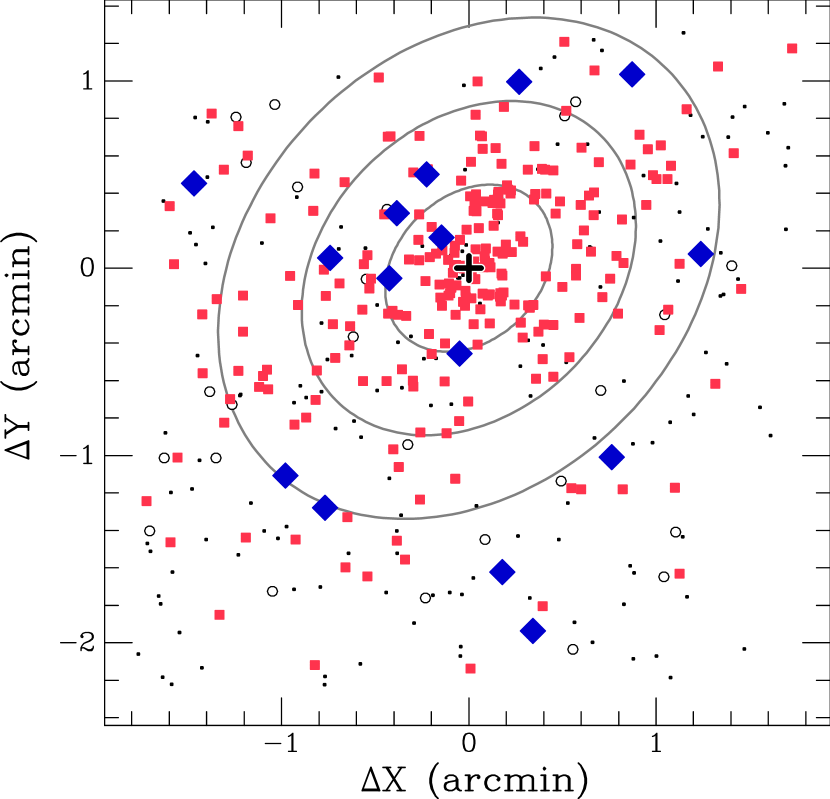
Figure 11 shows the positions of the UCD candidates, larger compact galaxies, globular clusters candidates with , and other objects in the field meeting our color and magnitude cuts. Elliptical isophotes of ESO 325-G004 are also drawn at three radii. The galaxy is very regular. It has a mean ellipticity and is oriented counter-clockwise from the direction in the observed frame, which translates to a position angle east of north of . (The errorbars reflect the rms scatter among the fitted isophotes from the galaxy modeling in Sec. 2.) A more detailed analysis of the GC population is in preparation, but we find a best-fit for the GC distribution, in close agreement with the major axis of the galaxy isophotes. It is also noteworthy that 2/3 of the UCD candidates fall along the galaxy’s major axis, within a region covering about 40% of the image. Although not statistically very significant, the UCD alignment along this direction suggests a link between the UCD and GC populations, and in turn with the stellar halo of the central elliptical. We ran a 2-D Kolmogorov-Smirnov test and found that the spatial distributions of the GCs and UCD candidates were at least consistent with being the same. It will be important to see what fraction of the UCDs lie along the major axis once a spectroscopically confirmed sample is available.
In the previous section, we examined the magnitude-size diagrams for the values measured separately by Galfit and Ishape. Figure 12 presents our final magnitude-size diagram using the merged values as described above. The UCD candidates are marked as large filled diamonds, compact sources meeting the UCD selection requirements but having in the 100-300 pc range are shown as gray circles, and all other objects that were modeled are shown as open squares. Taking the UCDs by themselves, or the sample of UCD and larger compact galaxies together, there is a weak tendency for larger objects to be brighter. Formally, our best fit relation for the UCD candidates implies , but this becomes if we omit the most compact candidate with pc. This is consistent with the better determined relation of from Evstigeeva et al. (2008) using a sample of confirmed UCDs measured at much higher physical resolution.
There is also an apparent separation in Figure 12 between the three smallest UCDs at pc and the other 12 at pc. The first group is very similar to the GCs, while the latter group appears to blend smoothly with the larger dwarf galaxies. This may indicate the presence of two distinct types of objects in our UCD candidate sample, and possibly two different origins for UCDs in general. However, there is a 17% probability of a gap as large as the observed one occurring by chance in this sample. To our knowledge, no similar gaps have been reported in previous UCD studies. Again, spectroscopic confirmation and larger samples of UCDs in diverse environments are needed to assess the possibility of two distinct populations. Figure 12 also indicates the location that M32 would have in this diagram if it were at the distance of ESO 325-G004, using data from Kent (1987). There are no objects near this position in our sample. We inspected the images visually to determine if we were somehow missing such objects in our selection. One small elliptical located 10 approximately due south of ESO 325-G004 (at the “4 o’clock” position in Fig. 1) has size and magnitude very close to the expected values for M32. However, its colors, and , are outside our selection range and indicate a higher redshift of . Thus, we find no M32-like galaxies in this Abell S0740 field.
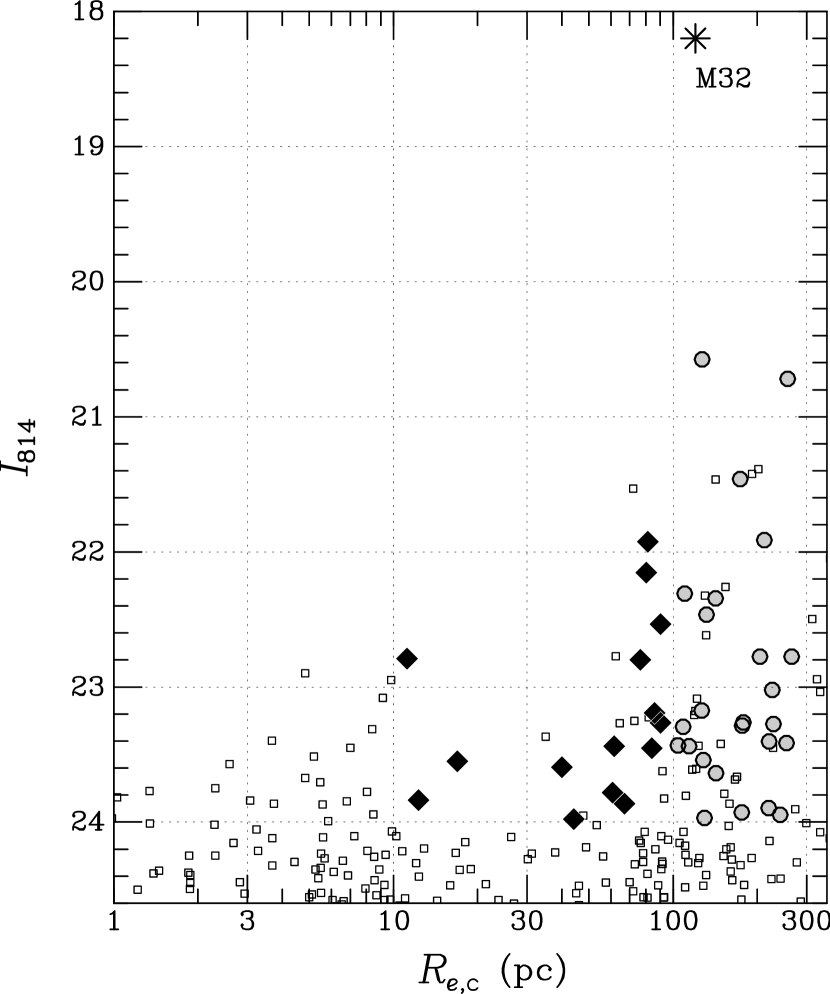
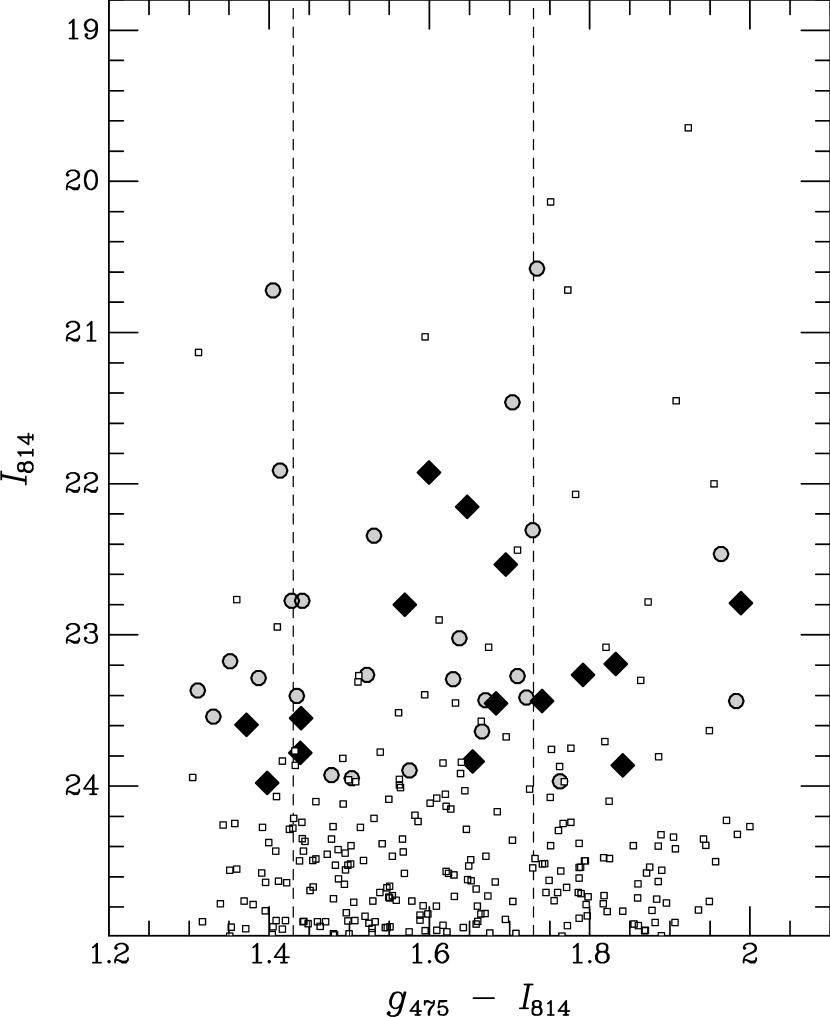
Figure 13 presents the final color-magnitude diagram for the UCD candidates, larger compact galaxies, and GC candidates. The dashed lines indicate the expected locations of the peaks typically found in GC color distributions (e.g., Peng et al. 2006). Past studies have found that UCDs tended to be slightly redder than the average for the GC population (Wehner & Harris 2007; Evstigneeva et al. 2008). Wehner & Harris described the color-magnitude sequence for their (unresolved) UCD candidates as an extension of the red GC subpopulation to higher luminosities. We also find that the UCDs in Figure 13 are weighted towards redder colors, especially the brightest ones. We note that several of the compact galaxies with pc fall intriguingly close to the expected peaks of the GC color distribution, but the interpretation for these objects is unclear until we have spectroscopic redshifts.
The coverage of our images translates to about 125125 kpc. We find that our sample of 15 UCD candidates is reasonable compared with the numbers found over similar magnitude limits in other clusters. In the Fornax cluster, only 4 objects are found within a similar radius of NGC 1399 (Mieske et al. 2004b; Jones et al. 2006). The number in Virgo is complicated by the enormous GC population around M87, and the lack of a complete high-resolution imaging survey of the core region. Jones et al. (2006) and Evstigneeva et al. (2008) indicate 5 UCDs within this distance of M87, but an additional five were found by Haşegan et al. (2005) in a physical area 70 times smaller than our own. Therefore, there may be dozens of UCDs clustered close to M87. Perhaps the most comparable survey to ours is that by Wehner & Harris (2007) who tabulated 29 UCD candidates in a 55 field in the center of the Hydra cluster, to about the same absolute magnitude limit. The physical area covered by their imaging is roughly half of ours; so, we might expect to find 60 candidates based on this extrapolation. However, Wehner & Harris used ground-based imaging and were not able to select based on objects sizes; if we had not made the lower size cut, we would have a much larger sample of 58 candidates, although the majority of these would be stars and bright GCs. We also note that our sample size is roughly comparable to the numbers within similar radii in the “Fornax” and “Virgo” numerical models presented by Bekki et al. (2003).
Finally, we provide estimates of the stellar masses of the UCD candidates and compact galaxies in Figures 8 and 9. We calculated the masses of each of the candidates using relations between mass-to-light ratio and based on the SSP models from Figure 2. The values we find for the UCD candidates range from 0.5 to 3.5, which are likely uncertain by about 30-50%, based on the scatter in the models. The same uncertainty is inherent in the stellar mass estimates, which we give in Table 1. The values for the UCD candidates range from to , with a median of . This agrees well with the dynamically derived masses of (2-9) from Evstigneeva et al. 2007a, a range that includes 73% of our candidates. Similarly, Hilker et al. (2007) found dynamical masses of 1.8 to for five bright Fornax UCDs. The two objects with the largest masses in Table 1 (#419 and #4883) have values too large for inclusion in the UCD sample, and both have structure indicating they are probably background objects (see Fig. 9). We conclude that our mass estimates are reasonable for UCDs.
5. Summary
We have presented an analysis of three-band ACS/WFC imaging to search for possible UCDs near the lensing galaxy ESO 325-G004 in Abell S0740. This is an interesting target for a UCD search because it is a massive central elliptical in a poor cluster environment with a velocity dispersion similar to that of Fornax. We selected objects based on their having magnitudes brighter than 99% of the expected GCs population, color appropriate for an early-type or population II system at this redshift, ellipticity less than 0.5, and circular half-light radii in the 10-100 pc range. The radii were measured using both the Galfit and Ishape programs. We found 15 good UCD candidates meeting the selection criteria, comparable to the expectations from previous searches.
In addition, we presented a sample of larger compact galaxies with radii in the range 100-300 pc, if they are located within the cluster. These objects appear to be a mix of irregular background galaxies and larger versions of the cluster UCDs. We did not find any counterparts of M32 in this field. The mean Sérsic index for the UCD candidates is around 1.5, which is marginally higher than the value 1 found for the larger compact galaxies. This may indicate that the latter objects are dominated by background disk-like galaxies, while the former group is mainly comprised of UCDs in the cluster. Most of the UCD candidates and larger compact galaxies have visible surrounding halo light, consistent with galaxy threshing models. There is also evidence that most UCDs are intrinsically flattened, as none of the 15 UCD candidates has a fitted ellipticity .
The magnitude-size and color-magnitude diagrams show general continuity in the distributions of these parameters from GCs to the UCDs candidates. For our limited sample of UCD candidates, we find . This is an intriguing proportionality, as it implies a roughly constant surface brightness for UCDs of different sizes. The better determined relation from Evstigneeva et al. (2008) is somewhat steeper, but consistent within the errors. There may be a bifurcation in the UCDs between those with sizes similar to GCs and larger ones with pc, suggesting different origins for these two groups. However, because of the small number of objects, the significance of the observed gap in is only 83%. Therefore, although suggestive, it remains inconclusive. The colors of UCD candidates are weighted towards the red compared to the expected GC color distribution. Several of the bright compact galaxies with sizes in the 100-300 pc range have colors near the expected peaks of the GC color distribution. It would be useful to know if these objects are also in the cluster, and what may be their relation to the UCDs.
The majority of UCD candidates align along the major axis of ESO 325-G004, similar to the spatial distribution of the bright GCs. Because of the small numbers involved, this result is not highly significant, but follow-up spectroscopy can provide a confirmed sample of UCDs; it will be interesting to see if these are mainly along the galaxy’s major axis. These findings may appear to support a scenario in which the UCDs are the high-luminosity extension of the GC system. However, as discussed in the Introduction, the true situation is probably more complex, and many red GCs may actually have their origin as stripped nucleated dwarfs, clouding the distinction between the main UCD formation scenarios. It would be useful to discover how the number of UCDs in complete surveys of many different clusters scales with the GC population of the central galaxy. We are currently completing a more detailed analysis of the GC population in this cluster and other similar fields from the same HST program. We also plan to obtain spectroscopy for all our UCD candidates to see what fraction of them are indeed associated with ESO 325-G004. The additional information from these studies should provide further insight into the origin of UCDs and their connection to the GC populations.
References
- Abell (1958) Abell, G. O. 1958, ApJS, 3, 211
- Abell et al. (1989) Abell, G. O., Corwin, H. G., Jr., & Olowin, R. P. 1989, ApJS, 70, 1
- Barber DeGraaff et al. (2007) Barber DeGraaff, R., Blakeslee, J. P., Meurer, G. R., & Putman, M. E. 2007, ApJ, 671, 1624
- Bassino et al. (1994) Bassino, L. P., Muzzio, J. C., & Rabolli, M. 1994, ApJ, 431, 634
- Bekki (2007) Bekki, K. 2007, MNRAS, 380, 1177
- Bekki et al. (2001) Bekki, K., Couch, W. J., & Drinkwater, M. J. 2001, ApJ, 552, L105
- Bekki et al. (2003) Bekki, K., Couch, W. J., Drinkwater, M. J., & Shioya, Y. 2003, MNRAS, 344, 399
- Benítez et al. (2004) Benítez, N., et al. 2004, ApJS, 150, 1
- Bertin & Arnouts (1996) Bertin, E., & Arnouts, S. 1996, A&AS, 117, 393
- Blakeslee (2007) Blakeslee, J. P. 2007, Cosmic Frontiers, ASP Conference Series, 379, 99
- Blakeslee et al. (2003) Blakeslee, J. P., Anderson, K. R., Meurer, G. R., Benítez, N., & Magee, D. 2003, Astronomical Data Analysis Software and Systems XII, 295, 257
- Blakeslee et al. (2006) Blakeslee, J. P., et al. 2006, ApJ, 644, 30
- Bruzual & Charlot (2003) Bruzual, G. & Charlot, S. 2003, MNRAS, 344, 1000
- Côté et al. (2006) Côté, P., et al. 2006, ApJS, 165, 57
- Drinkwater et al. (2003) Drinkwater, M. J., Gregg, M. D., Hilker, M., Bekki, K., Couch, W. J., Ferguson, H. C., Jones, J. B., & Phillipps, S. 2003, Nature, 423, 519
- Drinkwater et al. (2000) Drinkwater, M. J., Jones, J. B., Gregg, M. D., & Phillipps, S. 2000, PASA, 17, 227
- Evstigneeva et al. (2007a) Evstigneeva, E. A., Drinkwater, M. J., Jurek, R., Firth, P., Jones, J. B., Gregg, M. D., & Phillipps, S. 2007a, MNRAS, 378, 1036
- Evstigneeva et al. (2007b) Evstigneeva, E. A., Gregg, M. D., Drinkwater, M. J., & Hilker, M. 2007b, AJ, 133, 1722
- Evstigneeva et al. (2008) Evstigneeva, E. A., et al. 2008, AJ, 136, 461
- Fellhauer & Kroupa (2002) Fellhauer, M. & Kroupa, P. 2002, MNRAS, 330, 642
- Goerdt et al. (2008) Goerdt, T., Moore, B., Kazantzidis, S., Kaufmann, T., Macciò, A. V., & Stadel, J. 2008, MNRAS, 385, 2136
- Graham & Driver (2005) Graham, A. W., & Driver, S. P. 2005, PASA, 22, 118
- Haşegan et al. (2005) Haşegan, M., et al. 2005, ApJ, 627, 203
- Hilker et al. (2007) Hilker, M., Baumgardt, H., Infante, L., Drinkwater, M., Evstigneeva, E., & Gregg, M. 2007, A&A, 463, 119
- Hilker et al. (1999) Hilker, M., Infante, L., Vieira, G., Kissler-Patig, M., & Richtler, T. 1999, A&AS, 134, 75
- Jones et al. (2006) Jones, J. B., et al. 2006, AJ, 131, 312
- Jordán et al. (2004) Jordán, A., Blakeslee, J. P., Peng, E. W., Mei, S., Côté, P., Ferrarese, L., Tonry, J. L., Merritt, D., Milosavljević, M., & West, M. J. 2004, ApJS, 154, 509
- Kent (1987) Kent, S. M. 1987, AJ, 94, 306
- King (1962) King, I. 1962, AJ, 67, 471
- Larsen (1999) Larsen, S. S. 1999, A&AS, 139, 393
- Larsen & Brodie (2000) Larsen, S. S., & Brodie, J. P. 2000, AJ, 120, 2938
- Mieske et al. (2002) Mieske, S., Hilker, M., & Infante, L. 2002, A&A, 383, 823
- Mieske et al. (2004b) Mieske, S., Hilker, M., & Infante, L. 2004b, A&A, 418, 445
- Mieske et al. (2006) Mieske, S., Hilker, M., Infante, L., & Jordán, A. 2006, AJ, 131, 2442
- Mieske et al. (2007) Mieske, S., Hilker, M., Jordán, A., Infante, L., & Kissler-Patig, M. 2007, A&A, 472, 111
- Mieske et al. (2004a) Mieske, S., et al. 2004a, AJ, 128, 1529
- Peng, Ho, Impey, & Rix (2002) Peng, C. Y., Ho, L. C., Impey, C. D., & Rix, H. 2002, AJ, 124, 266
- Peng et al. (2006) Peng, E. W., Jordán, A., Côté, P., Blakeslee, J P., Ferrarese, L., Mei, S., West, M. J., Merritt, D., Milosavljević, M., & Tonry, J. L. 2006, ApJ, 639, 95
- Phillipps et al. (2001) Phillipps, S., Drinkwater, M. J., Gregg, M. D., & Jones, J. B. 2001, ApJ, 560, 201
- Schlegel et al. (1998) Schlegel, D. J., Finkbeiner, D. P., & Davis, M. 1998, ApJ, 500, 525
- Sersic (1968) Sérsic, J. L. 1968, Atlas de Galaxias Australes (Cordoba: Observatorio Astronomico)
- Sirianni et al. (2005) Sirianni, M., et al. 2005, PASP, 117, 1049
- Smith et al. (2005) Smith, R. J., Blakeslee, J. P., Lucey, J. R., & Tonry, J. 2005, ApJ, 625, L103
- Spergel et al. (2007) Spergel, D. N., et al. 2007, ApJS, 170, 377
- Thomas et al. (2008) Thomas, P. A., Drinkwater, M. J., & Evstigneeva, E. 2008, MNRAS, 389, 102
- Tonry et al. (1997) Tonry, J. L., Blakeslee, J. P., Ajhar, E. A., & Dressler, A. 1997, ApJ, 475, 399
- Wehner & Harris (2007) Wehner, E. M. H. & Harris, W. E. 2007, ApJ, 668, L35
| ID | RA | Dec | aaAxis ratio measured by SExtractor; no PSF correction. | bbIntrinsic axis ratio from our 2-D modeling with PSF correction. | ccFitted circularized effective radius | MassddPhotometrically derived stellar mass estimate. | typeeeMorphological type from our visual inspection. All objects in Fig. 8 are type UCD; see text for further details. | ||||||
|---|---|---|---|---|---|---|---|---|---|---|---|---|---|
| (J2000) | (J2000) | (pc) | () | ||||||||||
| 211 | 205.86130 | -38.18323 | 21.926 | 0.011 | 0.497 | 0.015 | 1.599 | 0.019 | 0.67 | 0.62 | 81.3 | 8.7e+07 | UCD |
| 267 | 205.86669 | -38.17410 | 23.438 | 0.014 | 0.631 | 0.029 | 1.740 | 0.043 | 0.75 | 0.68 | 61.6 | 3.4e+07 | UCD |
| 419 | 205.86652 | -38.17941 | 21.461 | 0.011 | 0.498 | 0.014 | 1.704 | 0.018 | 0.82 | 0.80 | 173.6 | 1.9e+08 | Sp |
| 446 | 205.87906 | -38.15454 | 22.343 | 0.012 | 0.510 | 0.017 | 1.531 | 0.022 | 0.97 | 0.96 | 141.9 | 4.6e+07 | S0 |
| 536 | 205.88198 | -38.15171 | 23.273 | 0.019 | 0.734 | 0.048 | 1.710 | 0.056 | 0.66 | 0.57 | 228.7 | 3.6e+07 | Irr |
| 575 | 205.86844 | -38.17896 | 23.368 | 0.017 | 0.829 | 0.042 | 1.311 | 0.038 | 0.69 | 0.93 | 35.0 | 8.0e+06 | clump |
| 1048 | 205.88637 | -38.15403 | 23.403 | 0.020 | 0.829 | 0.048 | 1.434 | 0.045 | 0.57 | 0.56 | 220.3 | 1.2e+07 | Irr |
| 1201 | 205.88024 | -38.16939 | 23.780 | 0.018 | 0.680 | 0.036 | 1.439 | 0.042 | 0.72 | 0.58 | 60.8 | 8.6e+06 | UCD |
| 1318 | 205.89067 | -38.15035 | 22.791 | 0.012 | 0.747 | 0.027 | 1.988 | 0.030 | 0.92 | 0.84 | 11.2 | 1.2e+08 | UCD |
| 1350 | 205.88684 | -38.15907 | 23.433 | 0.017 | 0.825 | 0.038 | 1.670 | 0.049 | 0.71 | 0.56 | 104.0 | 2.8e+07 | cE |
| 1470 | 205.87982 | -38.17601 | 23.175 | 0.019 | 0.490 | 0.031 | 1.351 | 0.037 | 0.72 | 0.82 | 126.7 | 1.1e+07 | cE |
| 1596 | 205.88554 | -38.16720 | 23.022 | 0.018 | 0.610 | 0.031 | 1.637 | 0.045 | 0.60 | 0.56 | 226.5 | 3.6e+07 | Irr |
| 1659 | 205.88557 | -38.16813 | 23.265 | 0.015 | 0.829 | 0.030 | 1.792 | 0.041 | 0.87 | 0.81 | 90.3 | 4.7e+07 | UCD |
| 1990 | 205.88631 | -38.17262 | 23.837 | 0.017 | 0.567 | 0.033 | 1.654 | 0.042 | 0.96 | 0.81 | 12.3 | 1.8e+07 | UCD |
| 2253 | 205.87746 | -38.19469 | 23.551 | 0.014 | 0.522 | 0.027 | 1.440 | 0.034 | 0.99 | 0.83 | 16.9 | 1.1e+07 | UCD |
| 2317 | 205.89302 | -38.16406 | 23.863 | 0.019 | 0.655 | 0.037 | 1.841 | 0.060 | 0.71 | 0.55 | 67.1 | 3.1e+07 | UCD |
| 2445 | 205.87746 | -38.19764 | 23.264 | 0.018 | 0.579 | 0.032 | 1.522 | 0.045 | 0.53 | 0.58 | 178.2 | 1.9e+07 | Irr |
| 2626 | 205.89274 | -38.16961 | 23.594 | 0.016 | 0.660 | 0.031 | 1.372 | 0.034 | 0.88 | 0.70 | 40.0 | 7.9e+06 | UCD |
| 2632 | 205.89377 | -38.16771 | 23.947 | 0.033 | 0.876 | 0.087 | 1.503 | 0.093 | 0.51 | 0.56 | 241.5 | 9.5e+06 | Irr |
| 3153 | 205.88536 | -38.19365 | 21.912 | 0.012 | 0.499 | 0.016 | 1.413 | 0.020 | 0.87 | 0.66 | 211.8 | 4.4e+07 | Irr |
| 3495 | 205.90039 | -38.16848 | 23.638 | 0.021 | 0.692 | 0.043 | 1.665 | 0.059 | 0.73 | 0.59 | 142.2 | 2.3e+07 | Irr |
| 3688 | 205.89787 | -38.17786 | 22.535 | 0.015 | 0.640 | 0.022 | 1.695 | 0.034 | 0.77 | 0.54 | 90.2 | 6.9e+07 | UCD |
| 4054 | 205.89599 | -38.19076 | 23.541 | 0.018 | 0.549 | 0.033 | 1.330 | 0.041 | 0.75 | 0.80 | 128.1 | 7.2e+06 | Sp |
| 4062 | 205.91205 | -38.15832 | 22.308 | 0.011 | 0.554 | 0.022 | 1.729 | 0.024 | 0.76 | 0.65 | 109.9 | 9.4e+07 | cE |
| 4171 | 205.91251 | -38.16059 | 23.294 | 0.015 | 0.513 | 0.037 | 1.630 | 0.042 | 0.73 | 0.62 | 108.6 | 2.7e+07 | cE |
| 4441 | 205.90959 | -38.17646 | 20.721 | 0.010 | 0.531 | 0.012 | 1.405 | 0.013 | 0.78 | 0.76 | 257.2 | 1.3e+08 | Sp/Irr |
| 4507 | 205.90258 | -38.19380 | 23.979 | 0.020 | 0.664 | 0.044 | 1.397 | 0.052 | 0.68 | 0.54 | 44.1 | 6.1e+06 | UCD |
| 4510 | 205.91878 | -38.16098 | 22.464 | 0.012 | 0.795 | 0.029 | 1.964 | 0.035 | 0.50 | 0.56 | 131.6 | 1.5e+08 | cE |
| 4513 | 205.92092 | -38.15667 | 23.897 | 0.028 | 0.543 | 0.075 | 1.575 | 0.083 | 0.85 | 0.89 | 219.5 | 1.3e+07 | Irr |
| 4579 | 205.91782 | -38.16729 | 22.154 | 0.011 | 0.767 | 0.017 | 1.647 | 0.020 | 0.76 | 0.77 | 80.2 | 8.3e+07 | UCD |
| 4616 | 205.90719 | -38.19038 | 23.969 | 0.026 | 0.625 | 0.055 | 1.763 | 0.084 | 0.85 | 0.90 | 129.3 | 2.3e+07 | clump |
| 4755 | 205.91962 | -38.17162 | 22.799 | 0.012 | 0.534 | 0.020 | 1.569 | 0.028 | 0.73 | 0.54 | 76.4 | 3.5e+07 | UCD |
| 4882 | 205.92918 | -38.15779 | 23.928 | 0.025 | 0.509 | 0.065 | 1.478 | 0.069 | 0.79 | 0.76 | 175.8 | 8.8e+06 | Irr |
| 4883 | 205.90786 | -38.20153 | 20.577 | 0.010 | 0.709 | 0.012 | 1.734 | 0.013 | 0.69 | 0.54 | 127.1 | 4.7e+08 | S0 |
| 4930 | 205.91646 | -38.18593 | 22.775 | 0.015 | 0.512 | 0.024 | 1.441 | 0.031 | 0.73 | 0.82 | 204.4 | 2.2e+07 | Irr |
| 5097 | 205.91919 | -38.18841 | 23.193 | 0.014 | 0.860 | 0.030 | 1.832 | 0.042 | 0.64 | 0.59 | 85.9 | 5.6e+07 | UCD |
| 5123 | 205.91309 | -38.20199 | 22.776 | 0.015 | 0.773 | 0.029 | 1.428 | 0.033 | 0.90 | 0.90 | 265.8 | 2.1e+07 | Sp |
| 5200 | 205.93059 | -38.16994 | 23.284 | 0.017 | 0.863 | 0.054 | 1.387 | 0.040 | 0.84 | 0.62 | 176.4 | 1.1e+07 | Irr |
| 5247 | 205.92507 | -38.18285 | 23.438 | 0.017 | 0.693 | 0.045 | 1.983 | 0.061 | 0.93 | 0.98 | 114.0 | 6.5e+07 | cE |
| 5396 | 205.92415 | -38.19283 | 23.454 | 0.014 | 0.544 | 0.036 | 1.683 | 0.042 | 0.92 | 0.83 | 83.9 | 2.8e+07 | UCD |
| 5503 | 205.92445 | -38.19675 | 23.414 | 0.023 | 0.489 | 0.056 | 1.721 | 0.071 | 0.66 | 0.72 | 254.5 | 3.3e+07 | Irr |