The Chandra Deep Protocluster Survey: Evidence for an Enhancement of AGN Activity in the SSA22 Protocluster at = 3.09
Abstract
We present results from a new ultra-deep 400 ks Chandra observation of the SSA22 protocluster at . We have studied the X-ray properties of 234 Lyman break galaxies (LBGs; protocluster and field) and 158 Ly emitters (LAEs) in SSA22 to measure the influence of the high-density protocluster environment on the accretion activity of supermassive black holes (SMBHs) in these UV-selected star forming populations. We detect individually X-ray–emission from active galactic nuclei (AGNs) in six LBGs and five LAEs; due to small overlap between the LBG and LAE source population, ten of these sources are unique. At least six and potentially eight of these sources are members of the protocluster. These sources have rest-frame 8–32 keV luminosities in the range of (3–50) ergs s-1 and an average observed-frame 2–8 keV to 0.5–2 keV band-ratio of 0.8 (mean effective photon index of 1.1), suggesting significant absorption columns of – cm-2. We find that the fraction of LBGs and LAEs in the protocluster harboring an AGN with ergs s-1 is % and %, respectively. These AGN fractions are somewhat larger (by a mean factor of ; significant at the 95% confidence level) than sources found in lower-density “field” environments. Theoretical models imply that these results may be due to the presence of more actively growing and/or massive SMBHs in LBGs and LAEs within the protocluster compared to the field. Such a result is expected in a scenario where enhanced merger activity in the protocluster drives accelerated galaxy and SMBH growth at 2–3. Using Spitzer IRAC imaging we found that the fraction of IRAC detected LBGs is significantly larger in the protocluster than in the field (by a factor of 3.0). From these data, we constrained the median rest-frame -band luminosity in the protocluster to be 1.2–1.8 times larger than that for the field. When combined with our X-ray data, this suggests that both galaxies and SMBHs grew more rapidly in protocluster environments.
Subject headings:
cosmology: observations — early universe — galaxies: active — galaxies: clusters: general — surveys — X-rays: general1. Introduction
Over the last decade, investigations have revealed that galaxies with spheroid components (i.e., elliptical galaxies, lenticulars, and spiral galaxy bulges) ubiquitously contain supermassive black holes (SMBHs) in their cores (e.g., Kormendy & Richstone 1995; Magorrian et al. 1998). These studies have also confirmed the existence of a tight relationship between the mass of the SMBHs and the stellar mass of the spheroid, suggesting a causal connection between the growth of these two galactic components (e.g., Gebhardt et al. 2000).
In addition, theories of large-scale structure formation in a CDM Universe predict that galaxy formation is accelerated in high-density regions (Kauffmann 1996; de Lucia et al. 2006). Observational studies have provided convincing support for this hypothesis, showing that there is a strong relationship between galaxy stellar age and local environment in the nearby universe (e.g., Smith et al. 2008 and references therein); the most evolved and massive galaxies reside in the highest density regions of local clusters, while more typical galaxies that are undergoing significant star formation are generally found in lower density environments (e.g., Lewis et al. 2002). Studies of distant galaxy populations at 1 are finding that the star-formation activity occurs in higher density environments than seen locally (e.g., Geach et al. 2006; Elbaz et al. 2007; Heinis et al. 2007; Cooper et al. 2008; Poggianti et al. 2008). These studies indicate that a reversal in the star-formation rate (SFR)/galaxy density relation occurs at , where the most intense galaxy growth is expected to occur in the highest density clusters.
The progenitors of the highest density clusters in the local universe are also expected to be the highest density structures at 2–3 and should be undergoing vigorous star formation during their assemblage (e.g., Governato et al. 1998). These protoclusters are identified through overdense redshift “spikes” in high-redshift galaxy surveys of blank fields (e.g., Adelberger et al. 1998; Steidel et al. 2003) and in the vicinity of certain powerful radio galaxies (e.g., Venemans et al. 2007). It is therefore plausible to expect that if the growth of galaxies and their central SMBHs are causally linked, then the highest density structures will also be the sites of significant SMBH accretion, identifiable as active galactic nuclei (AGNs).
To detect and study typical AGN ( ergs s-1) in 2–3 protocluster galaxies requires significant optical spectroscopic and X-ray observational investments. Therefore, few programs have yet explored how AGN activity varies as a function of environment at these redshifts. Nonetheless, initial studies of high-density regions and clusters in the 0.5–3 universe have provided suggestive evidence for an elevation in the AGN activity in such high-density environments compared to the field (see, e.g., Pentericci et al. 2002; Gilli et al. 2003; Johnson et al. 2003; Smail et al. 2003; Croft et al. 2005; Eastman et al. 2007; Silverman et al. 2008). However, a rigorous quantification of such an enhancement in AGN activity has yet to be obtained for actively forming protoclusters that are precursors to rich clusters at .
The SSA22 protocluster was originally identified by Steidel et al. (1998) as a significantly overdense region (by a factor of 4–6) through spectroscopic follow-up observations of candidate Lyman break galaxies (LBGs). Theoretical modelling indicates that the protocluster should collapse into a structure resembling a rich local cluster with a total mass (e.g., Coma; see Steidel et al. 1998 for details). Since its discovery, the protocluster has been found to contain a factor of 6 overdensity of Ly emitters (LAEs; Steidel et al. 2000; Hayashino et al. 2004; Matsuda et al. 2005) and several remarkable bright extended Ly-emitting blobs (LABs; Steidel et al. 2000; Matsuda et al. 2004), which are hypothesized to be sites of either cooling flows or starburst/AGN outflows (e.g., Bower et al. 2004; Geach et al. 2005, Wilman et al. 2005; Geach et al. in preparation). Therefore, SSA22 is an ideal field for studying how SMBH growth depends on environment in the 2–3 universe.
In this paper, we utilize new ultra-deep 400 ks Chandra observations of the SSA22 protocluster region to identify luminous AGNs indicative of accreting SMBHs. We use this data to place constraints on how the AGN properties (e.g., luminosity and X-ray spectra) and frequency in the protocluster compares with AGNs identified in lower density field regions of the Chandra Deep Field-North (CDF-N) and Extended Chandra Deep Field-South (E-CDF-S). The Galactic column density for SSA22 is cm-2 (Stark et al. 1992). All X-ray fluxes and luminosities quoted in this paper have been corrected for Galactic absorption. The coordinates throughout this paper are J2000.0. = 70 km s-1 Mpc-1, = 0.3, and = 0.7 are adopted (e.g., Spergel et al. 2003), which give the age of the Universe as 13.5 Gyr and imply a look-back time and spatial scale of 11.4 Gyr and 7.6 kpc arcsec-1, respectively.
2. Chandra Observations
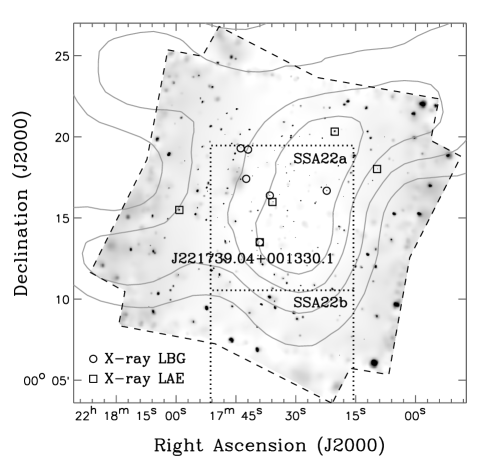
We obtained a 400 ks Chandra exposure consisting of four ACIS-I pointings (Chandra Obs-IDs 8034, 8035, 8036, and 9717 [taken between 01 Oct 2007 and 30 Dec 2007]; PI: D. M. Alexander) centered on the SSA22a LBG region surveyed by Steidel et al. (2003; see Fig. 1).111We note that the 79 ks ACIS-S exposure (Obs-ID 1694 [taken on 10 Jul 2001]; PI: G. P. Garmire) was not merged with our ACIS-I observations since, due to non negligible differences in aim points and backgrounds, it did not improve data quality or the number of Chandra source detections. We note that the SSA22a region represents a high-density pocket of the whole SSA22 protocluster at 3.06–3.12, which is known to extend to scales much larger (1 deg2) than the SSA22a LBG survey region as well as the region covered by our Chandra observations (Yamada et al. in preparation). Due to small variations in the aim points and roll angles of the observations, the total exposure covers a solid angle of 330 arcmin2 with more than 60% of the field reaching effective vignetting-corrected exposures 300 ks.
Chandra X-ray Center (hereafter CXC) pipeline software was used for basic data processing, and the pipeline version 7.6.11 was used in all observations. The reduction and analysis of the data used Chandra Interactive Analysis of Observations (CIAO) Version 3.4 tools whenever possible;222See http://cxc.harvard.edu/ciao/ for details on CIAO. however, custom software, including the Tools for ACIS Real-time Analysis (TARA; Broos et al. 2000) software package,333TARA is available at http://www.astro.psu.edu/xray/docs. were also used extensively. The details of our data processing procedure have been outlined in 2.2 of Luo et al. (2008).
We have compiled Chandra point-source catalogs, which were generated by running wavdetect at a false-positive probability threshold of 10-5 over three standard bandpasses: 0.5–8 keV (full band; FB), 0.5–2 keV (soft band; SB), and 2–8 keV (hard band; HB). The significance of each source was then individually analyzed using the ACIS EXTRACT software package (Broos et al. 2002) and our source list was then filtered to include only sources that had high statistical probabilities (99% confidence) of being true sources considering their local backgrounds.
In total, our final point-source catalog contained 297 X-ray point sources over the entire field, and these sources were used in our analysis below. The survey reaches ultimate sensitivity limits of 4.8 ergs cm-2 s-1 and 2.7 ergs cm-2 s-1 for the 0.5–2 keV and 2–8 keV bands, respectively; at , these limits correspond to rest-frame 2–8 keV and 8–32 keV luminosities of 3.7 ergs s-1 and 2.1 ergs s-1, respectively. Number count analyses show that the Chandra source density for the SSA22 field is consistent with the CDF-N and CDF-S surveys (see, e.g., Alexander et al. 2003; Bauer et al. 2004; Luo et al. 2008).
In a subsequent paper (Lehmer et al. in preparation) we will provide full details regarding our Chandra data analyses and point-source catalog production; data products and Chandra point-source catalogs will be made publicly available.
| Source Name | Band Ratio | Optical | ||||||
| Survey Field | (J2000.0) | (arcsec) | (2–8 keV)/(0.5–2 keV) | ( ergs s-1) | ( ergs s-1) | Classification | ||
| (1) | (2) | (3) | (4) | (5) | (6) | (7) | (8) | (9) |
| X-ray–Detected Lyman Break Galaxies ( 2–3.4) | ||||||||
| SSA22 ………………… | J221722.25+001640.6 | 0.67 | 3.353 | 0.78 | 1.13 | 44.07 | 44.58 | QSO |
| J221736.51+001622.9 | 0.52 | 3.084 | 0.80 | 1.11 | 43.51 | 44.03 | QSO | |
| J221739.04+001330.1 | 0.91 | 3.091 | 1.83 | 0.42 | 43.08 | 44.01 | Gal, LAB2a | |
| J221741.97+001912.8 | 0.58 | 3b | 1 | 1.4c | 43.12 | 43.73 | ||
| J221742.43+001724.6 | 0.87 | 3b | 1.48 | 0.60 | 42.82 | 43.59 | ||
| J221743.82+001917.4 | 0.32 | 2.857 | 1.33 | 0.68 | 43.31 | 44.10 | Gal | |
| CDF-N ………………… | J123622.63+621306.4 | 0.47 | 2.981 | 0.76 | 1.17 | 42.66 | 43.25 | Gal |
| J123633.53+621418.3 | 0.35 | 3.413 | 0.41 | 1.74 | 43.61 | 43.86 | QSO | |
| J123644.11+621311.2 | 0.87 | 2.929 | 1 | 1.4c | 42.29 | 43.01 | Gal | |
| J123651.56+621042.2 | 0.91 | 2.975 | 1.31 | 0.68 | 42.23 | 43.01 | Gal | |
| J123655.77+621201.1 | 0.29 | 3b | 0.48 | 1.60 | 42.99 | 43.32 | ||
| J123702.58+621244.3 | 0.54 | 3b | 0.39 | 1.78 | 43.25 | 43.47 | ||
| J123704.31+621446.5 | 0.13 | 2.211 | 1.93 | 0.33 | 42.03 | 42.98 | AGN | |
| J123719.88+620955.2 | 0.16 | 2.647 | 0.71 | 1.24 | 43.64 | 44.19 | AGN | |
| X-ray–Detected Ly Emitters () | ||||||||
| SSA22 ………………… | J221709.64+001800.7 | 0.91 | 3.106 | 0.86 | 1.05 | 43.52 | 44.06 | Gal |
| J221720.24+002019.1 | 0.13 | 3.105 | 0.42 | 1.68 | 44.20 | 44.35 | Gal | |
| J221735.86+001559.1 | 0.34 | 3.094 | 0.78 | 1.13 | 43.62 | 44.13 | Gal, LAB14 | |
| J221739.04+001330.1 | 0.91 | 3.091 | 1.83 | 0.42 | 43.08 | 44.01 | Gal, LAB2a | |
| J221759.19+001529.4 | 0.69 | 3.096 | 0.66 | 1.28 | 43.75 | 44.17 | Gal, LAB3 | |
| E-CDF-S ……………… | J033307.61275127.0 | 0.00 | 1.6 | 0.42 | 1.67 | 44.58 | 44.78 | AGN |
| J033316.86280105.2 | 0.40 | 3.1 | 2.48 | 0.04 | 43.25 | 44.43 | AGN | |
NOTES.— Col.(1): Chandra survey field where each source was detected. Col.(2): Chandra source name. Col.(3): Matching offset between optical and Chandra source positions in arcseconds. Col.(4): Best available redshift for each source. Col.(5): Observed-frame 2–8 keV to 0.5–2 keV band ratio. Col.(6): Inferred effective photon index (). Col.(7)–(8): Logarithm of the rest-frame 2–8 keV and 8–32 keV luminosity in units of ergs s-1. Col.(9): Notes on optical spectroscopic source types from Steidel et al. (2003) for the SSA22 and CDF-N LBGs, Matsuda et al. (2005) for the SSA22 LAEs and Gronwall et al. (2007) for the E-CDF-S LAEs. We have also noted known LAEs that host Ly–emitting blobs (LABs; see Geach et al. in preparation).
a Denotes duplicate LBG and LAE.
b Redshift of was assumed for all LBG candidates that did not have a spectroscopic counterpart.
c Sources that were detected in only the 0.5–8 keV bandpass were assumed to have an effective photon-index of .
3. Sample Generation and X-ray Matching
3.1. Selection of SSA22 and Field Comparison Samples
We began by assembling samples of LBGs and LAEs that lie within the Chandra-observed region of the SSA22 protocluster (hereafter, SSA22 samples). For the LBG sample, we utilized the “SSA22a” and “SSA22b” -dropout source list provided by Steidel et al. (2003). In total, 234 LBGs lie within the 400 ks Chandra SSA22 observations in an 122 arcmin2 region (see Fig. 1 and Lehmer et al. in preparation). These LBGs have -band magnitudes ranging from 20.8 to 25.6 (median ). Of the 234 SSA22 LBGs, 107 (46%) have spectroscopic redshifts from Steidel et al. (2003), 27 (25%) of which are within the redshift bounds 3.06–3.12, which we consider to be members of the protocluster (see Matsuda et al. 2005 for justification). We note that the redshift range of the LBG sample in general is 2.0–3.4 and therefore we cannot conclude whether sources without spectroscopic redshifts are inside or out of the protocluster redshift spike. For the LAE sample, we utilized 158 LAEs from Hayashino et al. (2004) that were within the extent of the Chandra observations (292 arcmin2 overlap) and had observed-frame Ly equivalent widths of EWobs 80 Å and narrow-band 5000 Å magnitudes brighter than NB (AB). While it is possible that some of the LAEs in our sample may be low-redshift interlopers, spectroscopic follow-up of a larger and less conservative sample of 118 out of 271 LAEs with NB and EW 69 Å find only two contaminating sources at and 0.329, which were found to be [O II] 3737 doublet emitters (Y. Matsuda & T. Yamada private communication; see also, Matsuda et al. 2005 for further detail). Therefore, we expect that 97% of the LAEs in our sample are indeed located in the protocluster. We further note that seven (26%) of our LBGs with spectroscopic redshifts in the range of 3.06–3.12 are also LAEs. In total, our SSA22 samples contain 384 unique sources at .
For the purpose of comparing the accretion properties of our SSA22 sample with LBGs and LAEs found in more typical low-density regions of the universe, we created Chandra Deep Field (CDF) samples of LBGs in the CDF-N and LAEs in the E-CDF-S (hereafter, field comparison samples). For our field LBG sample, we used the 146 “HDF-N” -dropouts from Steidel et al. (2003) that lie in a 75 arcmin2 region of the 2 Ms CDF-N (Alexander et al. 2003). These sources have 23.3–25.6 (median ), which are on average fainter than those in SSA22 by 0.2 mag. In total, 61 (42%) of the CDF-N LBGs have spectroscopic redshifts from Steidel et al. (2003). We constructed our field LAE sample using the LAEs from Gronwall et al. (2007) that were within the extent of the E-CDF-S Chandra coverage (1008 arcmin2 overlap), which consists of a central 2 Ms Chandra exposure (Luo et al. 2008) that is flanked by four 250 ks (Lehmer et al. 2005a) Chandra observations. The Gronwall et al. (2007) sample of LAEs have EW Å and reach narrow-band depths of NB . Spectroscopic follow up of 52 LAEs in the E-CDF-S sample show that all of these sources are at (Gawiser et al. 2006; Gronwall et al. 2007). In order to make fair comparisons between field and protocluster LAEs, the Gronwall et al. (2007) observational limits were used in our selection of the SSA22 sample discussed above. Our field LAE sample consists of 257 LAEs. In total, our CDF field comparison samples consists of 403 unique sources at , thus making the number of sources in the SSA22 and CDF field comparison samples similar.
3.2. X-ray Matching of LBG and LAE Samples
We matched our SSA22 and CDF field comparison samples to the available Chandra point-source catalogs (see 2 and references in 3.1). For a successful match, we required that the optical positions of our LBGs and LAEs be offset by no more than 10 from the Chandra source position. Under this criterion, we found Chandra counterparts for six LBGs and five LAEs in SSA22. One of these sources J221739.04+001330.1 is both an LBG and LAE; therefore, our SSA22 sample consists of ten unique X-ray–detected sources at (see Table 1 for detailed properties). We find that four of our six SSA22 LBGs and all five SSA22 LAEs have spectroscopic redshifts. In Figure 1, we show the positions of our X-ray–detected LBGs and LAEs. We note that the majority of our X-ray–detected sources lie in high LAE density regions.
We determined the expected number of false matches for our SSA22 sample by shifting the 384 LBG plus LAE optical source positions by small offsets and rematching them to our 400 ks Chandra point-source catalog. We performed eight such trials using positional shifts of 50 and 100 and found an average of 0.9 false matches per trial. Based on this test, we expect spurious matches to have a limited affect on our results.
For our CDF field comparison sample, we found X-ray detections for eight LBGs in the CDF-N and two LAEs in the E-CDF-S. We find that six of the eight CDF-N LBGs and one of the two E-CDF-S LAEs have spectroscopic redshifts. One of the E-CDF-S LAEs J033307.61275127.0 is a interloper due to the detection of the C III] line at 1909. We note that such interlopers are not common and that due to the strong C III] emission line from an AGN, it is not surprising that J033307.61275127.0 was detected in the X-ray band. Since the interloper fraction for LAEs is very small both in the E-CDF-S and SSA22 samples (see 3.1), we have chosen to remove J033307.61275127.0 from our subsequent analyses. We have experimented with the inclusion of this source in our analyses and find that this has no material affects on our overall results.
In Table 1, we summarize the basic X-ray properties of the X-ray detected sources in our SSA22 and CDF field comparison samples. For all sources, we calculated rest-frame 2–8 keV and 8–32 keV luminosities using observed-frame 0.5–2 keV and 2–8 keV fluxes, respectively, and the best available value for the redshift. For comparison purposes, we note that the rest-frame 2–8 keV luminosity can be converted to the more commonly utilized 2–10 keV bandpass luminosity following , where . For sources without only limits on , we find on average (1 standard deviation). Since our X-ray–detected sources cover the redshift range of 2.0–3.4, we made small multiplicative corrections to observed frame fluxes to correspond to rest-frame 2–8 keV and 8–32 keV luminosities. These correction factors were computed assuming a power-law spectral energy distribution (SED) with photon index . For our ten X-ray–detected sources in SSA22, the mean multiplicative correction factor and 1 standard deviation is .
We expect that for highly-obscured sources, our rest-frame 2–8 keV luminosities may be significantly underestimated and would therefore be considered as lower limits on the intrinsic luminosities. However, we do not expect such obscuration effects to have a significant influence on the rest-frame 8–32 keV luminosity, and we therefore use the rest-frame 8–32 keV luminosity to infer intrinsic energetics of X-ray–detected sources in our samples. To identify signatures of absorption in X-ray–detected galaxies, we used basic observed 2–8 keV to 0.5–2 keV band-ratios (BR444Here we define the band-ratio BR as , where and are the net count-rates in the 0.5–2 keV and 2–8 keV bandpasses, respectively.) for determining effective photon indices . The relationship between band-ratio and was determined using xspec (version 12.3.1; Arnaud 1996) to fit simple power laws, including only Galactic absorption, to point sources in our Chandra catalog that were detected in all three of our standard bandpasses (i.e., FB, SB, and HB) and had 50 counts in the FB. For these sources, we determined the emprical relationship between BR and and used this relationship to compute for additional sources in our sample.
As discussed in 2, the most sensitive regions of the 400 ks Chandra observations reach a rest-frame 8–32 keV luminosity limit of 2.1 ergs s-1. This luminosity limit is 20–50 times larger than the most luminous starburst galaxies in the local universe (e.g., Persic & Rephaeli 2007) and 10–40 times more luminous than the expected X-ray–emitting star-formation component for ultraluminous submm-emitting galaxies (e.g., Alexander et al. 2005). We therefore conclude that all of our 2.0–3.4 sources detected in the observed 2–8 keV bandpass are powered by AGNs.
4. Results
4.1. X-ray Properties of LBG and LAE Samples
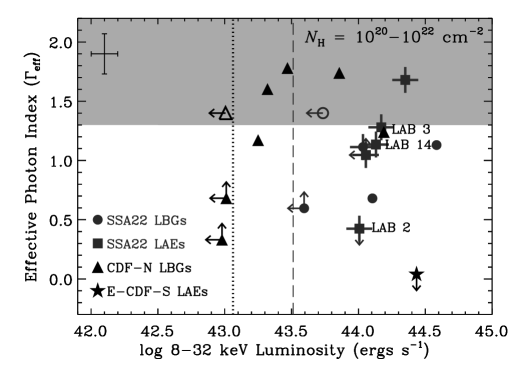
In Figure 2, we show versus the logarithm of the 8–32 keV luminosity for our SSA22 and CDF field comparison samples. We find that for sources detectable in the observed 2–8 keV bandpass of the SSA22 survey field (), we have seven X-ray–detected sources versus three in the CDFs. These sources cover (3–50) ergs s-1 and have values of 0.4–1.7 (median ), suggesting significant obscuring columns of – cm-2. To test whether the protocluster environment is influencing the observed absorption properties of the AGNs, we performed X-ray stacking (see Lehmer et al. 2008 for details) of five 3.06–3.12 SSA22 protocluster sources and five spectroscopically confirmed field sources (in SSA22 and the CDFs) that had to determine mean photon indices. We found stacked effective photon indices of and for the protocluster and field, respectively. This suggests that on average, the X-ray absorption properties of the most luminous protocluster and field AGNs are similar.
4.2. AGN Fraction and X-ray Stacking Results
To assess whether the AGN activity per galaxy in the SSA22 protocluster environment is quantitatively different from that observed in the field, we compared the rest-frame 8–32 keV luminosity dependent cumulative AGN fractions, , for LBGs and LAEs in the protocluster with those in the field. For a given sample of galaxies, can be computed following the procedure outlined in 5.2 of Lehmer et al. (2008). Briefly, we determined by taking the number of candidate AGNs in a particular galaxy sample with a rest-frame 8–32 keV luminosity of or greater () and then dividing it by the number of galaxies in which we could have detected an AGN with luminosity (). can be computed by considering the redshift of each galaxy and its corresponding sensitivity limit, as obtained from spatially varying sensitivity maps appropriate for each Chandra observation (see Alexander et al. 2003; Lehmer et al. 2005a; Luo et al. 2008; Lehmer et al. in preparation for further details).
Using exclusively the 168 LBGs in our SSA22 and CDF-N samples that had spectroscopic redshifts from Steidel et al. (2003), we computed for both protocluster LBGs (27 sources) that were within the physical boundaries of the SSA22 protocluster ( 3.06–3.12) and field LBGs (141 sources) in the SSA22 field (i.e., outside the protocluster redshift range) and the CDF-N. As mentioned in 2, our Chandra observations cover only a small fraction of the entire SSA22 protocluster extent and we therefore do not constrain further the physical boundaries of the protocluster in the transverse direction. We experimented by comparing for protocluster and field LBGs in the SSA22 region alone, and although not well constrained, the results are consistent with those found by combining the SSA22 and CDF-N field samples. For our LAEs, we computed for the SSA22 protocluster and E-CDF-S field samples.
| SSA22 Protocluster | CDF + SSA22 Field | ||||||
| (ergs cm-2 s-1) | (%) | (%) | Enha | ||||
| 2–3.4 Lyman Break Galaxies | |||||||
| 43.50 | 2 | 21 | 9.5 | 2 | 103 | 1.9 | 4.9 |
| 43.75 | 2 | 26 | 7.7 | 4 | 118 | 3.4 | 2.3 |
| 44.00 | 2 | 27 | 7.4 | 3 | 128 | 2.3 | 3.2 |
| 44.25 | 0 | 27 | 20.7 | 1 | 130 | 0.8 | 27.0 |
| Ly Emitters | |||||||
| 43.50 | 2 | 39 | 5.1 | 1 | 142 | 0.7 | 7.3 |
| 43.75 | 4 | 83 | 4.8 | 1 | 194 | 0.5 | 9.3 |
| 44.00 | 4 | 121 | 3.3 | 1 | 223 | 0.4 | 7.4 |
| 44.25 | 1 | 144 | 0.7 | 1 | 246 | 0.4 | 1.7 |
a Measured enhancement of the AGN fraction, where Enh (protocluster)/(field) and Enh indicates an elevation in the average AGN activity per galaxy in the SSA22 protocluster (see 4.2 for details).
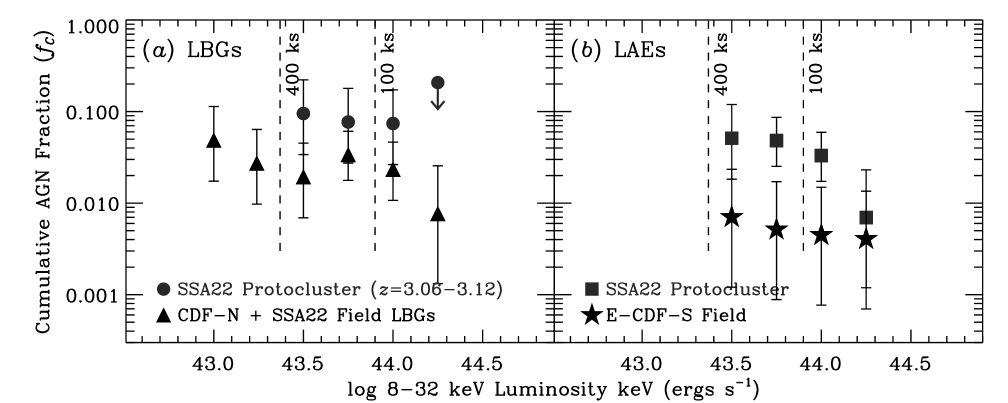
In Table 2, we show the basic data used to compute for both the SSA22 protocluster and SSA22 plus CDF field comparison samples. In Figure 3, we present versus for the above LBG (Fig. 3) and LAE (Fig. 3) samples. Error bars on are Poissonian and were computed as double-sided 68.27% (1) confidence intervals and 3 upper limits on following the methods described in Gehrels (1986). We find that for both the LBGs and LAEs there is suggestive evidence for an enhancement555Here enhancement is defined as a ratio of AGN fractions in the protocluster versus outside the protocluster that is larger than unity (i.e., [protocluster]/[field] ). of the AGN fraction for 43.5–44.25 in the protocluster environment versus the field. For ergs s-1, this enhancement is measured to be and for LBGs and LAEs, respectively. Error bars on the enhancement are 1 and were computed following the numerical error propagation method outlined in 1.7.3 of Lyons (1991). To determine the significance of a measured enhancement, we computed the integrated Poissonian probability for an overlap between the protocluster and field AGN-fraction error distributions (i.e., the probability that the protocluster and field AGN fractions are consistent). For the LBG and LAE AGN fraction enhancements, we found overlapping probabilities of 24% and 22% (i.e., suggested enhancements at the 76% and 78% significance levels), respectively. As discussed in 3.1, of the 27 LBGs in the SSA22 redshift spike, only 7 (26%) are identified as also being LAEs. We can therefore consider these AGN fraction enhancement measurements for LBGs and LAEs to be two roughly independent results, with a mean enhancement of and a multiplicatively combined enhancement significance at the 95% confidence level.
To assess whether lower luminosity AGN and star-formation activity is enhanced in the SSA22 protocluster over the field, we performed X-ray stacking following the procedure outlined in 4.2 of Lehmer et al. (2008). We restricted our stacking analyses to sources that were within 6′ (2.7 Mpc at ) of the Chandra aimpoints where the imaging quality is best. For both our LBG and LAE samples, we stacked separately X-ray–undetected galaxies that were within the SSA22 protocluster redshift range and galaxies that were outside the protocluster including sources in the SSA22 field itself and our CDF comparison fields. For these four samples, we detected significantly (i.e., at the 3 level) the X-ray emission from our field LBGs (non-spike SSA22 and CDF-N sources) and the SSA22 LAEs in the observed-frame 0.5–2 keV band. For the field LBGs, we find a mean rest-frame 2–8 keV luminosity of ergs s-1 (4.4 significance), which is in good agreement with that found from past stacking analyses of LBGs (e.g., Brandt et al. 2001; Nandra et al. 2002; Lehmer et al. 2005b, 2008; Laird et al. 2006). For X-ray–undetected LBGs in the SSA22 protocluster spike, we constrain the mean rest-frame 2–8 keV luminosity to be ergs s-1 (3 upper limit). For our stacked LAEs, we constrain the mean rest-frame 2–8 keV luminosity to be ergs s-1 (3.9 significance) and ergs s-1 for the SSA22 protocluster and E-CDF-S field samples, respectively. These stacked luminosities suggest that on average LBGs and LAEs are respectively 6.1 and 1.4 times more luminous in the protocluster than in the field. Such constraints suggest that low-level AGN and star-formation activity allows for enhancement in the SSA22 protocluster at a level consistent with that seen in more luminous AGNs (i.e., 1.4–6.1).
If the X-ray emission from the stacked LBGs are dominated by star-forming processes and the X-ray–SFR correlation at 0–1.4 (from Lehmer et al. 2008) is similar at , then we find X-ray–derived SFRs of 341 yr-1 and 57 yr-1 for protocluster and field LBGs, respectively (assuming a Kroupa 2001 initial mass function). For comparison, we utilized the LBG -band magnitudes provided by Steidel et al. (2003) and an SED appropriate for LBGs (see 2.2 of Lehmer et al. 2005b for details) to determine rest-frame UV luminosities and compute UV-derived SFRs. Following the UV–SFR relation from equation 1 of Bell et al. (2003), we find average UV-derived SFRs of 11.2 yr-1 and 7.1 yr-1 for protocluster and field LBGs, respectively. If the X-ray emission is a reasonable tracer of the unobscured SFRs for these LBGs, then the rest-frame UV emission from these sources would be obscured on average by factors of 30.4 and 8.0 for protocluster and field LBGs, respectively. We note that the obscuration factor for the field LBGs (i.e., 8.0) is 2 times larger than the average obscuration factor measured using rest-frame UV spectral slopes for similar LBGs (e.g., Adelberger & Steidel 2000), suggesting that X-ray emission from lower luminosity AGNs is likely contributing a significant fraction (50%) of the stacked X-ray signal for our LBG samples.
4.3. Rest-Frame Near Infrared Properties of LBGs
To constrain the stellar content of SSA22 protocluster galaxies, we computed rest-frame -band luminosities for LBGs in our sample. We presume that the -band luminosity provides a reasonable proxy for stellar mass; however, we note that for a given -band luminosity, galaxies with older stellar populations will have intrinsically larger stellar masses. We restricted this analysis to the 87 LBGs in SSA22 that had spectroscopic redshifts from Steidel et al. (2003) in the range of 2.4–3.4, a redshift range over which photometric limits used for computing rest-frame -band luminosities are not expected to vary significantly (see below). We constructed broadband photometric SEDs for LBGs in our sample using , , and band photometry from Steidel et al. (2003), and band photometry from the UKIRT Infrared Deep Sky Survey (UKIDSS; Lawrence et al. 2007), band imaging from the UKIRT Wide-Field Camera (WFCAM) obtained in service time, and Spitzer IRAC photometry in the 3.6, 4.5, 5.8, and 8.0 m bands (from the Spitzer archive; originally from GO project 30328). To obtain reasonable estimates of the rest-frame -band luminosities for our LBGs, we used the SED fitting capability within the photometric redshift code HYPERZ666See http://webast.ast.obs-mip.fr/hyperz/ for details on HYPERZ. to obtain model SEDs (see details below). When fitting our available photometric data, we included only LBGs that were detected in at least one of the four IRAC bands (hereafter, IRAC detected). This ensured that our SEDs were well constrained near the rest-frame bandpass, which corresponds to observed-frame 5–8 m for 2.4–3.4. Furthermore, we visually inspected the UKIRT and IRAC images of all of our LBGs to identify sources that were either confused by nearby sources or contained low-significance artifacts. In total, we were left with 23 galaxies (26% of our LBG sample) at 2.4–3.4 with reliable photometry that we used for computing rest-frame -band luminosities.
Our SED models were derived from Bruzual & Charlot (1993) assuming a single star-formation epoch with an exponentially decaying star-formation history (time constants = 1, 2, 3, 5, 15 and 30 Gyr) and a Miller & Scalo (1979) IMF; the model grid spans ages of 0–20 Gyr. We utilized reddening curves from Calzetti et al. (2000) and fit the extinction over the range of 0–2 mags. In the fitting process, we fixed the galaxy redshift to the spectroscopic values given in Steidel et al. (2003). For each of our 30 IRAC-detected LBGs, we convolved the best-fit template spectrum with the UKIRT -band filter function to approximate the rest-frame -band luminosity. We checked to see whether the stellar populations of protocluster and field galaxies were notably different by measuring the rest-frame colors (e.g., and ) of our best-fit SEDs. We found no statistically significant differences between the protocluster and field colors; however, due to limited source statistics, we were unable to rule out mean color differences at levels of and magnitudes.
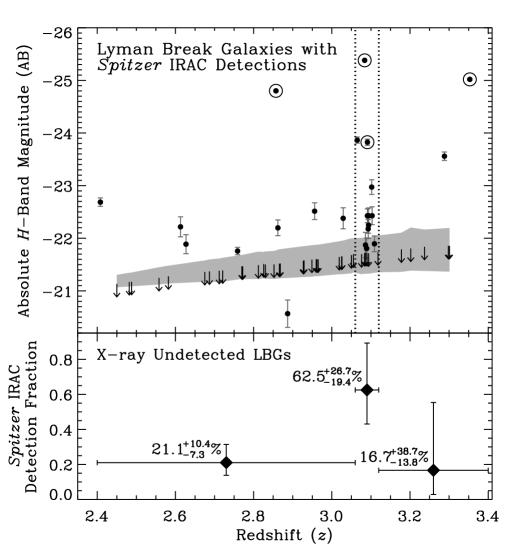
In the top panel of Figure 4, we plot the absolute -band magnitude versus redshift for LBGs with 2.4–3.4. We note that the fraction of LBGs that were IRAC detected is significantly larger for sources in the protocluster than in the field. In the bottom panel of Figure 4, we show the IRAC detection fraction in three redshift bins at 2.4–3.06 (%), 3.06–3.12 (%), and 3.12–3.4 (%). We find that the IRAC detection fraction of LBGs is 3.0 times higher in the protocluster than in the field implying there must be a significantly lower-luminosity (as measured in the rest-frame -band) and hence potentially lower-mass population of field galaxies than protocluster galaxies.
For sources that were not detected individually in any IRAC bands, we calculated upper limits on by tying characteristic SEDs to the 5 photometric limit in the 3.6m band, which provides the tightest constraints on the rest-frame near-infrared emission. To reasonably account for variations in the median SEDs of these IRAC-undetected LBGs, we chose to calculate a reasonable range of upper limits for these sources by using a variety of SEDs spanning the quartile range of IRAC-detected best-fit stellar ages (40–500 Myr); these upper limit ranges are shown in the upper panel of Figure 4.
We find that for all LBGs (including those with only upper limits and their upper limit ranges) without X-ray detections, the median values of and to (accounting for the range of upper limits described above) for the protocluster (i.e., 3.06–3.12) and field (i.e., 2.4–3.06 and 3.12–3.4), respectively. These constraints imply that the typical protocluster galaxy is 1.2–1.8 times more luminous in the -band for protocluster LBGs in comparison to field LBGs. This also suggests that protocluster LBGs are more massive than those found in the field.
5. Discussion
The elevation in the SSA22 protocluster AGN fraction discussed in 4.2 is plausibly expected due to (1) an increase in the accretion activity through either more frequent accretion episodes and/or higher median SMBH accretion rates in the high-density environments and/or (2) an increase in the typical X-ray luminosity of protocluster SMBHs resulting from the presence of more massive host galaxies and SMBHs on average.
Theoretical studies of the assembly and merger history of galaxies (e.g., Volonteri et al. 2003; Micic et al. 2007) suggest that SMBHs and their host galaxies build up mass more quickly in high-density regions due to major-merger activity. Steidel et al. (1998) estimate that the SSA22 protocluster LBGs reside in relatively massive dark matter halos of per galaxy. It is expected that galaxies in such massive halos will undergo a peak in major-merger frequency at 2–4. Therefore, in the SSA22 protocluster these merger events may potentially be responsible for both building up galaxy mass and funneling cold gas into the central SMBH and fueling AGN activity at a higher frequency than in the lower-density field environment.
As previously discussed in 4.3, we have found initial evidence suggesting that typical LBGs in SSA22 are 1.2–1.8 times more massive in the protocluster compared to the field. Similarly, detailed multiwavelength studies of the protocluster HS 1700643, a cluster similar in overall size and mass to SSA22, have found evidence suggesting the protocluster galaxies have ages and stellar masses that are a factor of 2 times larger than galaxies outside the protocluster (Shapley et al. 2005; Steidel et al. 2005). Given the relationship between host-galaxy and SMBH mass in the local universe, it is reasonable to expect that a similar relationship will hold at 2–4 where massive SMBHs have been found to reside in massive galaxies (e.g., Mclure et al. 2006; Peng et al. 2006; Alexander et al. 2003). This suggests that the elevated AGN fraction in the protocluster compared to the field could be due to the presence of more massive and luminous accreting SMBHs. Qualitatively, we see similar behavior for star-forming in general at 0.2–2, where the AGN fraction for a particular X-ray luminosity is observed to increase positively with galaxy stellar mass (see, e.g., Fig. 5 of Daddi et al. 2007 and Fig. 14 of Lehmer et al. 2008).
We note that reasonable mass measurements for the SMBHs in our galaxies is presently beyond the capabilities of modern instrumentation. However, if we assume that (1) the enhanced AGN fraction in the SSA22 protocluster is primarily due to the presence of more massive SMBHs than in the field and (2) the typical X-ray luminosity scales linearly with SMBH mass (i.e., all the SMBHs are accreting at roughly the same fraction of the Eddington limit), then we can crudely estimate the elevation in SMBH mass by scaling up the luminosity dependence (i.e., by multiplying by an elevation factor) of (field) until we obtain reasonable agreement between for the protocluster and field. Based on Figure 3, where (field) extends to lower values of than (protocluster), we find that we would have to scale for (field) by a factor of 3–10 to give consistent values of the AGN fractions for the protocluster and field. Under these assumptions, this implies that the typical SMBH mass may be 3–10 times larger in the protocluster compared to the field. These constraints are broadly consistent with those obtained for the elevation in galaxy stellar mass (i.e., 1.2–1.8), suggesting that both the SMBHs and their host galaxies may be simultaneously undergoing significant fractional growth. We note, however, that these constraints are insufficient for distinguishing whether the mass ratios between protocluster SMBHs and their host galaxies are consistent with local relations.
Due to environmental effects, it is expected that the massive galaxies in the SSA22 protocluster will quickly evolve onto the red-sequence and enter a passive state with insignificant star-formation and black-hole growth. Observational studies of distant populations of massive galaxies (1011 ) have shown that stellar growth and AGN activity fall off dramatically between 2–3 and (e.g., Papovich et al. 2006). By , it is expected that the SSA22 cluster would virialize and then resemble a local rich cluster, where the SMBH growth in the cluster galaxies will have ceased to levels lower that of the field population (e.g., Dressler et al. 1985; Martini et al. 2007).
6. Summary and Future Observations
Using a new ultra-deep 400 ks Chandra observation of the SSA22 protocluster at , we have investigated the role of environment on the accretion of SMBHs. Our key results are as follows:
-
•
We have cross-correlated samples of 234 LBGs from Steidel et al. (1998) and 158 LAEs from Hayashino et al. (2004) with our Chandra catalog and find a total of ten X-ray–detected sources at ; at least six and potentially eight of these are members of the protocluster. These sources have rest-frame 8–32 keV luminosities in the range of (3–50) ergs s-1 and a mean effective photon index of suggesting significant absorption columns of – cm-2.
-
•
We have determined the rest-frame 8–32 keV luminosity-dependent AGN fraction for galaxies within the SSA22 protocluster at and compared it with that measured for galaxies in the field. We found that the fraction of LBGs and LAEs harboring an AGN with ergs s-1 is a factor of 6.1 times larger in the protocluster than in the field (see 4.2 for details). We attribute the enhanced AGN fraction in the SSA22 protocluster to be plausibly due to an increase in galaxy merger activity that would lead to an increase in the SMBH accretion activity (e.g., more frequent accretion episodes and/or higher median accretion rates) and/or an increase in the X-ray luminosities of protocluster SMBHs due to the presence of more massive SMBHs and host galaxies on average.
-
•
To differentiate between these two possibilities, we utilized optical–to–mid infrared photometry to measure rest-frame -band luminosities of LBGs in our sample, which we expect to be a reasonable tracer of stellar mass. We found evidence suggesting that the stellar masses of LBGs are 1.2–1.8 times more massive in the protocluster than in the field (see 4.3 for details), and hence the larger AGN fraction most likely reflects more massive SMBHs and associated host galaxies.
To constrain better the above results, future multiwavelength observations are needed. For example, in the SSA22 field, deeper and/or wider LBG and LAE surveys would allow for the detection of further protocluster members; in the Steidel et al. (2003) LBG catalog, 54% of the sources do not have spectroscopic redshifts, which includes two X-ray–detected LBGs (see Table 1). Yamada et al. (in preparation) have performed a wider LAE survey of SSA22 covering 1 deg2 scales, which has revealed additional high-density regions within the protocluster. Expanding the multiwavelength data set available to include such regions would enable more stringent constraints to be placed on the enhancement of AGN activity as a function of global and local environment at . This will place direct constraints on the mechanism that causes SMBHs to grow. Furthermore, analyses of additional protoclusters similar to SSA22 that also contain deep Chandra and multiwavelength data (e.g., HS 1700643) could be combined with these data to place more significant constraints on the influence of environment on AGN activity in the high-redshift universe.
References
- Adelberger et al. (1998) Adelberger, K. L., Steidel, C. C., Giavalisco, M., Dickinson, M., Pettini, M., & Kellogg, M. 1998, ApJ, 505, 18
- Adelberger & Steidel (2000) Adelberger, K. L., & Steidel, C. C. 2000, ApJ, 544, 218
- Alexander et al. (2003) Alexander, D. M., et al. 2003, AJ, 126, 539
- Alexander et al. (2005) Alexander, D. M., Bauer, F. E., Chapman, S. C., Smail, I., Blain, A. W., Brandt, W. N., & Ivison, R. J. 2005, ApJ, 632, 736
- Alexander et al. (2008) Alexander, D. M., et al. 2008, AJ, 135, 1968
- Arnaud (1996) Arnaud, K. A. 1996, Astronomical Data Analysis Software and Systems V, ed. G. H. Jacoby & J. Barnes (San Francisco: ASP), 17
- Bauer et al. (2004) Bauer, F. E., Alexander, D. M., Brandt, W. N., Schneider, D. P., Treister, E., Hornschemeier, A. E., & Garmire, G. P. 2004, AJ, 128, 2048
- Bell et al. (2003) Bell, E. F., McIntosh, D. H., Katz, N., & Weinberg, M. D. 2003, ApJS, 149, 289
- Bower et al. (2004) Bower, R. G., et al. 2004, MNRAS, 351, 63
- Brandt et al. (2001) Brandt, W. N., Hornschemeier, A. E., Schneider, D. P., Alexander, D. M., Bauer, F. E., Garmire, G. P., & Vignali, C. 2001, ApJL, 558, L5
- Broos et al. (2000) Broos, P., et al. 2000, User’s Guide for the TARA Package. (University Park: Pennsylvania State Univ.)
- Broos et al. (2002) Broos, P. S., Townsley, L. K., Getman, K., & Bauer, F. E. 2002, ACIS Extract, An ACIS Point Source Extraction Package (University Park: Pennsylvania State Univ.)
- Bruzual A. & Charlot (1993) Bruzual A., G., & Charlot, S. 1993, ApJ, 405, 53
- Calzetti et al. (2000) Calzetti, D., Armus, L., Bohlin, R. C., Kinney, A. L., Koornneef, J., & Storchi-Bergmann, T. 2000, ApJ, 533, 682
- Cooper et al. (2008) Cooper, M. C., et al. 2008, MNRAS, 383, 1058
- Croft et al. (2005) Croft, S., Kurk, J., van Breugel, W., Stanford, S. A., de Vries, W., Pentericci, L., Röttgering, H. 2005, AJ, 130, 867
- Daddi et al. (2007) Daddi, E., et al. 2007, ApJ, 670, 173
- De Lucia et al. (2006) De Lucia, G., Springel, V., White, S. D. M., Croton, D., & Kauffmann, G. 2006, MNRAS, 366, 499
- Dressler et al. (1985) Dressler, A., Thompson, I. B., & Shectman, S. A. 1985, ApJ, 288, 48
- Eastman et al. (2007) Eastman, J., Martini, P., Sivakoff, G., Kelson, D. D., Mulchaey, J. S., & Tran, K.-V. 2007, ApJL, 664, L9
- Elbaz et al. (2007) Elbaz, D., et al. 2007, A&A, 468, 3
- Gawiser et al. (2006) Gawiser, E., et al. 2006, ApJL, 642, L13
- Geach et al. (2005) Geach, J. E., et al. 2005, MNRAS, 363, 1398
- Geach et al. (2006) Geach, J. E., et al. 2006, ApJ, 649, 661
- Gebhardt et al. (2000) Gebhardt, K., et al. 2000, ApJL, 539, L13
- Gehrels (1986) Gehrels, N. 1986, ApJ, 303, 336
- Gilli et al. (2003) Gilli, R., et al. 2003, ApJ, 592, 721
- Governato et al. (1998) Governato, F., Baugh, C. M., Frenk, C. S., Cole, S., Lacey, C. G., Quinn, T., & Stadel, J. 1998, Nature, 392, 359
- Gronwall et al. (2007) Gronwall, C., et al. 2007, ApJ, 667, 79
- Hayashino et al. (2004) Hayashino, T., et al. 2004, AJ, 128, 2073
- Heinis et al. (2007) Heinis, S., et al. 2007, ApJS, 173, 503
- Johnson et al. (2003) Johnson, O., Best, P. N., & Almaini, O. 2003, MNRAS, 343, 924
- Kauffmann (1996) Kauffmann, G. 1996, MNRAS, 281, 487
- Kormendy & Richstone (1995) Kormendy, J., & Richstone, D. 1995, ARA&A, 33, 581
- Kroupa (2001) Kroupa, P. 2001, MNRAS, 322, 231
- Laird et al. (2006) Laird, E. S., Nandra, K., Hobbs, A., & Steidel, C. C. 2006, MNRAS, 373, 217
- Lawrence et al. (2007) Lawrence, A., et al. 2007, MNRAS, 379, 1599
- Lehmer et al. (2005a) Lehmer, B. D., et al. 2005a, ApJS, 161, 21
- Lehmer et al. (2005b) Lehmer, B. D., et al. 2005b, AJ, 129, 1
- Lehmer et al. (2008) Lehmer, B. D., et al. 2008, ApJ, 681, 1163
- Lewis et al. (2002) Lewis, I., et al. 2002, MNRAS, 334, 673
- Luo et al. (2008) Luo, B., et al. 2008, ApJS, in-press (astro-ph/0806.3968)
- Lyons (1991) Lyons, L. 1991, Data Analysis for Physical Science Students (Cambridge: Cambridge Univ. Press)
- Magorrian et al. (1998) Magorrian, J., et al. 1998, AJ, 115, 2285
- Martini et al. (2007) Martini, P., Mulchaey, J. S., & Kelson, D. D. 2007, ApJ, 664, 761
- Matsuda et al. (2004) Matsuda, Y., et al. 2004, AJ, 128, 569
- Matsuda et al. (2005) Matsuda, Y., et al. 2005, ApJL, 634, L125
- McLure et al. (2006) McLure, R. J., Jarvis, M. J., Targett, T. A., Dunlop, J. S., & Best, P. N. 2006, MNRAS, 368, 1395
- Micic et al. (2007) Micic, M., Holley-Bockelmann, K., Sigurdsson, S., & Abel, T. 2007, MNRAS, 380, 1533
- Miller & Scalo (1979) Miller, G. E., & Scalo, J. M. 1979, ApJS, 41, 513
- Nandra et al. (2002) Nandra, K., Mushotzky, R. F., Arnaud, K., Steidel, C. C., Adelberger, K. L., Gardner, J. P., Teplitz, H. I., & Windhorst, R. A. 2002, ApJ, 576, 625
- Papovich et al. (2006) Papovich, C., et al. 2006, ApJ, 640, 92
- Peng et al. (2006) Peng, C. Y., Impey, C. D., Rix, H.-W., Kochanek, C. S., Keeton, C. R., Falco, E. E., Lehár, J., & McLeod, B. A. 2006, ApJ, 649, 616
- Pentericci et al. (2002) Pentericci, L., Kurk, J. D., Carilli, C. L., Harris, D. E., Miley, G. K., Röttgering, H. J. A. 2002, A&A, 396, 109
- Persic & Rephaeli (2007) Persic, M., & Rephaeli, Y. 2007, A&A, 463, 481
- Poggianti et al. (2008) Poggianti, B. M., et al. 2008, ApJ, in-press (astro-ph/0805.1145)
- Shapley et al. (2005) Shapley, A. E., Steidel, C. C., Erb, D. K., Reddy, N. A., Adelberger, K. L., Pettini, M., Barmby, P., & Huang, J. 2005, ApJ, 626, 698
- Silverman et al. (2008) Silverman, J. D., et al. 2008, ApJ, 675, 1025
- Smail et al. (2003) Smail, I., Scharf, C. A., Ivison, R. J., Stevens, J. A., Bower, R. G., & Dunlop, J. S. 2003, ApJ, 599, 86
- Smith et al. (2008) Smith, R. J., et al. 2008, MNRAS, 386, L96
- Spergel et al. (2003) Spergel, D. N., et al. 2003, ApJS, 148, 175
- Stark et al. (1992) Stark, A. A., Gammie, C. F., Wilson, R. W., Bally, J., Linke, R. A., Heiles, C., & Hurwitz, M. 1992, ApJS, 79, 77
- Steidel et al. (1998) Steidel, C. C., Adelberger, K. L., Dickinson, M., Giavalisco, M., Pettini, M., & Kellogg, M. 1998, ApJ, 492, 428
- Steidel et al. (2000) Steidel, C. C., Adelberger, K. L., Shapley, A. E., Pettini, M., Dickinson, M., & Giavalisco, M. 2000, ApJ, 532, 170
- Steidel et al. (2003) Steidel, C. C., Adelberger, K. L., Shapley, A. E., Pettini, M., Dickinson, M., & Giavalisco, M. 2003, ApJ, 592, 728
- Steidel et al. (2005) Steidel, C. C., Adelberger, K. L., Shapley, A. E., Erb, D. K., Reddy, N. A., & Pettini, M. 2005, ApJ, 626, 44
- Venemans et al. (2007) Venemans, B. P., et al. 2007, A&A, 461, 82
- Volonteri et al. (2003) Volonteri, M., Haardt, F., & Madau, P. 2003, ApJ, 582, 559
- Wilman et al. (2005) Wilman, R. J., Gerssen, J., Bower, R. G., Morris, S. L., Bacon, R., de Zeeuw, P. T., & Davies, R. L. 2005, Nature, 436, 227