Spatially Resolved Spectroscopy of Sub-AU-Sized Regions of T Tauri and Herbig Ae/Be Disks
Abstract
We present spatially resolved near-IR spectroscopic observations of 15 young stars. Using a grism spectrometer behind the Keck Interferometer, we obtained an angular resolution of a few milli-arcseconds and a spectral resolution of 230, enabling probes of both gas and dust in the inner disks surrounding the target stars. We find that the angular size of the near-IR emission typically increases with wavelength, indicating hot, presumably gaseous material within the dust sublimation radius. Our data also clearly indicate Br emission arising from hot hydrogen gas, and suggest the presence of water vapor and carbon monoxide gas in the inner disks of several objects. This gaseous emission is more compact than the dust continuum emission in all cases. We construct simple physical models of the inner disk and fit them to our data to constrain the spatial distribution and temperature of dust and gas emission components.
1 Introduction
Protoplanetary disks provide a reservoir of material from which planets may form, and the abundance and properties of extra-solar planets (e.g., Marcy et al. 2005), as well as the architecture of our own solar system, suggest that planets frequently form in or migrate through inner regions of protoplanetary disks. Furthermore, the innermost disk regions represent the interface between the inwardly accreting disk and the magnetized central star, and it is here that material accretes inward or is launched in winds or outflows (Shu et al. 1994). Knowledge of the distribution of material in the inner disk is therefore crucial for understanding the mass assembly and angular momentum evolution of pre-main-sequence stars.
Modeling of spectral energy distributions (e.g., Bertout et al. 1988; Lada & Adams 1992) and spectrally resolved gaseous emission lines (e.g., Najita et al. 1996a; Blake & Boogert 2004; Najita et al. 2007) provide important insights into the structure of protoplanetary disks in the terrestrial planet forming region. However, since these techniques typically rely on spectral information as a proxy for spatial information, they require assumptions about underlying geometric, temperature, or velocity structure. Recently, the technique of spectro-astrometry, which capitalizes on the fact that emission centroids can be measured more precisely than the available angular resolution, has enabled less ambiguous constraints on disk structure (Pontoppidan et al. 2008). However, substantial gaps in our understanding remain due to a lack of high angular resolution observations.
Near-IR interferometry, which synthesizes a large aperture using two or more smaller, separated apertures, can achieve orders of magnitude higher angular resolution than conventional telescopes, and can spatially resolve disk terrestrial regions. For example, the Keck Interferometer, which combines the light from the two 10-m Keck apertures over an 85-m baseline, achieves a resolution approximately an order of magnitude higher than that attained with a single aperture. This means that angular scales of a few milli-arcseconds, corresponding to a few tenths of an AU at typical distances to nearby star-forming regions, can be spatially resolved with near-IR interferometers.
Most interferometric measurements to date have probed only inner disk dust (e.g., Millan-Gabet et al. 2007, and references therein), which typically dominates the near-IR emission. To distinguish gas and dust, spectrally dispersed observations are required. Very few sources have been observed with spectrally dispersed interferometric observations to date (Eisner et al. 2007a; Eisner 2007; Malbet et al. 2007; Tatulli et al. 2007; Kraus et al. 2008; Isella et al. 2008). The observations showed intriguing evidence that gas and dust are not distributed uniformly in inner disk regions. Moreover, while observations of stars less massive than a few M⊙ found gaseous emission to be more compact than dust emission (Eisner et al. 2007a; Eisner 2007), observations of the Br emission line around two more luminous stars found the gas to be more extended than the dust, presumably because the Br emission traces outflows from these young systems (Malbet et al. 2007; Tatulli et al. 2007). A larger sample is required to further investigate such potential trends, and to constrain the general properties of inner disk gas in young stars.
Here we present spectrally dispersed near-IR interferometry observations of a sample of young stars, including four T Tauri stars and 11 Herbig Ae/Be stars. Our data constrain the relative spatial and temperature distributions of dust and gas in sub-AU-sized regions of the disks around these stars.
2 Observations and Data Reduction
2.1 Sample
We selected a sample of young stars (Table Spatially Resolved Spectroscopy of Sub-AU-Sized Regions of T Tauri and Herbig Ae/Be Disks) known to be surrounded by protoplanetary disks, all of which have been observed previously at near-IR wavelengths with long-baseline interferometers (Millan-Gabet et al. 2001; Eisner et al. 2004, 2005, 2007c; Colavita et al. 2003; Monnier et al. 2005; Akeson et al. 2005a, b). All targets except one have been previously spatially resolved in the near-IR. HD 141569, which has not been resolved, is thought to possess a disk with a cleared inner region; however we include the source here to investigate whether any spectral features are spatially resolved even though the continuum emission is not.
Our sample includes four T Tauri stars, pre-main-sequence analogs of solar-type stars like our own sun, and 11 Herbig Ae/Be stars, 2–10 M⊙ pre-main-sequence stars. The main selection criterion in choosing this sample is source brightness (and because Herbig Ae/Be stars are typically brighter than T Tauri stars, our sample has more of the former). Our experimental setup imposes limiting magnitudes of at near-IR wavelengths and at optical wavelengths. We also require that sources be at zenith angles of less than , which excludes from our sample any sources with . Our sample includes most of the sources in the Herbig-Bell catalog (Herbig & Bell 1988), as well as several additional young stars discovered elsewhere, that meet our selection criteria.
2.2 Observations
We obtained Keck Interferometer (KI) observations of our sample on UT 2006 November 12 and UT 2007 July 3. KI is a fringe-tracking long baseline near-IR Michelson interferometer combining light from the two 10-m Keck apertures (Colavita & Wizinowich 2003; Colavita et al. 2003). Each of the 10-m apertures is equipped with an adaptive optics (AO) system that corrects phase errors caused by atmospheric turbulence across each telescope pupil, and thereby maintains spatial coherence of the light from the source across each aperture. The AO systems require sources with magnitudes brighter than . Optical beam-trains transport the light from each aperture through an underground tunnel to delay lines, beam combination optics, and the detector.
The two outputs of the beam combiner are sent into a dewar that contains a HAWAII array. Interferometric fringes are measured by modulating the relative delay of the two input beams and then measuring the modulated intensity level of the combined beams during four “ABCD” detector reads (Colavita 1999). The measured intensities in these reads are also used to measure atmosphere-induced fringe motions, and a servo loop removes these motions to keep the fringe centered near zero phase.
KI normally measures science data in a spatially filtered wide-band channel, with a second output of the beam combiner, dispersed over four channels using a prism, used for group delay tracking. For the observations discussed here, we used a mode where the prism is replaced with a grism providing an order of magnitude higher dispersion, and we used this spectrally dispersed output for our science measurements. The grism, whose properties are described in Eisner et al. (2007b), provides a spectral resolution of , with 42 10-nm-wide channels across the -band. To obtain adequate signal-to-noise for the group delay measurement with our grism, which has 10 times more pixels and hence 10 times more read noise than the prism that is normally used, we require a star brighter than .
In the following sections we discuss the calibration, modeling, and interpretation of our and flux data. We exclude HD 141569 and VV Ser from most of this discussion. HD 141569 is unresolved across our observing band, and thus we can say only that the source is small compared to the fringe spacing at all observed wavelengths. Conversely, we were unable to measure fringes for VV Ser (despite measuring strong band flux), and for this object we can say only that the angular size is large compared to the fringe spacing. We defer discussion of these sources to §§4.2–4.3.
2.3 Calibration
We measured squared visibilities () for our targets and calibrator stars in each of the 42 spectral channels provided by the grism. The calibrator stars are main sequence stars, with known parallaxes, whose magnitudes are within 0.5 mags of the target magnitudes (Table Spatially Resolved Spectroscopy of Sub-AU-Sized Regions of T Tauri and Herbig Ae/Be Disks). The system visibility (i.e., the point source response of the interferometer) was measured using observations of these calibrators, whose angular sizes were estimated by fitting blackbodies to literature photometry. These size estimates are not crucial since the calibrators are unresolved (i.e., their angular sizes are much smaller than the interferometric fringe spacing) in almost all cases. HD 163955, a calibrator for MWC 275, is mildly resolved; we account for this when computing the system visibility.
We calculated the system visibility appropriate to each target scan by weighting the calibrator data by the internal scatter and the temporal and angular proximity to the target data (Boden et al. 1998). For comparison, we also computed the straight average of the for all calibrators used for a given source, and the system visibility for the calibrator observations closest in time. These methods all produce results consistent within the measurement uncertainties. We adopt the first method in the analysis that follows.
Source and calibrator data were corrected for standard detection biases as described by Colavita (1999) and averaged into 5-s blocks. We accounted for a known bias related to flux level by applying an empirically determined correction111http://msc.caltech.edu/software/KISupport/dataMemos/fluxbias.pdf. Calibrated were then computed by dividing the average measured over 130-s scans (consisting of 5-s sub-blocks) for targets by the average system visibility. Uncertainties are given by the quadrature addition of the internal scatter in the target data and the uncertainty in the system visibility. We average together all of the calibrated data for a given source to produce a single measurement of in each spectral channel. The observations of our targets typically spanned hour, and the averaging therefore has a negligible effect on the uv coverage.
We investigate the uncertainties in our calibration procedure in several ways. First, we examine the calibrated for each scan for one of our targets (V1295 Aql) where we obtained several scans. We also compare calibrated using one calibrator or another. Differences between scans and between the two calibrators provide an estimate of the uncertainties. Results of this test are shown in Figure 1. Across most of the band, channel-to-channel uncertainties are a few percent or less. However, there is a large dispersion in the various measurements around 2.05 m.
A second probe of the uncertainties is provided by applying our calibrations to two main-sequence check stars, HD 167564 and HD 171149 (Figure 2). These stars were observed as calibrators for VV Ser, and are – away from the other nearest calibrators in our dataset. Thus, we expect the uncertainties derived here to be larger than for our target stars, which are within 10∘ of their calibrators. For these two stars, the standard deviation of the calibrated across the bandpass is 1–2%. However, the data for both stars exhibit an apparently systematic feature around 2.05 m, the same spectral region that exhibits larger uncertainties in Figure 1.
We do not have a simple explanation for these large errors at the short-wavelength end of our band. Telluric CO2 features lead to absorption (and hence lower photon counts) on either side of 2.05 m, but not at 2.05 m; a plot of the atmospheric transmission is shown in Figure 3. Furthermore, it is difficult to imagine how any atmospheric or instrumental absorption could vary as quickly as the observed variations (and Figure 1 shows that fluxes in this region vary both positively and negatively, contrary to expectations for time-variable absorption). We speculate that the observed variability near 2.05 m may be due to constructive and destructive interference caused by a known phase irregularity at this wavelength in a dichroic optic.
We adopt 3% channel-to-channel uncertainties for our target stars. However, Figures 1 and 2 indicate that data shortward of m likely has larger errors, and should be treated with additional caution. The normalization of versus wavelength (i.e., the average value of across the band) has an additional uncertainty. Observations of binary stars with known orbits show that the calibrated have a systematic uncertainty of 222http://msc.caltech.edu/software/KISupport/dataMemos/fluxbias.pdf. We therefore assume that in addition to the 3% channel-to-channel uncertainties described above, the normalization of is uncertain by %.
Calibrated for our sample are shown in Figure 4. As discussed above, HD 141569 and VV Ser are excluded from these plots (and from our subsequent analysis) because they are unresolved and over-resolved, respectively, in our observations.
2.4 Flux Calibration
We used the count rates in each channel observed during “foreground integrations” (Colavita 1999) to recover crude spectra for our targets. We divided the measured flux versus wavelength for our targets by the observed fluxes from the calibrator stars, using calibrator scans nearest in time to given target scans, and then multiplied the results by template spectra suitable for the spectral types of the calibrators.
We perform the same tests of our calibration procedure as employed in §2.3. Variations in calibrated fluxes for several scans, using different calibrators, suggest that there are uncertainties in the overall slopes of the spectra that lead to channel-to-channel uncertainties of –10% (Figure 1). These slope variations may arise because of different coupling efficiencies of light at different wavelengths into the single-mode fiber feeding the detector; the relative couplings could also change with the atmospheric seeing. Tests of this calibration procedure for main sequence stars of known spectral type, calibrated using other calibrator stars, indicate channel-to-channel uncertainties of a few percent (Figure 2), and also show evidence for these slope uncertainties.
Because our measured spectra have these potential slope errors, we use broadband photometry at near-IR wavelengths to infer the correct normalization and slope. We compiled near-IR flux measurements from the literature (Mendoza 1966, 1968; Glass & Penston 1974; Hillenbrand et al. 1992; Kenyon & Hartmann 1995; Skrutskie et al. 1996; Jensen & Mathieu 1997; Malfait et al. 1998; Eiroa et al. 2002; Koresko 2002; Cutri et al. 2003; Prato et al. 2003; Eisner et al. 2004), including multiple measurements where available, and then fitted a straight line to these data. We scaled our measured KI spectra so that the slope and normalization matched those of the fitted lines. With these corrections, the spectra contain information about narrow spectral features, but do not contain any original information about the overall normalization or slope (this information comes from the broadband literature photometry). Moreover, since our targets tend to be photometrically variable, this procedure introduces some additional uncertainty in the absolute flux level at the epoch of our KI observations.
2.5 Features of Calibrated and Fluxes
Figure 4 shows the and fluxes calibrated with the procedure outlined in §§2.3–2.4. The calibrated fluxes typically increase with wavelength across the band, consistent with expectations for warm ( K) circumstellar emission. The exhibit different behaviors with wavelength, ranging from positive to negative slopes. Interpretation of these trends requires an accounting of the differing angular resolution of the observations as a function of wavelength, since the resolution gets coarser at longer wavelengths. It is more straightforward to explain the behavior by first converting the measured into angular sizes; we do this below in §3.2.
The fluxes and do not always behave monotonically across the observing window, due to the presence of spectral features associated with hot hydrogen gas, and warm CO and H2O vapor. For example, MWC 480, MWC 275, and V1295 Aql show clear bumps in both flux and near 2.165 m, associated with the Br transition of hydrogen. Spectral features like these may arise in absorption in stellar photospheres, or in emission in the circumstellar material. In §3, we determine contributions to the fluxes and from the central star, enabling investigation of the spectral features arising from the circumstellar emission.
3 Modeling
In this section we use our and flux measurements to constrain the distribution of dust and gas within 1 AU of our sample stars. We first consider the simplest possible model for the emission, a uniform disk (§3.2); this model provides an estimate of how the angular size of the emission depends on wavelength, with essentially no model assumptions. We then explore more physically realistic models that include both gas and dust components. Specifically, we model our sources as optically thin gaseous accretion disks that extend as far as the dust sublimation radius, at which point emission from the puffed-up dust sublimation front dominates. We include various gaseous species in the inner disk as needed to fit the data. Because our and flux measurements contain contributions from both the circumstellar disks and the unresolved central stars of our targets, we remove the stellar component from our measurements before fitting the models described above. The procedure by which stellar and circumstellar components are separated is described in §3.1.
3.1 Separating Stellar and Circumstellar Components
Before fitting physical models to the data, we remove the contribution of the central stars from our measurements. This enables us to model only the circumstellar material around our sources. Because the central stars are unresolved, we know that , and we need only the ratio of the stellar and circumstellar fluxes to remove the stellar contribution to the measured and fluxes.
We estimate the circumstellar-to-stellar flux ratio at each observed wavelength using spectral decomposition (see, e.g., Millan-Gabet et al. 2001). Using optical photometry from the literature, we fit the stellar photosphere. For each source we assume the spectral type given in the literature (also listed in Table Spatially Resolved Spectroscopy of Sub-AU-Sized Regions of T Tauri and Herbig Ae/Be Disks) and determine the stellar radius and reddening providing the best fit to the data; the reddening law of Steenman & Thé (1991) is used. In general we assume that the optical () photometry traces the un-veiled stellar photosphere. However, for AS 205 A, we have veiling measurements at and bands from Eisner et al. (2005), and we use these to precisely fit the photospheric flux. We then extrapolate the photosphere to the band using Kurucz models, which include stellar spectral features like Br absorption in A stars or CO overtone absorption in cooler stars. We compare the extrapolated stellar fluxes with our measured -band fluxes to determine stellar and circumstellar contributions.
With these circumstellar-to-stellar flux ratios, we remove the stellar components of the visibilities:
| (1) |
where is the circumstellar-to-stellar flux ratio. We fit our models for the circumstellar emission to and below.
3.2 Uniform Disk Sizes
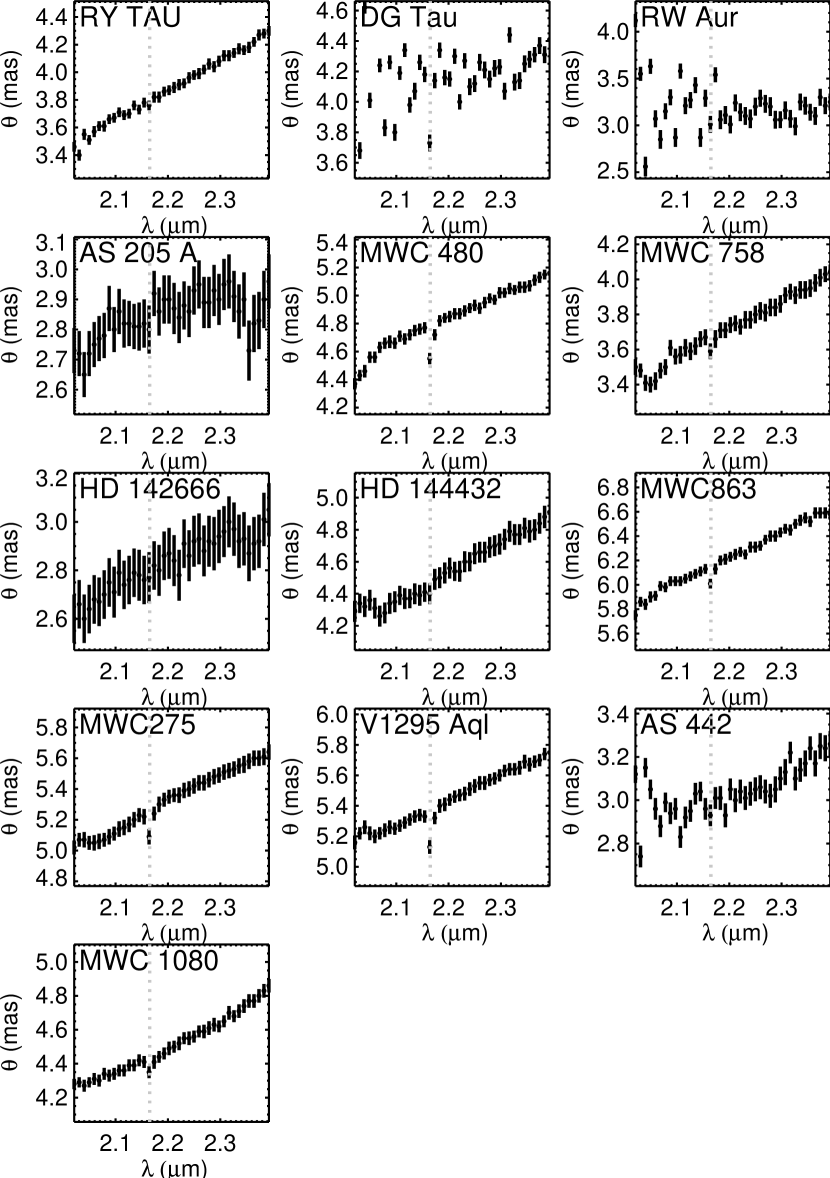
Before interpreting our data in the context of physical models, we begin with a simple geometrical model: a uniform disk (e.g., Eisner et al. 2003). We fit the data for each source, in each channel, with the model. The results, shown in Figure 5, give the “spectral size distribution” of the -band emission, illustrating how the spatial scale of the near-IR emission depends on wavelength.
Figure 5 shows that the angular diameter of the near-IR emission appears to increase with wavelength for all sources in the sample (although the trend is marginal for DG Tau and RW Aur, where the data have lower signal-to-noise). As in previous work (Eisner et al. 2007a; Eisner 2007; Kraus et al. 2008), we interpret this slope as evidence for a hot emission component interior to the inner edge of the dust disk. This hot, compact component increasingly dominates the observed emission at shorter wavelengths, and hence the angular diameter of the emission appears to decrease.
In addition to showing increasing size with wavelength, Figure 5 shows that several objects exhibit emission from the Br transition of hydrogen that is more compact than the circumstellar continuum emission. We see indications of compact Br emission from MWC 480 (reported previously by Eisner 2007), MWC 758 (marginally), HD 144432 (marginally), MWC 863, MWC 275, V1295 Aql, and MWC 1080.
Finally, we see evidence of angular diameter changes due to CO opacity in RW Aur. Figure 6 shows a zoomed-in view of the spectral region encompassing several CO ro-vibrational overtone () bandheads. The flux increases in each of the CO bandheads, demonstrating the presence of CO emission in this object. Moreover, the angular diameter appears to decrease within each of the bandheads, indicating that the CO emission is more compact than the continuum.
3.3 Accretion Disk Models
As a more physically realistic model, we begin with a dusty circumstellar disk whose emission is dominated by the hottest dust near the sublimation radius, and then include gaseous emission interior to the inner edge of the dust. We consider several different gaseous opacity sources, including continuum emission, Br emission, water vapor, and CO. For DG Tau and RW Aur, we do not consider data measured shortward of 2.1 m, since low fluxes ( Jy) lead to extremely noisy data at these wavelengths (Figure 4).
We do not consider models that include only gaseous emission because previous investigators have shown that ring-like dust sublimation fronts are needed to fit broadband SEDs and interferometry data (e.g., Muzerolle et al. 2003; Eisner et al. 2004). Furthermore, Eisner et al. (2007a) showed that gas-only disk models, while they can potentially reproduce observed spectrally dispersed visibilities, can not simultaneously reproduce observed SEDs. We therefore do not consider gas-only models here.
We do not fit the broadband SED simultaneously with our 2.0–2.4 m dataset here, to avoid additional complication. Since our modeling is not constrained by SEDs outside of the band, the inferred properties of the circumstellar emission may not perfectly reflect reality. This is especially true for the gaseous emission, which is often more compact than the spatial resolution of our observations. Nevertheless, the modeling presented below demonstrates the presence of gaseous emission components, and provides a rough estimate of the size scales and temperatures of these components.
3.3.1 Dust Continuum Emission
We assume that the dust emission in our model arises from a single-temperature ring of matter at the disk radius where temperatures become hot enough for dust sublimation (as in previous studies; e.g., Eisner et al. 2004). This ring of emission approximates well (Eisner et al. 2004) the puffed-up inner edge expected for directly irradiated inner disks in hydrostatic equilibrium (Dullemond et al. 2001). The width of the ring is assumed to be two tenths of its radius, consistent with calculations of the expected width of the dust sublimation front (e.g., Isella & Natta 2005). The free parameters of this model are the radius and temperature of the emission ring, and . We determine the best-fit values of these parameters using a grid-based minimization. Uncertainties are determined directly from the surface (e.g., Eisner et al. 2004).
3.3.2 Gaseous Continuum Emission
We assume the radial temperature and surface density profiles of the gas in the inner disk are described by power laws. We take , as appropriate for optically-thin disk material (e.g., Chiang & Goldreich 1997); is the radial temperature profile and is the stellocentric radius. Details of the gaseous emission mechanism may alter this relationship, but we will consider the radial temperature law fixed for simplicity. We assume that the surface density is described by , as inferred for the protosolar nebula (Weidenschilling 1977) and assumed in other disk models (e.g., Chiang & Goldreich 1997; Dullemond et al. 2001). The optical depth, , is directly related to the surface density, and hence . Depending on the normalization of the optical depth profile, the gas may be entirely optically thin, entirely optically thick, or thick in the innermost regions only.
We define the radial temperature and optical depth profiles over an inner disk radius, , to an outer disk radius, . We take to be the radius of the dust ring described in §3.3.1. is left as a free parameter.
The free parameters of the gaseous disk model are the inner radius, , the temperature at the inner radius, , and the optical depth at the inner radius, . When combined with the dust component, the dust+gas continuum emission model has five free parameters. We determine the values of these parameters that provide the best-fit to the data using a Marquardt-Levenberg algorithm. Uncertainties on best-fit parameters are computed from the covariance matrix.
If the gas is optically thick, then only the radial temperature profile is important in determining the resultant flux. However for most sources, simple disk models with optically thick gas predict fluxes larger by an order of magnitude than those observed from our sample. We therefore expect the gas to be (at least partially) optically thin in our modeling. The 2 m emission from optically thin gaseous disk models arises predominantly from the innermost radii. Models including dust and optically thin gas thus resemble two-ring models (like those considered in Eisner et al. 2007a), where hot gaseous emission appears in a ring near the inner radius and warm dust emission arises from the ring-like dust sublimation front.
3.3.3 Water Vapor Emission
Several objects in our sample show additional flux, and accompanying broad features in , at wavelengths m. These features are (in some cases) broader than the systematic features discussed in §2.2, although the data is still affected by these short-wavelength systematic effects. In a previous paper, we reported such features for MWC 480, and modeled the data by adding a single-temperature ring with the opacity of water vapor to a two-ring dust+gas model (Eisner 2007). Here we refine this simple model, and test whether the data for our sources can be fitted with a model where water vapor emission occurs over a range of radii from an inner radius where water is thermally dissociated out to the dust sublimation radius.
We use opacities measured for water vapor (Ludwig 1971) at a range of temperatures (–3000 K) appropriate to protoplanetary disks. Using the gaseous disk model described in §3.3.2, we determine the optical depth at each radius using the assumed surface density profile, which scales as : . For disk radii where K, water vapor can exist and we use from Ludwig (1971). At smaller stellocentric radii, where water would be dissociated, we retain the assumption of continuum emission. While it is also possible that water emission, where is exists, adds to rather than replaces the underlying continuum, we do not consider this possibility in our simple model.
3.3.4 Brackett Gamma Emission
Figures 4 and 5 show that Br emission signatures are present in the flux and data for several objects. In fact, flat spectra in the vicinity of the Br wavelength (2.165 m) may indicate the presence of Br emission for some objects. Since more massive stars, including essentially all of the Herbig Ae/Be stars in our sample, have photospheric Br absorption, non-detection of this absorption feature in the spectra implies that circumstellar Br emission (and continuum excess) is filling in the feature. The effects of photospheric Br absorption are included in the Kurucz models we used to separate stellar and circumstellar components of the measured and fluxes (§3.1).
We model circumstellar Br emission by including additional flux in the gaseous component of our models at 2.165 m. Since Br traces very hot gas ( K), we assume that the emission arises from the innermost disk annulus. In fact, Br emission may be even more compact, but we can not constrain such small size scales with the available angular resolution. Inclusion of Br emission in the model introduces as an additional free parameter the gaseous line-to-continuum ratio in the innermost gaseous annulus.
4 Results
4.1 Dust and Gas within 1 AU of young stars
Our modeling shows clearly that single-temperature rings of emission can not fit the data for our sample (Figure 7; Table 2). This confirms previous inferences from spectrally dispersed interferometric results (Eisner et al. 2007a; Eisner 2007; Kraus et al. 2008; Isella et al. 2008) and from high angular resolution continuum observations (Tannirkulam et al. 2008). The implication is that models where all of the near-IR emission arises from the inner edge of the dusty disk are untenable. Rather, a warm dusty component and a hotter, presumably gaseous, component at smaller stellocentric radii are required to fit the data.
The simple dust+gas continuum model (§3.3) predicts and fluxes compatible with the observations for most sources (Figure 7). We also consider a model where the gaseous opacity is due to water vapor at stellocentric radii where H2O can potentially exist. As shown in Figure 7, these models generally produce fits of comparable quality to the simple continuum models. Models including water vapor also produce more physically realistic fitted values of :. the fitted dust temperatures are between and 1500 K, in agreement with expected sublimation temperatures for silicate dust in protoplanetary disks (e.g, Pollack et al. 1994). However, for RY Tau, the simple dust+gas (continuum) model produces a superior fit to the data.
We illustrate the relative contributions of gas and dust to our models in Figure 8. The figure shows the fluxes produced by the gaseous component and the dust component for our best-fit models including water vapor opacity. The gaseous component includes continuum emission, water vapor emission, and Br emission. In all cases, the gaseous flux represents a significant fraction of the total.
For all sources except AS 205 A, the best-fit dust+water model requires emission from material substantially hotter than 3000 K (Table 2), implying the presence of substantial gaseous continuum emission. The inferred inner disk temperatures for models including water vapor opacity are, in most cases, higher than for models assuming only gas continuum opacity. This difference suggests that the best-fit for models including water vapor requires the gaseous emission to be dominated by the hot continuum component rather than the cooler water vapor component. For AS 205 A, in contrast, it appears that water vapor alone can explain the observed gaseous emission from the inner disk.
RW Aur shows evidence of spatially resolved CO in the inner disk. Emission from the –0, 3–1, and 4–2 bandheads is detected in our spectra, and appears to be more compact than the surrounding continuum emission (Figure 6). This suggests an origin of the CO interior to the dust sublimation radius. The inferred size of the CO emission for this object is compatible with that inferred from modeling of a high dispersion spectrum in terms of a Keplerian disk model (Najita et al. 2003).
DG Tau, which is also known to possess CO overtone emission (e.g., Carr 1989), shows no evidence of such emission in our data. This discrepancy may be due to the poor quality of our data for this object or to variability. The CO emission from DG Tau is known to be variable from studies at multiple epochs (e.g., Carr 1989; Najita et al. 2000, 2003), and some previous studies failed to detect the emission (e.g., Greene & Lada 1996).
MWC 758, MWC 275, V1295 Aql, and AS 442 all show excess flux long-ward of m, consistent with the presence of CO overtone emission (Figure 4). However, none of these show evidence in the visibilities of size differences between CO emission and continuum. Given the signal-to-noise and spectral resolution of our current data, we do not attempt to model the CO emission from any of these targets here.
Several objects exhibit Br emission from hot hydrogen gas, and this emission is more compact than the surrounding continuum emission in all cases. Table 3 lists the inferred stellocentric radii from which the Br emission originates. However, we have somewhat arbitrarily placed the Br emission at the innermost edge of the gaseous accretion disk in our models (§3.3.4). Since the angular resolution of our observations is AU, and there is some degeneracy in our models between the Br flux and angular scale, we can only state confidently that the Br emission arises from radii less than 0.1 AU.
While our model fits indicate that Br emission is present around RW Aur, and is more compact than the continuum, we are not confident in this result given the large uncertainties on for this source in this spectral region. The data for DG Tau also show evidence for compact Br emission, but the noisy data in this spectral region argue for a cautious interpretation. Both DG Tau and RW Aur have previously detected (spatially unresolved) Br emission (Folha & Emerson 2001; Najita et al. 1996b), providing some support for our tentative detections.
MWC 480, HD 144432, MWC 863, V1295 Aql, and MWC 275, all targets that exhibit compact Br emission, were previously reported to show strong Br emission in high-dispersion (spatially unresolved) spectroscopic observations (Garcia Lopez et al. 2006; Brittain et al. 2007; Berthoud 2008). RY Tau, MWC 758, HD 142666, and AS 205 also have previously reported Br emission (Najita et al. 1996b; Folha & Emerson 2001; Garcia Lopez et al. 2006; Berthoud 2008). However, the equivalent widths of the Br emission are small relative to other sources (e.g., MWC 275 or DG Tau), and it is not surprising that we do not detect (or only marginally detect) Br emission from these objects here.
4.2 An unresolved source: HD 141569
Previous near-IR interferometric observations of HD 141569 found it to be unresolved in the band, suggesting that the band emission is produced entirely by the unresolved central star. We re-observed it here to search for spatially extended circumstellar emission associated with gaseous spectral features, which might have been washed out in the previous, broadband observations. The observations presented here, however, show that the source is unresolved at all wavelengths. We also see no evidence of flux above the level expected from the stellar photosphere at any observed wavelength. We conclude that the emission in each of the spectral channels included in our observations is more compact than AU (at the target distance), as expected for stellar emission. We may also infer that no spectral channels contain emission brighter than of the stellar flux within the 50 mas field of view of KI (corresponding to stellocentric radii of AU for this target), since the incoherent contribution of any stronger extended emission would have reduced the measured visibilities. Our finding is consistent with previous studies that found gaseous emission only at stellocentric radii AU (Goto et al. 2006; Brittain et al. 2007), with no warm gas that could have been detected in our observations.
4.3 An over-resolved source: VV Ser
One of the objects in our sample, VV Ser, appears to be over-resolved in our observations. That is, while we detect flux from the object, its angular size is large compared to the mas fringe spacing and hence its is un-detectably close to zero. Because we can only place a lower limit on the size of the emission, and can not trace how the size depends on wavelength, we have excluded VV Ser from the analysis presented above.
Previous observations of VV Ser, with fringe spacings comparable to those obtained in the present study, measured a uniform disk angular diameter of mas, and showed the disk to be nearly edge-on (Eisner et al. 2003, 2004). Our present non-detection indicates that the size scale of the band emission has varied significantly between 2003 and 2007. The source is also known the photometrically variable at optical through infrared wavelengths (e.g., Herbst & Shevchenko 1999; Eiroa et al. 2002).
These findings may indicate variability associated with the UX Ori phenomenon. In this scenario, a vertically extended inner edge of the nearly edge-on disk around VV Ser periodically blocks the central star (e.g., Dullemond et al. 2003; Pontoppidan et al. 2007). When the star is blocked, the near-IR emission would be dominated by the extended circumstellar component, whereas when the star is visible, the observed size would be the flux-weighted average of the unresolved star and the disk.
5 Discussion
5.1 Compact Br Emission
We observe Br emission from several of our targets, and in all cases this line emission appears more compact than the surrounding continuum. This contrasts with previous results that found Br emission more extended than (Malbet et al. 2007) or on a comparable spatial scale to (Tatulli et al. 2007) the dust continuum. Sources where Br appears more extended are high-mass stars, and Eisner (2007) speculated that the Br emission from young stars may trace both infalling and outflowing components, with the latter increasingly dominating for higher mass stars.
The results presented here belie this hypothesis. We observe Br emission more compact than dust continuum in sources spanning a range of spectral types, from K3 to B0. Based on our current findings, we suggest that young stars typically produce most of their Br emission close to their central stars in accretion columns and/or shocks. Br emission in extended winds seems rarely to be strong enough to dominate the line emission. However, given the small number of Herbig Be stars observed to date, the picture is less clear for higher-mass ( M⊙) stars.
5.2 Inner Disk Gas: Trends with Stellar Luminosity
For the majority of our sources, models that include only dust emission do not fit the data well, while models including hot gaseous emission interior to the dust sublimation do fit the data (§4.1). However, if we examine only the less luminous stars in our sample, the T Tauri stars, we find that this conclusion is less robust. For all of the T Tauri stars in our sample (RY Tau, DG Tau, RW Aur, and AS 205), dust-only models can provide relatively good matches to the slopes seen for fluxes and . Models including gas and dust are still superior, but the difference is not nearly as pronounced as for the more massive Herbig Ae/Be stars in our sample.
We suggest a simple explanation for this trend. For T Tauri sources, the less luminous central stars provide less heating and hence the dust can exist closer to the star than for the more massive Herbig stars. While gaseous disks are likely to extend in to similar radii in both types of sources, the gas may be hotter near to more luminous stars. Higher mass stars have a larger temperature difference between hot gas and warm dust, and also a larger spatial separation of the two components, producing larger temperature gradients. These larger gradients, in turn, lead to larger slopes in the and fluxes versus wavelength.
This is not to say that T Tauri stars do not have significant gaseous emission. Models including gaseous emission provide superior fits to our data, and previous authors have argued that gaseous emission is needed to self-consistently model SEDs and visibilities (Akeson et al. 2005b). Furthermore, modeling of observed gaseous emission line profiles from T Tauri stars under the assumption of Keplerian rotation has provided evidence for gaseous emission interior to the dust sublimation radius (e.g., Najita et al. 2007). However, the observed temperature gradients between dust and gas appear less pronounced than do those around higher-mass stars.
5.3 The Nature of the Gaseous Opacity
Water is predicted to be abundant in the inner regions of disks (e.g., Gorti & Hollenbach 2004), although it can be reduced in abundance in highly irradiated disks (e.g., Thi & Bik 2005). Muzerolle et al. (2004) predict that dust-free inner disks will commonly show water in emission or absorption depending on the disk accretion rate (see also Calvet et al. 1991). However, near-IR water spectral features are detected only rarely in T Tauri stars (e.g., Carr et al. 2004; Najita et al. 2007) and have only been reported in a few Herbig Ae/Be stars (Thi & Bik 2005, Najita et al. 2008).
For most sources, a model that includes water vapor can fit the data well. For AS 205 A, it appears that water vapor alone can reproduce the observed gaseous emission interior to the dust sublimation radius. This is consistent with the detection of abundant water vapor, and an inferred origin at stellocentric radii as small as 0.3 AU, in high dispersion -band spectra of AS 205 (Salyk et al. 2008).
However, in some cases (e.g., for RY Tau), models including water vapor provide fits of lesser quality than models where the gas emits only continuum radiation. Furthermore, for all sources except AS 205 A, our best-fit models require continuum emission in addition to water vapor emission, since the gas is inferred to be hotter than 3000 K in the innermost regions. This casts some doubt as to whether H2O emission is needed to fit the data in all cases.
For the columns of water vapor implied by our best-fit models, one might expect our targets to show H2O emission lines in lower spatial resolution spectroscopic data. High dispersion spectroscopic observations of several of our sample objects in the -band failed to detect strong water emission lines (Najita et al. 2008; Mandell et al. 2008), and archival ISO/SWS data for many of our targets do not show longer-wavelength H2O features that typically accompany the 2 m features modeled in this work. These null results provide further reason to question whether water vapor is a viable explanation for the observed compact, hot, circumstellar continuum emission from some of our sample.
We therefore pose the question: what can produce gaseous continuum emission in the inner regions of protoplanetary disks? We discuss several possible explanations below, and argue that emission from free-free transitions of Hydrogen and from the negative Hydrogen ion is the most viable mechanism.
5.3.1 Refractory Dust Grains
While dust grains produce continuum emission, the inferred temperatures of the hot component ( K) in our data are higher than the sublimation temperatures for even the most refractory dust grains (e.g., Pollack et al. 1994). Even for calcium, magnesium, or titanium rich oxides, sublimation temperatures above 2000 K occur only for ambient pressures higher than 0.1–1 bar (e.g., Lewis 1997), orders of magnitude larger than the pressures expected in protoplanetary disks ( bar for typical densities and temperatures in inner disk regions; e.g., Muzerolle et al. 2004). Dust emission therefore seems highly implausible as an explanation for the hot, compact emission.
5.3.2 High Atomic Hydrogen
Recombination of photoionized hydrogen into high- states may also produce a (pseudo) continuum opacity. This mechanism is also probably responsible for the Br emission observed toward many of our targets, since it produces hydrogen in the level, which can then cascade down to the level and produce the line emission. Even higher states, which are longer-lived, might be able to produce more extended and continuum-like emission. Photoionization cross sections for these high- states are cm-2, and so assuming a gas column density of cm-2 (a typical value for young stars accreting material at M⊙ yr-1; e.g., Muzerolle et al. 2004), we see that a fractional abundance of these high states of would be needed to produce an optical depth larger than unity. Estimating the fractional abundance requires knowledge of the ionization and radiation structure of the disk, which is beyond the scope of this paper. However, it seems plausible that recombination to high hydrogen states could contribute some opacity in the inner disk.
5.3.3 Free-free
Free-free radiation, produced in ionized winds or accretion columns, or in disks (as for classical Be stars), may also produce continuum emission. Free-free emission may occur around the higher-mass stars in our sample, which produce more intense ionizing radiation fields, or in shocked, infalling gas around lower-mass stars. The cross section of free-free emission at wavelengths around 2 m is cm4 dyne-1 at temperatures of a few thousand Kelvin. Assuming the free-free emission arises in a disk with a gas temperatuture of 3000 K, a gas column density of cm-2, a fractional ionization of , and HH2=0.01, we find an electron pressure of dyne cm-2, and an optical depth of . Fractional ionizations of can arise from the ionization of metals with low ionization potentials, such as Na or Fe; higher fractional ionizations are difficult to achieve since photons with eV are unlikely to penetrate deeply into such a dense disk. However, somewhat higher optical depths of free-free emission may be achieved if the gas column density is higher than the value assumed above. Some of our targets may be accreting faster than M⊙ yr-1, leading to higher gas columns and more free-free emission. It thus seems possible that free-free emission could contribute significantly in the inner disk.
5.3.4 H-
The negative hydrogen ion, H-, appears as a promising candidate for explaining this emission, since it can produce free-free continuum emission in the band (e.g., Chandrasekhar & Breen 1946; Bell & Berrington 1987; John 1988; Gray 1992). For free-free emission from H- at K in the -band, the optical depth is (following Gray 1992)
| (2) |
With the same assumptions at in §5.3.3, we find an optical depth of in the inner disk. As above, higher gas columns may lead to correspondingly higher optical depths. Free-free emission from H- therefore seems like a plausible explanation for the hot, compact emission seen in our data.
6 Conclusions
We presented spatially resolved near-IR spectroscopic observations that probed the gas and dust in the inner disks around 15 young stars. One source, HD 141569, was unresolved at all wavelengths between 2.0 and 2.4 m, indicating a lack of dust or gas in the inner disk regions. Another target, VV Ser, was over-resolved, indicating that the emission spans angles larger than mas at all observed wavelengths.
The near-IR emission from the remaining targets was resolved, and our data show that the angular size of the near-IR emission increases with wavelength in all cases. This behavior suggests temperature gradients in these inner disks, arising from the combination of warm dust at its sublimation temperature and hotter, presumably gaseous material within the dust sublimation radius. Our data clearly indicate emission from the Br transition of hydrogen in several objects, and suggest that water vapor and carbon monoxide gas are present in the inner disks of some targets.
We constructed simple physical models of the inner disk, including dust and gas emission, and we fitted them to our data to constrain the spatial distribution and temperature of dust and gas emission components. We considered models including only dust emission; dust, gas continuum, and Br emission; and dust, gas continuum, water vapor, and Br emission. Models incorporating only dust emission can not fit the data for any of our sources well. In contrast, models including dust and gas emission are suitable for explaining our data. The inclusion or exclusion of water vapor in these dust+gas models did not substantially affect the quality of the fits in most cases.
For all sources where Br emission is observed, we find it to be compact relative to the continuum emission. This contrasts with previous findings, which found Br emission to be extended relative to the continuum around some high-mass stars. The results presented here suggest that Br commonly traces infalling material around young stars spanning a large range in stellar mass.
CO emission is tentatively observed towards several objects, and we see evidence that this emission has a more compact spatial distribution than the dust around RW Aur. For other objects, our data are insufficient to place meaningful constraints on the relative spatial distribution of CO and other emission components. We will re-observe these targets in the near future with higher dispersion, to obtain better signal-to-noise for the relatively narrow CO lines and better constrain their spatial distribution.
While models including water vapor opacity often fit our data well, the best-fit models generally also require continuum emission from material that is too hot to be water (since water dissociates at K). We do not have a ready explanation for the source of this hot continuum emission, but we speculate that it may trace free-free emission from hydroden and/or H-. The gas densities and fractional ionizations required to produce such emission seem plausible in the inner regions of protoplanetary disks, suggesting that free-free emission from H and H- is a viable explanation for the compact continuum emission seen in our data.
Data presented herein were obtained at the W. M. Keck Observatory, in part from telescope time allocated to the National Aeronautics and Space Administration through the agency’s scientific partnership with the California Institute of Technology and the University of California. The Observatory was made possible by the generous financial support of the W. M. Keck Foundation. The authors wish to recognize and acknowledge the cultural role and reverence that the summit of Mauna Kea has always had within the indigenous Hawaiian community. We are most fortunate to have the opportunity to conduct observations from this mountain. This work has used software from the Michelson Science Center at the California Institute of Technology. The authors thank the entire Keck Interferometer team for making these observations possible. We also wish to thank the referee, Geoff Blake, for his thoughtful and detailed referee report, which greatly improved the manuscript.
References
- Akeson et al. (2005a) Akeson, R. L., Boden, A. F., Monnier, J. D., Millan-Gabet, R., Beichman, C., Beletic, J., Calvet, N., Hartmann, L., Hillenbrand, L., Koresko, C., Sargent, A., & Tannirkulam, A. 2005a, ApJ, 635, 1173
- Akeson et al. (2005b) Akeson, R. L., Walker, C. H., Wood, K., Eisner, J. A., Scire, E., Penprase, B., Ciardi, D. R., van Belle, G. T., Whitney, B., & Bjorkman, J. E. 2005b, ApJ, 622, 440
- Bell & Berrington (1987) Bell, K. L., & Berrington, K. A. 1987, Journal of Physics B Atomic Molecular Physics, 20, 801
- Berthoud (2008) Berthoud, M. G. 2008, PhD thesis, Cornell University
- Bertout et al. (1988) Bertout, C., Basri, G., & Bouvier, J. 1988, ApJ, 330, 350
- Blake & Boogert (2004) Blake, G. A. & Boogert, A. C. A. 2004, ApJ, 606, L73
- Boden et al. (1998) Boden, A. F., Colavita, M. M., van Belle, G. T., & Shao, M. 1998, in Proc. SPIE Vol. 3350, p. 872-880, Astronomical Interferometry, Robert D. Reasenberg; Ed., 872–880
- Brittain et al. (2007) Brittain, S. D., Simon, T., Najita, J. R., & Rettig, T. W. 2007, ApJ, 659, 685
- Calvet et al. (1991) Calvet, N., Hartmann, L., & Kenyon, S. J. 1991, ApJ, 383, 752
- Carr (1989) Carr, J. S. 1989, ApJ, 345, 522
- Carr et al. (2004) Carr, J. S., Tokunaga, A. T., & Najita, J. 2004, ApJ, 603, 213
- Chandrasekhar & Breen (1946) Chandrasekhar, S. & Breen, F. H. 1946, ApJ, 104, 430
- Chiang & Goldreich (1997) Chiang, E. I. & Goldreich, P. 1997, ApJ, 490, 368
- Colavita et al. (2003) Colavita, M., Akeson, R., Wizinowich, P., Shao, M., Acton, S., Beletic, J., Bell, J., Berlin, J., Boden, A., Booth, A., Boutell, R., Chaffee, F., Chan, D., Chock, J., Cohen, R., Crawford, S., Creech-Eakman, M., Eychaner, G., Felizardo, C., Gathright, J., Hardy, G., Henderson, H., Herstein, J., Hess, M., Hovland, E., Hrynevych, M., Johnson, R., Kelley, J., Kendrick, R., Koresko, C., Kurpis, P., Le Mignant, D., Lewis, H., Ligon, E., Lupton, W., McBride, D., Mennesson, B., Millan-Gabet, R., Monnier, J., Moore, J., Nance, C., Neyman, C., Niessner, A., Palmer, D., Reder, L., Rudeen, A., Saloga, T., Sargent, A., Serabyn, E., Smythe, R., Stomski, P., Summers, K., Swain, M., Swanson, P., Thompson, R., Tsubota, K., Tumminello, A., van Belle, G., Vasisht, G., Vause, J., Walker, J., Wallace, K., & Wehmeier, U. 2003, ApJ, 592, L83
- Colavita (1999) Colavita, M. M. 1999, PASP, 111, 111
- Colavita & Wizinowich (2003) Colavita, M. M. & Wizinowich, P. L. 2003, in Interferometry for Optical Astronomy II. Edited by Wesley A. Traub. Proceedings of the SPIE, Volume 4838, pp. 79-88 (2003)., 79–88
- Cutri et al. (2003) Cutri, R. M., Skrutskie, M. F., van Dyk, S., Beichman, C. A., Carpenter, J. M., Chester, T., Cambresy, L., Evans, T., Fowler, J., Gizis, J., Howard, E., Huchra, J., Jarrett, T., Kopan, E. L., Kirkpatrick, J. D., Light, R. M., Marsh, K. A., McCallon, H., Schneider, S., Stiening, R., Sykes, M., Weinberg, M., Wheaton, W. A., Wheelock, S., & Zacarias, N. 2003, 2MASS All Sky Catalog of point sources. (The IRSA 2MASS All-Sky Point Source Catalog, NASA/IPAC Infrared Science Archive. http://irsa.ipac.caltech.edu/applications/Gator/)
- Dullemond et al. (2001) Dullemond, C. P., Dominik, C., & Natta, A. 2001, ApJ, 560, 957
- Dullemond et al. (2003) Dullemond, C. P., van den Ancker, M. E., Acke, B., & van Boekel, R. 2003, ApJ, 594, L47
- Eiroa et al. (2002) Eiroa, C., Oudmaijer, R. D., Davies, J. K., de Winter, D., Garzón, F., Palacios, J., Alberdi, A., Ferlet, R., Grady, C. A., Cameron, A., Deeg, H. J., Harris, A. W., Horne, K., Merín, B., Miranda, L. F., Montesinos, B., Mora, A., Penny, A., Quirrenbach, A., Rauer, H., Schneider, J., Solano, E., Tsapras, Y., & Wesselius, P. R. 2002, A&A, 384, 1038
- Eisner (2007) Eisner, J. A. 2007, Nature, 447, 562
- Eisner et al. (2007a) Eisner, J. A., Chiang, E. I., Lane, B. F., & Akeson, R. L. 2007a, ApJ, 657, 347
- Eisner et al. (2007b) Eisner, J. A., Graham, J. R., Akeson, R. L., Ligon, E. R., Colavita, M. M., Basri, G., Summers, K., Ragland, S., & Booth, A. 2007b, ApJ, 654, L77
- Eisner et al. (2005) Eisner, J. A., Hillenbrand, L. A., White, R. J., Akeson, R. L., & Sargent, A. I. 2005, ApJ, 623, 952
- Eisner et al. (2007c) Eisner, J. A., Hillenbrand, L. A., White, R. J., Bloom, J. S., Akeson, R. L., & Blake, C. H. 2007c, ApJ, 669, 1072
- Eisner et al. (2003) Eisner, J. A., Lane, B. F., Akeson, R. L., Hillenbrand, L., & Sargent, A. 2003, ApJ, 588, 360
- Eisner et al. (2004) Eisner, J. A., Lane, B. F., Hillenbrand, L., Akeson, R., & Sargent, A. 2004, ApJ, 613, 1049
- Folha & Emerson (2001) Folha, D. F. M. & Emerson, J. P. 2001, A&A, 365, 90
- Garcia Lopez et al. (2006) Garcia Lopez, R., Natta, A., Testi, L., & Habart, E. 2006, A&A, 459, 837
- Glass & Penston (1974) Glass, I. S. & Penston, M. V. 1974, MNRAS, 167, 237
- Gorti & Hollenbach (2004) Gorti, U. & Hollenbach, D. 2004, ApJ, 613, 424
- Goto et al. (2006) Goto, M., Usuda, T., Dullemond, C. P., Henning, T., Linz, H., Stecklum, B., & Suto, H. 2006, ApJ, 652, 758
- Gray (1992) Gray, D. F. 1992, The Observation and Analysis of Stellar Photospheres, Cambridge, UK: Cambridge University Press
- Greene & Lada (1996) Greene, T. P. & Lada, C. J. 1996, AJ, 112, 2184
- Herbig & Bell (1988) Herbig, G. H., & Bell, K. R. 1988, Lick Observatory Bulletin, Santa Cruz: Lick Observatory
- Herbst & Shevchenko (1999) Herbst, W. & Shevchenko, V. S. 1999, AJ, 118, 1043
- Hillenbrand et al. (1992) Hillenbrand, L. A., Strom, S. E., Vrba, F. J., & Keene, J. 1992, ApJ, 397, 613
- Isella & Natta (2005) Isella, A. & Natta, A. 2005, A&A, 438, 899
- Isella et al. (2008) Isella, A., Tatulli, E., Natta, A., & Testi, L. 2008, A&A, 483, L13
- Jensen & Mathieu (1997) Jensen, E. L. N. & Mathieu, R. D. 1997, AJ, 114, 301
- John (1988) John, T. L. 1988, A&A, 193, 189
- Kenyon & Hartmann (1995) Kenyon, S. J. & Hartmann, L. 1995, ApJS, 101, 117
- Koresko (2002) Koresko, C. D. 2002, AJ, 124, 1082
- Kraus et al. (2008) Kraus, S., Preibisch, T., & Ohnaka, K. 2008, ApJ, 676, 490
- Lada & Adams (1992) Lada, C. J. & Adams, F. C. 1992, ApJ, 393, 278
- Lewis (1997) Lewis, J. S. 1997, Physics and chemistry of the solar system, Rev. ed. Publisher: San Diego: Academic Press, 1997. ISBN: 0124467423
- Ludwig (1971) Ludwig, C. B. 1971, Appl. Opt., 10, 1057
- Malbet et al. (2007) Malbet, F., Benisty, M., de Wit, W.-J., Kraus, S., Meilland, A., Millour, F., Tatulli, E., Berger, J.-P., Chesneau, O., Hofmann, K.-H., Isella, A., Natta, A., Petrov, R. G., Preibisch, T., Stee, P., Testi, L., Weigelt, G., Antonelli, P., Beckmann, U., Bresson, Y., Chelli, A., Dugué, M., Duvert, G., Gennari, S., Glück, L., Kern, P., Lagarde, S., Le Coarer, E., Lisi, F., Perraut, K., Puget, P., Rantakyrö, F., Robbe-Dubois, S., Roussel, A., Zins, G., Accardo, M., Acke, B., Agabi, K., Altariba, E., Arezki, B., Aristidi, E., Baffa, C., Behrend, J., Blöcker, T., Bonhomme, S., Busoni, S., Cassaing, F., Clausse, J.-M., Colin, J., Connot, C., Delboulbé, A., Domiciano de Souza, A., Driebe, T., Feautrier, P., Ferruzzi, D., Forveille, T., Fossat, E., Foy, R., Fraix-Burnet, D., Gallardo, A., Giani, E., Gil, C., Glentzlin, A., Heiden, M., Heininger, M., Hernandez Utrera, O., Kamm, D., Kiekebusch, M., Le Contel, D., Le Contel, J.-M., Lesourd, T., Lopez, B., Lopez, M., Magnard, Y., Marconi, A., Mars, G., Martinot-Lagarde, G., Mathias, P., Mège, P., Monin, J.-L., Mouillet, D., Mourard, D., Nussbaum, E., Ohnaka, K., Pacheco, J., Perrier, C., Rabbia, Y., Rebattu, S., Reynaud, F., Richichi, A., Robini, A., Sacchettini, M., Schertl, D., Schöller, M., Solscheid, W., Spang, A., Stefanini, P., Tallon, M., Tallon-Bosc, I., Tasso, D., Vakili, F., von der Lühe, O., Valtier, J.-C., Vannier, M., & Ventura, N. 2007, A&A, 464, 43
- Malfait et al. (1998) Malfait, K., Bogaert, E., & Waelkens, C. 1998, A&A, 331, 211
- Mandell et al. (2008) Mandell, A. M., Mumma, M. J., Blake, G. A., Bonev, B. P., Villanueva, G. L., & Salyk, C. 2008, ApJ, 681, L25
- Marcy et al. (2005) Marcy, G., Butler, R. P., Fischer, D., Vogt, S., Wright, J. T., Tinney, C. G., & Jones, H. R. A. 2005, Progress of Theoretical Physics Supplement, 158, 24
- Mendoza (1966) Mendoza, E. E. 1966, ApJ, 143, 1010
- Mendoza (1968) —. 1968, ApJ, 151, 977
- Millan-Gabet et al. (2007) Millan-Gabet, R., Malbet, F., Akeson, R., Leinert, C., Monnier, J., & Waters, R. 2007, in Protostars and Planets V, ed. B. Reipurth, D. Jewitt, & K. Keil, 539–554
- Millan-Gabet et al. (2001) Millan-Gabet, R., Schloerb, F. P., & Traub, W. A. 2001, ApJ, 546, 358
- Monnier et al. (2006) Monnier, J. D., Berger, J.-P., Millan-Gabet, R., Traub, W. A., Schloerb, F. P., Pedretti, E., Benisty, M., Carleton, N. P., Haguenauer, P., Kern, P., Labeye, P., Lacasse, M. G., Malbet, F., Perraut, K., Pearlman, M., & Zhao, M. 2006, ApJ, 647, 444
- Monnier et al. (2005) Monnier, J. D., Millan-Gabet, R., Billmeier, R., Akeson, R. L., Wallace, D., Berger, J.-P., Calvet, N., D’Alessio, P., Danchi, W. C., Hartmann, L., Hillenbrand, L. A., Kuchner, M., Rajagopal, J., Traub, W. A., Tuthill, P. G., Boden, A., Booth, A., Colavita, M., Gathright, J., Hrynevych, M., Le Mignant, D., Ligon, R., Neyman, C., Swain, M., Thompson, R., Vasisht, G., Wizinowich, P., Beichman, C., Beletic, J., Creech-Eakman, M., Koresko, C., Sargent, A., Shao, M., & van Belle, G. 2005, ApJ, 624, 832
- Muzerolle et al. (2003) Muzerolle, J., Calvet, N., Hartmann, L., & D’Alessio , P. 2003, ApJ, 597, L865
- Muzerolle et al. (2004) Muzerolle, J., D’Alessio, P., Calvet, N., & Hartmann, L. 2004, ApJ, 617, 406
- Najita et al. (1996a) Najita, J., Carr, J. S., Glassgold, A. E., Shu, F. H., & Tokunaga, A. T. 1996a, ApJ, 462, 919
- Najita et al. (2003) Najita, J., Carr, J. S., & Mathieu, R. D. 2003, ApJ, 589, 931
- Najita et al. (1996b) Najita, J., Carr, J. S., & Tokunaga, A. T. 1996b, ApJ, 456, 292
- Najita et al. (2007) Najita, J. R., Carr, J. S., Glassgold, A. E., & Valenti, J. A. 2007, in Protostars and Planets V, B. Reipurth, D. Jewitt, and K. Keil (eds.), University of Arizona Press, Tucson, 951 pp., 2007., p.507-522, ed. B. Reipurth, D. Jewitt, & K. Keil, 507–522
- Najita et al. (2008) Najita, J. R., Doppmann, G., Carr, J. S., Graham, J., & Eisner, J., ApJ, 2008, in press
- Najita et al. (2000) Najita, J. R., Edwards, S., Basri, G., & Carr, J. 2000, Protostars and Planets IV, 457
- Perryman et al. (1997) Perryman, M. A. C., Lindegren, L., Kovalevsky, J., Hoeg, E., Bastian, U., Bernacca, P. L., Crézé, M., Donati, F., Grenon, M., van Leeuwen, F., van der Marel, H., Mignard, F., Murray, C. A., Le Poole, R. S., Schrijver, H., Turon, C., Arenou, F., Froeschlé, M., & Petersen, C. S. 1997, A&A, 323, L49
- Pollack et al. (1994) Pollack, J. B., Hollenbach, D., Beckwith, S., Simonelli, D. P., Roush, T., & Fong, W. 1994, ApJ, 421, 615
- Pontoppidan et al. (2008) Pontoppidan, K. M., Blake, G. A., van Dishoeck, E. F., Smette, A., Ireland, M. J., & Brown, J. 2008, ApJ, 684, 1323
- Pontoppidan et al. (2007) Pontoppidan, K. M., Dullemond, C. P., Blake, G. A., Boogert, A. C. A., van Dishoeck, E. F., Evans, II, N. J., Kessler-Silacci, J., & Lahuis, F. 2007, ApJ, 656, 980
- Prato et al. (2003) Prato, L., Greene, T. P., & Simon, M. 2003, ApJ, 584, 853
- Salyk et al. (2008) Salyk, C., Pontoppidan, K. M., Blake, G. A., Lahuis, F., van Dishoeck, E. F., & Evans, II, N. J. 2008, ApJ, 676, L49
- Shu et al. (1994) Shu, F., Najita, J., Ostriker, E., Wilkin, F., Ruden, S., & Lizano, S. 1994, ApJ, 429, 781
- Skrutskie et al. (1996) Skrutskie, M. F., Meyer, M. R., Whalen, D., & Hamilton, C. 1996, AJ, 112, 2168
- Steenman & Thé (1991) Steenman, H. & Thé, P. S. 1991, Ap&SS, 184, 9
- Tannirkulam et al. (2008) Tannirkulam, A., Monnier, J. D., Millan-Gabet, R., Harries, T. J., Pedretti, E., ten Brummelaar, T. A., McAlister, H., Turner, N., Sturmann, J., & Sturmann, L. 2008, ApJ, 677, L51
- Tatulli et al. (2007) Tatulli, E., Isella, A., Natta, A., Testi, L., Marconi, A., Malbet, F., Stee, P., Petrov, R. G., Millour, F., Chelli, A., Duvert, G., Antonelli, P., Beckmann, U., Bresson, Y., Dugué, M., Gennari, S., Glück, L., Kern, P., Lagarde, S., Le Coarer, E., Lisi, F., Perraut, K., Puget, P., Rantakyrö, F., Robbe-Dubois, S., Roussel, A., Weigelt, G., Zins, G., Accardo, M., Acke, B., Agabi, K., Altariba, E., Arezki, B., Aristidi, E., Baffa, C., Behrend, J., Blöcker, T., Bonhomme, S., Busoni, S., Cassaing, F., Clausse, J.-M., Colin, J., Connot, C., Delboulbé, A., Domiciano de Souza, A., Driebe, T., Feautrier, P., Ferruzzi, D., Forveille, T., Fossat, E., Foy, R., Fraix-Burnet, D., Gallardo, A., Giani, E., Gil, C., Glentzlin, A., Heiden, M., Heininger, M., Hernandez Utrera, O., Hofmann, K.-H., Kamm, D., Kiekebusch, M., Kraus, S., Le Contel, D., Le Contel, J.-M., Lesourd, T., Lopez, B., Lopez, M., Magnard, Y., Mars, G., Martinot-Lagarde, G., Mathias, P., Mège, P., Monin, J.-L., Mouillet, D., Mourard, D., Nussbaum, E., Ohnaka, K., Pacheco, J., Perrier, C., Rabbia, Y., Rebattu, S., Reynaud, F., Richichi, A., Robini, A., Sacchettini, M., Schertl, D., Schöller, M., Solscheid, W., Spang, A., Stefanini, P., Tallon, M., Tallon-Bosc, I., Tasso, D., Vakili, F., von der Lühe, O., Valtier, J.-C., Vannier, M., & Ventura, N. 2007, A&A, 464, 55
- Thi & Bik (2005) Thi, W.-F. & Bik, A. 2005, A&A, 438, 557
- Weidenschilling (1977) Weidenschilling, S. J. 1977, Ap&SS, 51, 153
- White & Ghez (2001) White, R. J. & Ghez, A. M. 2001, ApJ, 556, 265
| Source | Spectral Type | References | |||||
|---|---|---|---|---|---|---|---|
| Target Stars | |||||||
| RY Tau | 04 21 57.409 | +28 26 35.56 | 140 | K1 | 10.2 | 5.4 | 1 |
| DG Tau | 04 27 04.700 | +26 06 16.20 | 140 | K3 | 12.4 | 7.0 | 2 |
| MWC 480 | 04 58 46.266 | +29 50 37.00 | 140 | A2 | 7.7 | 5.5 | 3 |
| RW Aur A | 05 07 49.568 | +30 24 05.161 | 140 | K2 | 10.5 | 7.0 | 2 |
| MWC 758 | 05 30 27.530 | +25 19 57.08 | 140 | A3 | 8.3 | 5.8 | 3 |
| HD 141569 | 15 49 57.75 | -03 55 16.4 | 99 | B9/A0 | 7.1 | 6.7 | 3 |
| HD 142666 | 15 56 40.023 | -22 01 40.01 | 116 | A8 | 8.8 | 6.1 | 4 |
| HD 144432 | 16 06 57.957 | -27 43 09.81 | 145 | A9 | 8.2 | 5.9 | 4 |
| AS 205 A | 16 11 31.402 | -18 38 24.54 | 160 | K5 | 12.1 | 6.0 | 5 |
| MWC 863 A | 16 40 17.922 | -23 53 45.18 | 150 | A2 | 8.9 | 5.5 | 4 |
| MWC 275 | 17 56 21.288 | -21 57 21.88 | 122 | A1 | 6.9 | 4.8 | 4 |
| VV Ser | 18 28 47.860 | +00 08 40.00 | 310 | A0 | 11.9 | 6.3 | 3 |
| V1295 Aql | 20 03 02.510 | +05 44 16.68 | 290 | B9/A0 | 7.8 | 5.9 | 3 |
| AS 442 | 20 47 37.470 | +43 47 24.90 | 600 | B8 | 10.9 | 6.6 | 3 |
| MWC 1080 | 23 17 25.574 | +60 50 43.34 | 1000 | B0 | 11.6 | 4.7 | 3 |
| Calibrator Stars | Applied to: | ||||||
| HD 27777 | 04 24 29.155 | +34 07 50.73 | 187 | B8V | 5.7 | 6.0 | RY Tau,MWC 480,MWC 758 |
| HD23642 | 03 47 29.453 | +24 17 18.04 | 110 | A0V | 6.8 | 6.8 | DG Tau,RW Aur |
| HD23632 | 03 47 20.969 | +23 48 12.05 | 120 | A1V | 7.0 | 7.0 | DG Tau,RW Aur |
| HD31464 | 04 57 06.426 | +24 45 07.90 | 45 | G5V | 8.6 | 7.0 | DG Tau,RW Aur |
| HD139364 | 15 38 25.358 | -19 54 47.45 | 53 | F3V | 6.7 | 5.7 | HD 142666,HD 144432,AS 205 A |
| HD 141247 | 15 48 11.770 | -04 47 09.684 | 85 | F9V | 8.1 | 6.7 | HD 141569 |
| HD 143459 | 16 00 47.633 | -08 24 40.87 | 141 | A0Vs | 5.5 | 5.5 | HD 142666,HD 144432,AS 205 A |
| HD 145788 | 16 12 56.583 | -04 13 14.912 | 171 | A1V | 6.3 | 6.2 | HD 141569 |
| HD 149013 | 16 32 38.133 | -15 59 15.12 | 41 | F8V | 7.0 | 5.7 | MWC 863 |
| HD 163955 | 17 59 47.553 | -23 48 58.08 | 134 | B9V | 4.7 | 4.9 | MWC 275 |
| HD 170657 | 18 31 18.960 | -18 54 31.72 | 13 | K1V | 6.8 | 4.7 | MWC 275 |
| HD 183324 | 19 29 00.988 | +01 57 01.61 | 59 | A0V | 5.8 | 5.8 | V1295 Aql |
| HD 188385 | 19 54 40.200 | +07 08 25.27 | 81 | A2V | 6.1 | 6.1 | V1295 Aql |
| HD199099 | 20 53 26.390 | +42 24 36.72 | 138 | A1V | 6.7 | 6.7 | AS 442,MWC 1080 |
| HD1404 | 00 18 19.657 | +36 47 06.81 | 43 | A2V | 4.5 | 4.5 | AS 442,MWC 1080 |
| Source | ||||||
|---|---|---|---|---|---|---|
| (K) | (AU) | (K) | (AU) | |||
| Dust Models | ||||||
| RY Tau | 44.34 | 1750 10 | 0.16 0.01 | |||
| MWC 480 | 31.85 | 1450 10 | 0.20 0.01 | |||
| MWC 758 | 17.89 | 1610 10 | 0.17 0.01 | |||
| DG Tau | 4.70 | 1260 10 | 0.18 0.01 | |||
| RW Aur | 3.60 | 1330 10 | 0.14 0.01 | |||
| HD 142666 | 1.55 | 1670 10 | 0.10 0.01 | |||
| HD 144432 | 10.92 | 1420 10 | 0.20 0.01 | |||
| MWC 863A | 41.40 | 1360 10 | 0.28 0.01 | |||
| V1295 Aql | 25.20 | 1350 10 | 0.48 0.01 | |||
| AS 205A | 2.08 | 1850 10 | 0.14 0.01 | |||
| MWC 275 | 19.93 | 1750 10 | 0.20 0.01 | |||
| AS 442 | 8.63 | 1580 10 | 0.57 0.01 | |||
| MWC 1080 | 24.39 | 2190 10 | 1.39 0.01 | |||
| Dust+Gas Continuum Models | ||||||
| RY Tau | 0.30 | 2684 371 | 0.02 0.04 | 1.623 4.655 | 1105 110 | 0.31 0.02 |
| MWC 480 | 1.04 | 3199 391 | 0.07 0.01 | 0.081 0.029 | 1105 9 | 0.28 0.01 |
| MWC 758 | 1.73 | 3462 167 | 0.07 0.01 | 0.104 0.013 | 849 53 | 0.35 0.03 |
| DG Tau | 1.48 | 2188 423 | 0.01 0.01 | 2.000 0.001 | 1137 29 | 0.21 0.01 |
| RW Aur | 1.71 | 7125 981 | 0.02 0.01 | 0.009 0.001 | 1233 26 | 0.15 0.01 |
| HD 142666 | 0.13 | 5577 22197 | 0.01 0.12 | 0.175 0.989 | 1236 736 | 0.14 0.07 |
| HD 144432 | 0.54 | 3910 479 | 0.07 0.01 | 0.048 0.015 | 1031 19 | 0.29 0.01 |
| MWC 863A | 0.67 | 7714 88 | 0.07 0.01 | 0.009 0.001 | 1128 5 | 0.35 0.01 |
| V1295 Aql | 0.58 | 3115 464 | 0.14 0.01 | 0.063 0.029 | 1106 10 | 0.62 0.01 |
| AS 205A | 0.58 | 6952 3684 | 0.01 0.01 | 2.000 0.001 | 1461 68 | 0.18 0.01 |
| MWC 275 | 0.13 | 3983 544 | 0.06 0.01 | 0.129 0.045 | 1230 14 | 0.28 0.01 |
| AS 442 | 2.70 | 2521 924 | 0.29 0.04 | 0.199 0.282 | 681 1688 | 1.34 4.36 |
| MWC 1080 | 0.67 | 2790 218 | 0.50 0.01 | 0.687 0.173 | 1271 14 | 2.33 0.04 |
| Dust+Water Models | ||||||
| RY Tau | 2.21 | 5427 654 | 0.02 0.01 | 0.238 0.055 | 1211 4 | 0.26 0.09 |
| MWC 480 | 2.46 | 4659 799 | 0.02 0.01 | 0.173 0.084 | 1246 3 | 0.25 0.10 |
| MWC 758 | 2.41 | 4632 738 | 0.02 0.01 | 0.201 0.064 | 1241 4 | 0.24 0.08 |
| DG Tau | 1.56 | 16907 470 | 0.01 0.06 | 0.020 0.273 | 1204 18 | 0.19 0.09 |
| RW Aur | 1.68 | 6114 2414 | 0.03 0.01 | 0.009 0.000 | 1226 25 | 0.15 0.01 |
| HD 142666 | 0.25 | 7334 6398 | 0.01 0.01 | 0.757 1.496 | 1396 5 | 0.12 0.28 |
| HD 144432 | 1.13 | 6812 3310 | 0.01 0.01 | 0.574 0.711 | 1225 2 | 0.25 0.24 |
| MWC 863A | 2.55 | 5090 1149 | 0.01 0.01 | 0.187 0.103 | 1218 2 | 0.33 0.14 |
| V1295 Aql | 1.68 | 5368 1560 | 0.02 0.01 | 0.232 0.053 | 1222 1 | 0.55 0.32 |
| AS 205A | 0.48 | 4222 2727 | 0.01 0.01 | 0.611 0.602 | 1631 6 | 0.16 0.14 |
| MWC 275 | 0.57 | 5271 897 | 0.02 0.01 | 0.246 0.059 | 1409 4 | 0.25 0.19 |
| AS 442 | 2.92 | 13212 14239 | 0.01 0.01 | 2.093 7.427 | 1375 3 | 0.67 2.54 |
| MWC 1080 | 1.39 | 10730 2952 | 0.06 0.04 | 0.782 0.750 | 1600 9 | 1.90 3.33 |
| Dust+Gas Model | Dust+Water Model | |||
|---|---|---|---|---|
| Source | ||||
| (AU) | (AU) | |||
| RY Tau | 0.02 0.04 | 0.01 0.03 | 0.07 0.01 | 0.02 0.02 |
| MWC 480 | 0.07 0.01 | 0.08 0.02 | 0.01 0.01 | 0.09 0.03 |
| MWC 758 | 0.02 0.01 | 0.03 0.03 | 0.01 0.16 | 0.05 0.02 |
| DG Tau | 0.07 0.01 | 0.16 0.04 | 0.07 0.01 | 0.16 1.13 |
| RW Aur | 0.07 0.01 | 0.06 0.04 | 0.01 0.01 | 0.06 0.05 |
| HD 142666 | 0.05 0.01 | 0.01 0.05 | 0.05 0.01 | 0.02 0.05 |
| HD 144432 | 0.07 0.01 | 0.04 0.03 | 0.02 0.01 | 0.05 0.05 |
| MWC 863A | 0.02 0.01 | 0.04 0.01 | 0.02 0.01 | 0.05 0.02 |
| V1295 Aql | 0.01 0.12 | 0.08 0.02 | 0.06 0.02 | 0.09 0.02 |
| AS 205A | 0.01 0.01 | 0.01 0.01 | 0.01 0.01 | 0.02 0.04 |
| MWC 275 | 0.01 0.01 | 0.05 0.02 | 0.01 0.01 | 0.06 0.02 |
| AS 442 | 0.05 0.05 | 0.04 0.19 | 0.12 0.03 | 0.03 0.06 |
| MWC 1080 | 0.01 0.02 | 0.05 0.02 | 0.06 0.04 | 0.04 0.02 |
Note. — The uncertainties listed here are 1 statistical errors for our model fits. As discussed in §4.1, these error bars are probably too small for , although we can state confidently that AU for these sources.


![[Uncaptioned image]](/html/0809.5054/assets/x10.png)
![[Uncaptioned image]](/html/0809.5054/assets/x11.png)
