Lynds 1622: a nearby star forming cloud projected on Orion B?
Abstract
We present results of optical spectroscopic and photometric observation of the pre-main sequence stars associated with the cometary shaped dark cloud Lynds 1622, and 12CO and 13CO observations of the cloud. We determined the effective temperatures and luminosities of 14 pre-main sequence stars associated with the cloud from their positions in the Hertzsprung–Russell diagram, as well as constructed their spectral energy distributions using optical, 2MASS and Spitzer IRAC and MIPS data. We derived physical parameters of L 1622 from the molecular observations. Our results are not compatible with the assumption that L 1622 lies on the near side of the Orion–Eridanus loop, but suggest that L 1622 is as distant as Orion B. At a distance of 400 pc the mass of the cloud, derived from our 12CO data, is 1100 M☉, its star formation efficiency is , and the average age of its low-mass pre-main sequence star population is about 1 million years.
keywords:
ISM: clouds; ISM: individual objects: L 1622; stars: formation; stars: pre-main sequence1 Introduction
Studies of the large-scale properties of star forming regions are important for understanding the interstellar processes governing star formation. Census of young stellar objects (YSOs) born in a cloud, their mass, age and space distribution, together with the mass of the star forming cloud are key data for assessment of the efficiency and time scale of star formation.
The Orion OB1 association and its associated molecular clouds represent a distinguished target for star formation studies, being the nearest giant star forming region where various stages of the star forming processes across the whole stellar mass spectrum, as well as interactions between the consecutive generations of stars can be studied in detail. The target of the present paper, Lynds 1622 and the neighbouring Lynds 1621 are small dark clouds at the low Galactic latitude edge of the giant molecular cloud Orion B. These two clouds together are termed as Orion East by Herbig & Rao (1972), who discovered five H emission stars associated with L 1622. Maddalena et al. (1986) found that the radial velocity of this cloud is about km s-1, contrary to the characteristic radial velocity of +10 km s-1 of Orion B. The asymmetric, cometary shape and the bright, ionized rim apparent in the SHASSA (Gaustad et al., 2001) image of L 1622 suggest its interaction with the hot stars of Ori OB 1. Casassus et al. (2006) present centimeter continuum image of L 1622, and attribute the radiation to spinning dust grains in a limb-brightened shell of the cloud, where the incident UV radiation from the Ori OB1b association heats and charges the grains.
Low-mass star formation in L 1622 is indicated by several associated T Tauri stars and candidates. The reflection nebula VDB 62, illuminated by the K2 type weak-line T Tauri star HBC 515 (HD 288313, V1793 Ori) (Racine, 1968; Herbig & Bell, 1988) can be found near the bright rim of the cloud. Spectroscopic and photometric variability of this star were studied in detail by Mekkaden et al. (2007), and it was found to be a triple system by Reipurth et al. (2008a). In addition to this WTTS, there are six known classical T Tauri stars (CTTS) in L 1622: HBC 188 (LkH 334), HBC 189 (LkH 335), HBC 190 (LkH 336), HBC 516 (LkH 336c), HBC 191 (LkH 337), and HBC 517 (L 1622–15) (Herbig & Bell, 1988). The LkH 336 triple system was studied by Correia et al. (2006). Ogura & Hasegawa (1983) detected 16 H emission stars (L 1622–1 to L 1622–16) in an objective prism survey over the surface of L 1622, including the above HBC stars except LkH 336c and HD 288313. The pre-main sequence (PMS) nature of 11 objects has not yet been confirmed.
A further signpost of low-mass star formation is the Herbig–Haro object HH 122 (Reipurth & Madsen, 1989), whose probable exciting source, HH 122 VLA 1 was detected by Rodríguez & Reipurth (1994). Lee & Myers (1999) report four optically selected cores of the L 1621 / L 1622 region: L 1621–1, L 1621–2, L 1622 A and L 1622 B. L 1622 B is associated with the optically invisible source IRAS 05522+0146, while Lee, Myers, Tafalla (2001) list L 1622 A as an infall candidate. Recently Reipurth et al. (2008b) identified 28 young stellar objects (YSOs) in the Spitzer IRAC images of L 1622, 10 of which they classified as protostars.
The velocity difference between Orion B and L 1622 raises the question whether both clouds are located in the same volume of space, or L 1622 is a foreground object, unrelated to the Orion B molecular cloud.
Maddalena et al. (1986) concluded that, in spite of the different velocities, Orion East is probably located at the same distance as Orion B, regarding its cometary shape and bright rim, pointing toward Barnard’s Loop. This conclusion was questioned by Knude et al. (2002), who studied the distance to interstellar extinction features by using spectral types of the Michigan Catalog and Tycho–2 photometry, and found an absorbing cloud located at some 160 pc from the Sun toward the line of sight of L 1622, suggesting that this cloud may be a foreground object. Wilson et al. (2005), based on the parallaxes of three Hipparcos stars, find that L 1622 is situated as close as 120 pc to the Sun. Nearby star forming clouds are of special interest because they allow us to study fine structural details and detect the lowest luminosity objects.
Motivated by these findings we started a spectroscopic and photometric study of the pre-main sequence stars and candidates associated with L 1622. Our aim is to assess the probable star forming history of the cloud, and see if the measured properties of these objects support the smaller or the larger distance.
In order to have a homogeneous data set on the young low mass stars born in L 1622 we obtained moderate resolution optical spectra and photometry of all pre-main sequence stars and candidates projected on L 1622. Spitzer archive data were used for studying the spectral energy distributions (SEDs) of the young stars. In order to find the physical properties of the cloud, compare the positions of the stars and the molecular gas, as well as estimate the efficiency of star formation we analysed 12CO and 13CO observations of the cloud available in the data archive of the NANTEN radio telescope at Nagoya University. Our observations and results are described in Sect. 2, and discussed in Sect. 3. Section 4 gives a short summary of our findings.
2 Observations and results
2.1 Spectroscopy
2.1.1 FAST spectra of PMS candidates
Low-resolution optical spectra of the 16 H emission stars of the field of L 1622, listed by Ogura & Hasegawa (1983), were acquired with FAST, a high throughput slit spectrograph mounted at the Fred L. Whipple Observatory 1.5-m telescope on Mount Hopkins, Arizona (Fabricant et al., 1998). In addition to the H emission stars we observed HD 288313 too. We observed both components of the visual binary L 1622-10 (Reipurth & Zinnecker, 1993), separated by some 4.4 arcsec.
We used a 300 g mm-1 grating blazed at 4750 Å, a 3-arcsec slit, and a thinned Loral 512 2688 CCD. These spectra cover 3800–7500 Å at a resolution of 6 Å. We reduced and analysed the spectra in IRAF111IRAF is distributed by the National Optical Astronomy Observatories, which are operated by the Association of Universities for the Research in Astronomy, Inc., under cooperative agreement with the National Science Foundation. http://iraf.noao.edu/.
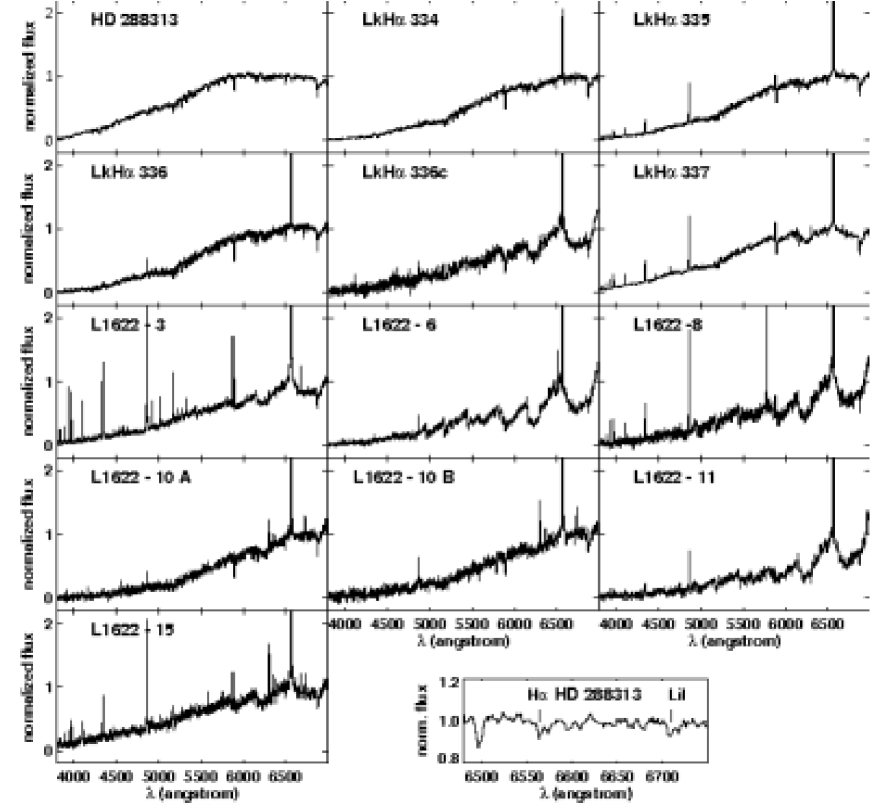
After trimming the CCD frames at each end of the slit, we corrected for the bias level and flat-field for each frame, applied an illumination correction, and derived a full-wavelength solution from calibration lamps acquired immediately after each exposure. The wavelength solution for each frame has a probable error of 0.5–1.0 Å. To construct final 1-D spectra, we extracted object and sky spectra using the optimal extraction algorithm within APEXTRACT. Most spectra have moderate signal-to-noise, per pixel. The spectral classification was performed by visually comparing the spectra of MK standards with the spectra of our targets following the procedures described in Jaschek & Jaschek (1987). We estimate an accuracy subclass for our spectral classification. For the LkH stars our derived spectral types agree with those found by Cohen & Kuhi (1979). The FAST spectra, normalized with the value of the continuum at 6560 Å, are shown in Fig. 1.
2.1.2 CAFOS spectra of PMS candidates
Part of the target stars have been observed with the CAFOS instrument on the 2.2-m telescope of Calar Alto Observatory in February 2007. Using the grism R-100, the observed part of the spectrum covered the wavelength interval 5800–9000 Å. The spectral resolution of CAFOS observation, using a 1.5-arcsec slit, was at Å. We reduced and analysed the spectra using standard IRAF routines. The wavelength range of spectra was suitable for determining several flux ratios defined as tools for spectral classification of late K and M type stars by Kirkpatrick et al. (1991) (A, B, C, B / A, B / C), Martín & Kun (1996) (I2, I3), and Preibisch, Guenther, Zinnecker (2001) (T1, T2). We measured these spectral features on the spectra of our stars, and calibrated them against the spectral type and luminosity class by measuring them in a series of standard stars published by Le Borgne et al. (2003). The accuracy of the spectral classification, estimated from the range of spectral types obtained from different flux ratios, is subclass (for further details of spectral classification see Kun et al. 2004). The spectral types, obtained from the CAFOS observations, are consistent with those obtained from the FAST spectra.
We accepted an object as a classical T Tauri star if it fulfilled the criterion established by Barrado y Navascués & Martín (2003), i.e. (H) exceeded the saturation limit of the chromospheric activity, depending on the spectral type. The H emission of such stars is thought to originate from the gas accreted by the star from the disc. The spectra of L 1622–1, L 1622–2, L 1622–7, L 1622–13, L 1622–14, and L 1622–16 have shown no pre-main sequence signature. We noticed, however, that the spectrum of a faint M-type star, 2MASS J 05540201+0140558, which appeared in the slit next to the CAFOS spectrum of L 1622–6, has shown W(H) 15Å. The critical (H) for its spectral type M3, according to Barrado y Navascués & Martín, is about 11 Å, suggesting that 2MASS J 05540201+0140558 may be a CTTS. The equivalent width of the H emission line of M-type stars, however, may be slightly overestimated at the moderate resolution of our observations because, due to the TiO band and 6569 Å, the position of the continuum is somewhat uncertain (White & Basri, 2003). Taking into account this effect we regarded this star as a candidate pre-main sequence object and designated it as L 1622–6N. HD 288313 is a weak-line T Tauri star, whose pre-main sequence nature is shown by the strong Li I absorption (cf. Mekkaden et al., 2007). Its spectrum shows a weak H emission, as the photospheric H absorption, expected for a K2 type star, is nearly filled in with emission (see the last panels of Figs. 1 and 2). According to the (H) values, 12 of 14 PMS stars covered by our spectroscopic survey are accreting objects.
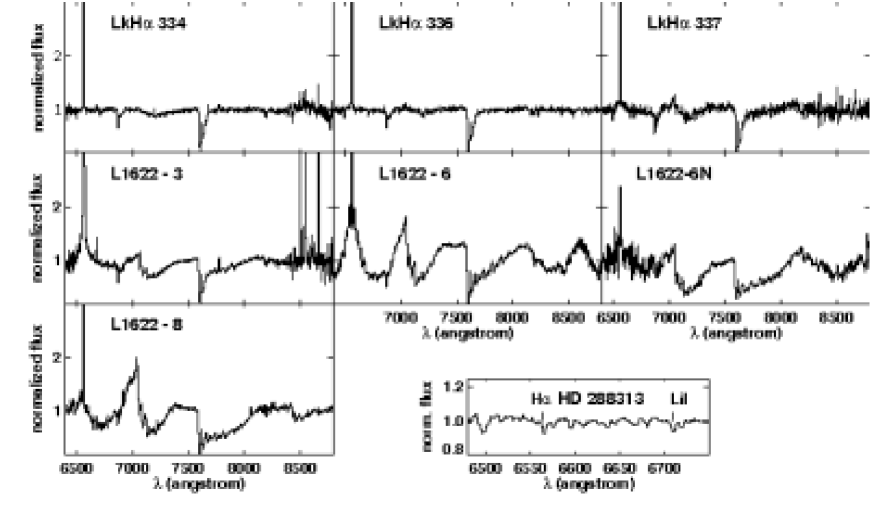
Table 1 shows the final list of the targets which have shown spectra characteristic of pre-main sequence stars. In addition to the derived spectral types we present the equivalent widths of the H and Li I lines in Å, as well as indicate the additional emission lines observed in the spectra. The uncertainties given in parentheses have been derived from the repeatability of the measurements. We used the deblend command of the splot task of IRAF to separate the Li I line from the neighbouring absorption or emission features (Ca I 6718, [S II] 6717). The CAFOS spectra are shown in Fig. 2. The strong H emission lines show that all these objects are classical T Tauri stars. L 1622–3 exhibits an especially rich emission spectrum, characteristic of strongly accreting or eruptive (EXor type) stars. The spectral types of the stars were converted into effective temperatures following Kenyon & Hartmann (1995).
| Star | Sp.T. | (H) | (Li I) | Other emission lines |
| (Å) | (Å) | |||
| HD 288313 | K2 | 0.80 (0.1) | 0.45 (0.02) | |
| L 1622–3 | M0 | 295.0 (8.0) | Balmer series, Ca ii H & K; Ca ii IR triplet, | |
| HeI 5873, 6678, Na i, numerous Fe ii lines | ||||
| LkH 334 | K4 | 8.5 (0.5) | 0.65 (0.03) | H, H; He i 5873, Ca ii IR triplet |
| LkH 335 | K4 | 52.5 (2.0) | Balmer series, He i 5873, 6678; Ca ii IR triplet | |
| L 1622–6 | M4 | 20.5 (1.0) | 0.51 (0.05) | H |
| L 1622–6N | M3 | 14: | ||
| L 1622-8 | M2.5 | 103.0 (1.0) | Balmer series; Ca ii H & K; He i 5873 | |
| LkH 336 | K7 | 26.0 (1.0) | 0.29 (0.05) | Balmer series, Ca ii H & K |
| LkH 336c | M1 | 54.8 (2.0) | 0.53 (0.05) | H, H |
| L 1622–10 A | K7 | 41.0 (3.0) | [O i] 6300, 6363; [N ii] 6583, [S ii] 6716, 6731 | |
| L 1622–10 B | K5 | 79.9 (3.0) | H | |
| L 1622–11 | M2 | 65.1 (1.0) | 0.81 (0.02) | Balmer series, Ca ii H & K |
| LkH 337 | K7 | 50.5 (1.0) | 0.45 (0.05) | Balmer series, Ca ii H & K; He i 5873, 6678; [O i] 6300 |
| L 1622-15 | M0 | 72.2 (2.0) | Balmer series, Ca ii H & K; Mg i 5172; [O i] 6300, 6363 | |
| He i 5873, 6678; [S ii] 6716, 6731; Fe ii |
2.1.3 Spectrum of VDB 63
In addition to the candidate PMS stars we observed the spectrum of HD 288309, the illuminating star of the reflection nebula VDB 63, located at the eastern edge of L 1622 (see Fig. 6), on the 4900–7800 Å region, using CAFOS with the grism G–100. The spectral type and photometric data of this star may constrain the distance of L 1622. We derived a spectral type K0 III. The absolute magnitudes of K0 giants, tabulated by Wainscoat et al. (1992), together with the photometric data of HD 288309 found in the NOMAD222http://www.nofs.navy.mil/nomad catalogue, result in a most probable distance pc for VDB 63. The large dispersion of the absolute magnitudes of K giants, (Wainscoat et al., 1992), lends a high uncertainty to this value. Taking into account the 1- range of absolute magnitudes, the corresponding distance interval is .
2.2 photometry
Photometric observations of the young stars in the , and bands were undertaken on 15 January and 14 February 2007 using the 1-m RCC-telescope of Konkoly Observatory. We used a Princeton Instruments VersArray:1300B camera, that utilizes a back-illuminated, 13001340 pixel Roper Scientific CCD. The pixel size is 20 m, corresponding to 0.31 arcsec on the sky. Integration times were between 5 s and 300 s. In order to calibrate the observed fluxes, we bracketed the observation of each target star by observations of four nearby Landolt (1983) standard stars. We reduced the images in IRAF. After bias subtraction and flatfield correction psf photometry was performed using the phot and allstar tasks of the DAOPHOT package.
The results of the photometry are presented in Table 2. The photometric errors, given in parentheses, are quadratic sums of the formal errors of the instrumental magnitudes and those of the coefficients of the transformation equations.
2.2.1 Interstellar extinction
The unreddened colour indices of the spectral types were adopted from Kenyon & Hartmann (1995). The interstellar extinction suffered by the program stars can be derived from their colour excesses. The colour excesses of pre-main sequence stars, however, reflect not only the interstellar reddening, but are also influenced by several other effects, such as the light, scattered from the disc and envelope surrounding the star, as well as thermal emission from the disc and accretion shocks on the stellar surface. It is usually assumed that most of the colour excess results from interstellar reddening (e.g Hartigan et al., 1994; Meyer et al., 1997), and thus it is a reliable estimate of the extinction using the relationship (Cohen et al., 1981).
During our data analysis, however, we realized that the colour excesses of LkH 336c, L1622–10A, and L1622–10B are probably influenced by scattered light: apparently underestimates the extinction of these stars: the luminosities, derived from the magnitudes, corrected for the extinction based on , are too low for classical T Tauri stars, located in the distance interval 120–400 pc from the Sun. The presence of scattered light is supported by our photometric images, which show the profiles of these stars slightly broader than the average stellar profile of the image. We therefore determined the extinction using the colour excess as well, using the 2MASS (Cutri et al., 2003) data, and compared the extinctions obtained from both methods. We found that in most cases both colour excesses result in virtually the same , suggesting that both the influence of scattered light in the band and the -band emission from the disc inner rim are negligible. Exceptions are the above stars. Probably scattered light makes these stars bluer in the , and, at the same time, their colour excess is slightly increased by the possible contribution of the disc emission to the magnitude (Cieza et al., 2005). Therefore we adopt as a best estimate of the average of and for each star. The values, as well as the 2MASS designations of the target stars, formed from their equatorial coordinates, are also given in Table 2. For determining the extinction in the other photometric bands, we used the relations and for the optical (Cohen et al., 1981), and , , , presented by Nielbock & Chini (2005) for the 2MASS-bands.
Bolometric luminosities were derived by applying the bolometric corrections , tabulated by Hartigan et al. (1994) to the dereddened magnitudes, based on the assumption that the total emission of the stars in the band originates from the photosphere (e.g. Meyer et al., 1997; Cieza et al., 2005). We determined for various distances found in the literature.
| Star | 2MASS J | ||||
|---|---|---|---|---|---|
| HD 288313 | 05540300+0140218 | 10.014 (0.02) | 9.263 (0.02) | 8.828 (0.02) | 0.93 |
| L 1622–3 | 05533298+0217200 | 16.365 (0.02) | 15.282 (0.02) | 14.171 (0.02) | 1.33 |
| LkH 334 | 05534090+0138140 | 13.122 (0.02) | 12.365 (0.02) | 11.617 (0.02) | 1.48 |
| LkH 335 | 05535869+0144094 | 14.201 (0.02) | 13.164 (0.02) | 12.276 (0.02) | 2.57 |
| L 1622–6 | 05540189+0140272 | 15.862 (0.02) | 14.464 (0.02) | 12.635 (0.02) | 2.45 |
| L 1622–6 N | 05540201+0140558 | 18.421 (0.06) | 16.866 (0.04) | 14.882 (0.03) | 3.24 |
| L 1622–8 | 05540718+0139007 | 17.424 (0.05) | 15.190 (0.04) | 13.584 (0.03) | 1.88 |
| LkH 336 | 05542008+0142565 | 14.229 (0.04) | 13.188 (0.04) | 12.278 (0.03) | 1.70 |
| LkH 336c | 05542031+0142518 | 18.160 (0.08) | 16.707 (0.08) | 15.416 (0.06) | 3.67 |
| L 1622–10 A | 05542669+0152154 | 17.899 (0.08) | 16.467 (0.08) | 14.857 (0.06) | 4.83 |
| L 1622–10 B | 05542696+0152172 | 18.162 (0.08) | 16.768 (0.06) | 15.457 (0.05) | 6.05 |
| L 1622–11 | 05543040+0150593 | 17.596 (0.05) | 16.174 (0.03) | 14.337 (0.03) | 1.80 |
| LkH 337 | 05543793+0129513 | 14.406 (0.02) | 13.589 (0.02) | 12.507 (0.02) | 0.72 |
| L 1622–15 | 05571611+0229074 | 15.650 (0.02) | 14.974 (0.02) | 13.950 (0.02) | 1.66 |
2.3 Infrared archive data
2.3.1 IRAC observations
We measured the IRAC fluxes of the program stars using images from Spitzer Space Observatory archive (Prog ID 43: An IRAC Survey of the L 1630 and L 1641 (Orion) Molecular Clouds – Fazio et al.). We created the IRAC mosaics from Basic Calibrated Data (BCD) frames in each channel using a custom IDL script which also converted the MJy sr-1 units to DN s-1 using conversion factors 0.1088, 0.1388, 0.5952, and 0.2021 for channels 1, 2, 3, and 4, respectively, and performed aperture photometry on all images with PhotVis version 1.10, which is an IDL-GUI based photometry visualization tool (Gutermuth et al., 2004). The radii of the source aperture and the inner and outer sky annuli were at 2.4 arcsec, 2.4 arcsec, and 7.2 arcsec, respectively. We calculated the standard IRAC magnitudes using (fluxDN/s)+zp, where the zero-point term, zp, is 21.9929, 21.2583, 19.0747, and 19.4372 for channels 1–4, respectively. The zero point includes the zero point of the flux to magnitude transformation based on the large aperture measurements of a standard star (19.66, 18.94, 16.88, and 17.39 mag for channels 1–4); and the aperture corrections to account for the difference between the aperture sizes used for the standard star and for L 1622 photometry (0.21, 0.23, 0.35, and 0.50 mag for channels 1–4). See Reach et al. (2005) for the detailed description of the calibration of the IRAC data. We converted the magnitude into flux units using the equation where f is the flux m is the corresponding magnitude and c is the zero point in Jy (280.9, 179.7, 115.0, 64.13 for channels 1, 2, 3, and 4 respectively). The resulting IRAC magnitudes are listed in Table 3. L 1622–3, L 1622–15, and LkH 334 are located outside the field of view of the IRAC observations.
| Star | [3.6] | [4.5] | [5.8] | [8.0] | [24] |
|---|---|---|---|---|---|
| LkH 334 | 3.95 (0.01) | ||||
| LkH 335 | 7.290 (0.001) | 6.783 (0.002) | 6.287 (0.001) | 5.289 (0.001) | 2.52 (0.01) |
| L 1622–6 | 9.316 (0.004) | 9.147 (0.003) | 8.967 (0.005) | 8.492 (0.006) | 3.88 (0.01) |
| L 1622–6 N | 10.753 (0.003) | 10.335 (0.003) | 9.971 (0.005) | 9.226 (0.005) | 6.78 (0.01) |
| L 1622–8 | 9.827 (0.002) | 9.470 (0.002) | 8.934 (0.003) | 8.069 (0.002) | 4.96 (0.01) |
| LkH 336 | 8.374 (0.003) | 7.969 (0.002) | 7.542 (0.002) | 6.541 (0.004) | 3.52 (0.02) |
| LkH 336c | 9.612 (0.005) | 9.196 (0.005) | 8.632 (0.003) | 7.644 (0.003) | 2.95 (0.02) |
| L 1622–10 A | 8.838 (0.002) | 8.358 (0.002) | 7.817 (0.004) | 7.068 (0.002) | 3.11 (0.02) |
| L 1622–10 B | 9.620 (0.010) | 9.160 ,(0.010) | 8.570 (0.020) | 7.700 (0.010) | 3.00 (0.02) |
| L 1622–11 | 10.618 (0.002) | 10.289 (0.003) | 9.926 (0.005) | 9.201 (0.004) | 6.36 (0.01) |
| LkH 337 | 9.679 (0.002) | 8.771 (0.003) | 8.577 (0.003) | 7.548 (0.002) | 4.33 (0.01) |
| IRAS 05522+0146 | 12.491 (0.005) | 11.190 (0.004) | 10.056 (0.005) | 9.095 (0.003) | 3.69 (0.01) |
2.3.2 MIPS data
We also present observations of L 1622 at 24 and 70 µm, obtained with the Multiband Imaging Photometer for Spitzer (MIPS) as part of program PID 43 (AOR 16214784, Nov 4 2005). The data were downloaded from the Spitzer Science Center Archive with Leopard. The cloud was imaged using a single scan map with 4 legs at full array cross-scan offset, resulting in half array gaps at 70 µm. The scanlegs were half degree in length. Observations were carried out using medium scan mode, resulting in a total effective exposure time of 40 s/pixel at 24, and 20 s/pixel at 70 µm.
All data were processed using the MIPS instrument team Data Analysis Tool (DAT, Gordon et al., 2005) as described by Engelbracht et al. (2007) and Gordon et al. (2005). Care was taken to minimize instrumental artifacts. We used the MIPS calibration star HD 173398 as a PSF standard for the 24 µm photometry, with the final PSF constructed from 72 individual AORs, kindly provided to us by C. Engelbracht.
Standard IRAF tasks phot and allstar of the DAOPHOT package were used to carry out the 24 µm PSF and 70 µm aperture photometry. Since the MIPS psf is very stable and the nebulosity effects were negligible at 24 µm, we used a large PSF radius of 112 arcsec, with fitting radius of 5.7 arcsec. The instrumental number flux counts were converted to fluxes with the conversion 1.068, as determined by the MIPS team (Engelbracht et al., 2007). We then translated these to [24] magnitudes taking 7.17 Jy for the [24] magnitude zero point.
The large PSF radius used ensured us that the aperture correction was smaller than 0.06 mag at [24] (the aperture correction for 35-arcsec aperture radius; Engelbracht et al. 2007). The correction factor for the PSF used has been determined by the MIPS team during previous work (Gáspár et al. 2008, in prep.) to be only 0.0368 magnitudes (3.4%). We summarize our 24 photometry results in Table 3. L 1622–3 and L 1622–15 are located outside the field of view of the MIPS observations. Three stars could be identified in the 70 µm images, namely LkH 335, LkH 336c, and L 1622–10A. We performed aperture photometry for these stars using a 18 arcsec aperture radius. The sky contamination was estimated in an annulus outside the aperture with inner and outer radius of 18 arcsec and 36 arcsec respectively. We converted the MIPS unit to Jy using a calibration factor of 16.52 mJy/square arcsec resulting in fluxes of 529341 mJy, 927404 mJy, and 504302 mJy for LkH 335, LkHalpha336c, and [UTF-8?]L 1622–10A.respectively. No useful stellar data could be extracted from the 160 µm image.
…
2.4 12CO and 13CO maps of L 1622
Observations were carried out in the 12CO( = 1–0) emission toward the Orion B region with the 4-m millimeter-wave telescope, NANTEN, at the Las Campanas Observatory, from November 2001 to March 2002. The half-power beam-width (HPBW) was 2.6 arcmin at 115 GHz. The front-end was a superconducting mixer followed by HEMT amplifiers. Details of this mixer receiver are given by Ogawa et al. (1990). The backend was an acousto-optical spectrometer with a velocity resolution of 0.1 km s-1. The telescope pointing was measured to be accurate within 20 arcsec by observing planets. The spectral intensities were calibrated by employing the standard room-temperature chopper-wheel technique (Kutner & Ulich, 1981). The absolute intensity calibration was made by observing Orion-KL [R.A.(B1950) = , Decl. (B1950) = ], by assuming its absolute temperature, 65 K. We also observed it every 2 hr to confirm the stability of the whole system. Most of the observations were made by the frequency switching technique with a frequency interval of 15 MHz, while the position switching technique was also used when the atmospheric frequency is close to the celestial 12CO frequency.
These observations were made as a part of the large scale 12CO survey of the Orion-Eridanus region which consists of 100,000 observing points. In the Orion region, , data were obtained at a grid spacing 4 arcmin. The r.m.s. noise fluctuations were 0.53 K per channel for a typical integration time of 8 s.
The 13CO ( = 1–0) observations were made at 4-arcmin grid spacing toward the same region as a part of large scale 13CO survey of the Orion region in January and February 2002. The half-power beam-width (HPBW) was 2.7 arcmin at 110 GHz, and the r.m.s. noise fluctuations were 0.16 K per channel. The frequency-switching technique with a frequency interval of 15 MHz was also used. We observed Orion-KL every 2 hr to check the stability and establish the absolute intensity scale. We assumed its absolute temperature 10 K.
The left panel of Fig. 3 shows the 12CO spectrum observed at (l,b)=(). The self-absorbed feature at 8–13 km s-1 corresponds to Orion B, whereas the peak at 1 km s-1 represents L 1622. In the right panel the average of all 12CO spectra within the 3- boundary of the 12CO cloud, corresponding to L 1622, is plotted. The peak velocity of this spectrum is km s-1, and the line width at half maximum is km s-1.


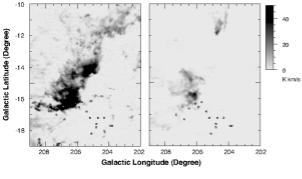
The large-scale distribution of the molecular gas is displayed in Fig. 4. The left panel shows the distribution of the 12CO emission integrated over the velocity interval of (5,15) km s-1, and the right panel shows the same distribution over the velocity interval (5,+5.0) km s-1. Using the conversion formula (H2) / (CO) = 1.8 cm-2 / K km s-1 (Wilson et al., 2005), our 12CO data allow us to estimate the mass of the cloud. Summing up the obtained column densities within the 3- contour (1.5 K km s-1) of the cloud, and adopting a mean molecular weight of 2.333, the result is , if we assume a distance of 400 pc. At a distance of 120 pc the measurements result in a mass of 100 M☉. The virial mass of the cloud, at 400 pc, where is the average radius derived from the 3- area of the cloud.
The mass of the 13CO emitting gas is , and . Thus the ratio M(13CO) / M(12CO) , a typical value for nearby dark clouds (de Geus, Bronfman, Thaddeus, 1990; Mizuno et al., 1995, 1998). for both the 12CO and the 13CO clouds.
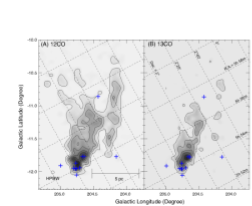
The column density of the molecular hydrogen toward the 13CO peak at is N(H2) = cm-2. The typical column densities of the isolated small 13CO clouds around the main cloud are about N(H2) = cm-2. Figure 5 shows the 12CO and 13CO maps of L 1622, with the positions of the associated PMS stars overplotted.
3 Discussion
3.1 Description of the region
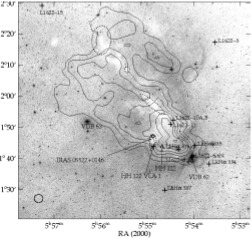
L 1622 harbours two IRAS point sources whose flux ratios are different from those of ordinary stars. IRAS 05517+0151 coincides with a visible star. Both the flux ratio and the near-infrared properties of its associated 2MASS source, 2MASS J 05542277+0152039, are indicative of an evolved star. The optically invisible IRAS 05522+0146 is probably an embedded young stellar object. Within the uncertainty ellipse it coincides in position with 2MASS J 05545377+0147098. This source was not detected at 12 m by IRAS, but the high upper limit of the 12 m flux, 0.34 Jy, is compatible with the assumption that the IRAS and 2MASS fluxes originate from the same protostellar source. No infrared source can be found at the position of HH 122 VLA 1 (Rodríguez & Reipurth, 1994).
Figure 6 shows the surface distribution of the 12CO emission and star formation signposts, overplotted on the DSS 2 red image of L 1622. The value of the lowest 12CO contour plotted is 1.5 K km s-1, and the increment is 5 K km s-1. Crosses indicate the pre-main sequence stars, and dotted ellipses show the optically selected cores (Lee & Myers, 1999). Positions of HH 122, HH 122 VLA 1, and IRAS 05522+0146, as well as the reflection nebulae VDB 62 and VDB 63 are also indicated.
The 12CO distribution shows a cometary shaped cloud with a bright rimmed head region on the southwestern side. This shape suggests that star formation might have been triggered by a shock arriving from the southwest, where the luminous stars of Ori OB1 can be found. Four pre-main sequence stars, namely L 1622–3, LkH 334, LkH 337, and L 1622–15 are projected outside the observed molecular cloud, thus their relation to L 1622 is uncertain. In particular, L 1622–3 and L 1622–15, located well outside the lowest contour of the tail of the cloud, may be unrelated to L 1622. LkH 334 and LkH 337 are projected near the head of the cloud, on the southwestern side, and thus might have been born in L 1622 at an earlier epoch when the cloud was larger. On the other hand, these isolated stars might have been formed in small clouds around the main large cloud, as discussed in Mizuno et al. (1998) for the Chamaeleon region. Ten PMS stars are projected within the head of the cloud. Four of them, HD 288313, L 1622–6, L 1622–8 and L 1622–6N form a compact group near the bright rim. Three stars, L 1622–10 A, L 1622–10 B, and L 1622–11, are projected on a dark spot within the cloud, associated with the 13CO peak. Both candidate embedded protostars, HH 122 VLA 1 and IRAS 05522+0146, are associated with the core L 1622 B.
3.2 Positions of the pre-main sequence stars in the HRD


The Hertzsprung–Russell diagrams (HRD) of the pre-main sequence stars of L 1622, for four different distances, are displayed in Fig. 7. Error bars of are derived from the accuracy of the spectral classification. The error of the luminosity comes from the quadratic sum of , , and . Evolutionary tracks and isochrones, as well as the position of the birthline and zero-age main-sequence (Palla & Stahler, 1999) are also shown.
Most of the programme stars are distributed over a fairly narrow age range. Exceptions are HD 288313 and L1622–6, which are apparently far more luminous than the other stars. Since HD 288313 is a multiple system (Reipurth et al., 2008a), the observed luminosity has to be distributed on its components. L1622–6 is either a foreground object, or, more probably, a multiple system as well. The distribution of the stars with respect the isochones shows that the extreme emission line star L 1622–3 is apparently the oldest member of the sample, in contrast with the observations that PMS activities decrease with stellar age. It is unlikely that the relatively low luminosity of this star is due to its larger age. L 1622–3 may either be a higher-mass counterpart of the underluminous, highly accreting very low mass stars LS–RCrA 1, Par-Lup3–4 (Comerón et al., 2003) and KPNO Tau 12 (Luhman et al., 2003), or may be somewhat more distant than L 1622. Its position on the sky with respect to the cloud suggests that L 1622–3 might have been born in another small cloud, projected near L 1622. Radial velocity measurements may clarify its connection with L 1622.
At a distance of 120 pc (panel (a), Wilson et al., 2005), most stars are close to the ZAMS, while L1622–3 and L1622–15 are on the ZAMS. The average age of the stars, suggested by this distance, is not compatible with their CTTS nature and triggering of star formation in L 1622 from the older subgroups of Ori OB1. The same is true for 160 pc, shown in panel (b): the mean age of the stars would be about 20 million years at this distance. At 320 pc (panel (c)), suggested by the photometric properties of VDB 63, the mean age of the pre-main sequence stars is about 3 million years, whereas, if L 1622 is situated at 400 pc from us, the age of its YSO population is around 1 million years (panel (d) of Fig. 7). We propose to accept 400 pc for the distance of L 1622, and thus the age of million year for the average age of its PMS star population. This age is compatible with that suggested by the spectroscopic properties of the stars, i.e. the high proportion of accretors (85%) among the H emission stars (cf. Jayawardhana et al., 2006), as well the high proportion of the protostars among the YSO population (10/28, Reipurth et al., 2008b).
3.3 Spectral energy distributions of the target stars

The shape of the SED, reflecting the structure of the circumstellar matter of the YSOs, is a useful indicator of evolutionary state (e.g Lada & Wilking, 1984; Adams, Lada, & Shu, 1987). The optical, near- and mid-infrared parts of the spectral energy distributions of the programme stars were constructed using the magnitudes and IRAC and MIPS fluxes, each corrected for the interstellar extinction. The fluxes corresponding to zero magnitude were obtained from Glass (1999) for the bands, and from the 2MASS All Sky Data release web document333 for the bands. IRAS fluxes are also plotted when available (Weaver & Jones, 1992). The resulting SEDs are shown in Fig. 8. Photospheric SEDs have been drawn by dashed lines. Their values were determined from the dereddened magnitudes, and from the colour indices corresponding to the spectral types. The right bottom panel of Fig. 8 shows the fluxes of IRAS 05522+0146, with the assumption that it is identical with 2MASS J 05545377+0147098. In this case the fluxes are not corrected for the interstellar extinction. The tip of the downward arrow indicates the upper limit of its 12-micron flux.
The SEDs exhibit near-infrared (, ) colour excess of LkH 335, LkH 336, and L 1622–10 A, indicative of disc inner edges at the dust sublimation radius, characteristic of actively accreting stars, probably not older than 1 million years. The signature of the disc appears at longer wavelengths in the SEDs of L 1622–6, L 1622–6N, L 1622–8, and L 1622–11, suggesting more evolved discs around these stars (e.g Furlan et al., 2006). We note that these latter stars, except L 1622–11 are members of the small compact group near the bright rim, whereas most of the stars with NIR excess are projected deeper inside the molecular cloud, suggesting star formation propagating into the cloud from the direction of the bright rim. We also note that the signature of the disc in the SED of L 1622–6N confirms the PMS nature of this star.
| Star | Age | |||||||||||||
| (K) | (M☉) | (Myr) | (M☉ yr-1) | (AU) | (M☉) | (M☉ yr-1) | () | (AU) | (AU) | () | ||||
| SED | Sp. | SED | HRD | SED | HRD | |||||||||
| LkH 335 | 4260 | 4590 | 1.46 | 1.60 | 0.13 | 1.0 | 1.4E4 | 1.6E+4 | 8.6E4 | 2.0E8 | 1.0 | 0.30 | 58 | 49 |
| L 1622–6 | 3440 | 3370 | 0.33 | 0.25 | 0.25 | 0.0 | 6.5E7 | 3.2E+3 | 3.3E4 | 6.1E11 | 48.0 | 3.14 | 1210 | 18 |
| L 1622–6 N | 3374 | 3470 | 0.30 | 0.30 | 1.7 | 6.9E5 | 9.0E11 | 4.4 | 0.15 | 124 | 70 | |||
| L 1622–8 | 3405 | 3525 | 0.31 | 0.35 | 1.5 | 8.8E3 | 8.6E8 | 1.0 | 0.04 | 103 | 32 | |||
| LkH 336 | 4120 | 4060 | 0.80 | 0.80 | 1.0 | 7.2E9 | 1.9E+3 | 3.2E2 | 6.8E7 | 1.4 | 0.80 | 100 | 76 | |
| LkH 336c | 3980 | 3720 | 0.70 | 0.50 | 0.2 | 2.5 | 9.4E7 | 4.0E+3 | 4.1E3 | 2.4E7 | 1.0 | 0.16 | 56 | 81 |
| L 1622–10 A | 4010 | 4060 | 0.70 | 0.80 | 0.4 | 1.5 | 4.0E7 | 1.2E+3 | 2.8E4 | 5.7E10 | 1.0 | 0.14 | 145 | 81 |
| L 1622–10 B | 4200 | 4350 | 1.01 | 0.90 | 0.3 | 3.0 | 9.3E7 | 1.6E+3 | 6.0E5 | 2.0E11 | 1.0 | 0.17 | 984 | 87 |
| L 1622–11 | 3540 | 3580 | 0.37 | 0.35 | 1.9 | 8.2E5 | 1.6E11 | 2.9 | 0.11 | 100 | 32 | |||
| LkH 337 | 4030 | 4060 | 0.75 | 0.80 | 4.0 | 1.5 | 9.1E3 | 3.4E8 | 4.9 | 0.30 | 198 | 69 | ||
In order to get a deeper insight into the circumstellar structures of the program stars, we fitted the observed SEDs with YSO model SEDs using the large grid of radiation transfer models described by Robitaille et al. (2007)444Available online at http://www.astro.wisc.edu/protostars.. Since several combinations of central star–disc–infalling envelope can result in good fit with the observed SED, we selected those model SEDs from the best fits that reproduced the stellar parameter values (, , ) determined from our optical observations. Table 4 shows the main stellar and circumstellar parameters resulted from the model fitting. The stellar parameters obtained from the optical observations are also shown for comparison. We have not fitted the SEDs of stars without Spitzer data.
It can be seen that the best models for L 1622–6N, L 1622–8, L 1622–11, and LkH 337 contain only a star and an accretion disc, whereas the SEDs of LkH 335, L 1622–6, L 1622–10A, LkH 336, and LkH 336c could not be fitted without including an envelope. The shape of the SED of L 1622–6 ranks this object into the class of transitional discs, having a wide inner hole. Envelopes usually disappear before development of the inner disc hole, therefore we do not expect an envelope around objects whose SED shapes are similar to that of L 1622–6. The large inner disc hole may be a consequence of the binarity of this star, also suggested by its high luminosity in the HRD. The inner regions of the accretion disc of this object might have been evacuated by a close companion.
In the case of LkH 336c and L 1622–10A the fits suggest discs seen nearly edge on. Contribution of scattered light is significant in the short-wavelength part of the SEDs of these stars, as we have seen in Sect. 2.2. The SED of IRAS 05522+0146 shows this object to be a Class I source, with signs of strong water ice and silicate absorptions around 3 and 10 µm, respectively.
3.4 A possible scenario of star formation in L 1622
The Hertzsprung–Russell diagrams presented in Fig. 7 suggest that L 1622 is not associated with the near side of the Orion–Eridanus Bubble. The extinction layers identified at 120 and 160 pc, that represent the interaction region of the Local Bubble and Ori–Eri Bubble, are foreground to this cloud. The derived parameters of young stars are compatible with both the distance of Ori OB1a (330 pc) and Ori OB1b (440 pc). The cloud is projected on Orion B, but is diverging from this giant cloud toward us with a radial velocity of 9 km s-1. Thus the true distance of the cloud from the Sun is probably slightly smaller than 400 pc. This geometry suggests that the source of the high pressure which initiated star formation in L 1622 may be somewhat more distant than the cloud itself.
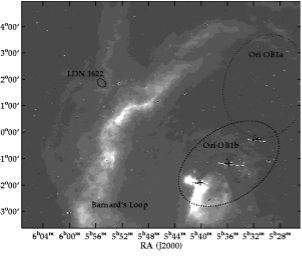
The bright, ionized head of the cloud points toward Orion’s Belt (Fig. 9), suggesting that stellar winds and ionization front from the supergiant members of the association subgroup Ori OB1b, whose age is about 6–7 million years (Blaauw, 1991; Bally, 2008), might have provided the shock which initiated star formation in L 1622. The separation of between L 1622 and the easternmost Belt star Ori corresponds to some 34 pc at a distance of 400 pc. Assuming an age difference of 6 million years the average expansion velocity of the H ii zone or stellar wind bubble should have been about 6.8 km s-1, a reasonable value for such effects (e.g Elmegreen & Lada, 1977; Elmegreen, 1998). Similar interaction between L 1622 and Ori OB1a, assuming a distance of 320 pc, is less likely, considering the orientation of the bright rim of L 1622 and the projected position of Ori OB1a.
4 Conclusions
We determined effective temperatures and luminosities of 14 pre-main sequence stars and candidates in the region of the dark cloud L 1622 and found that these quantities are incompatible with the assumption that L 1622 lies at the near side of the Orion–Eridanus Bubble, but suggest that this cloud is located at the distance of Orion B. The derived ages of the stars at this distance are around 1 million years. The shapes of the SEDs of the target stars support this age estimate. Star formation in L 1622 was probably triggered by the luminous stars of the association subgroup Ori OB1b (Orion’s Belt).
We present new 12CO and 13CO maps of L 1622. Accepting a distance of 400 pc we derived a mass of 1100 M☉ for L 1622 from the 12CO observations. The total mass of the YSOs identified so far, assuming a mean mass of 0.5 M☉ for the Spitzer sources not included in our spectroscopic survey, is 20 M☉, suggesting a star formation efficiency .
Several of our programme stars may be interesting targets for more detailed studies. The derived luminosity of the CTTS L 1622–6 suggests that this object is a binary or multiple system. The large inner hole in the accretion disc of this star, suggested by the models fitted to its SED, supports this hypothesis. The SEDs of L 1622–10A, L 1622–10B, and LkH 336c suggest that the discs of these stars are seen nearly edge-on. L 1622–3 exhibits an extremely rich emission spectrum. This star might have been born in a small molecular clump outside the main cloud. IRAS 05522+0146 is a Class I source embedded in the dense core L 1622 B.
Acknowledgements
Our results are partly based on observations obtained at the Centro Astronómico Hispano Alemán (CAHA) at Calar Alto, operated jointly by the Max-Planck-Institut für Astronomie and the Instituto de Astrofísica de Andalucía (CSIC). Our observations were partly supported by the OPTICON project. OPTICON has received research funding from the European Community’s Sixth Framework Programme under contract number RII3-CT-001566. We thank Calar Alto Observatory for allocation of director’s discretionary time to this programme. This publication makes use of data products from the Two Micron All Sky Survey, which is a joint project of the University of Massachusetts and the Infrared Processing and Analysis Center/California Institute of Technology, funded by the National Aeronautics and Space Administration and the National Science Foundation. This work makes use of observations made with the Spitzer Space Telescope, which is operated by the Jet Propulsion Laboratory, California Institute of Technology under a contract with NASA. We thank John Bally for helpful discussions, and Bo Reipurth for communicating to us unpublished information. We also thank the referee, Matilde Fernandez, for her very constructive report which helped to improve this paper. Financial support from the Hungarian OTKA grant T49082 is acknowledged.
References
- Adams, Lada, & Shu (1987) Adams, F. C., Lada, C. J., Shu, F. H. 1987, ApJ, 312, 788
- Bally (2008) Bally J. 2008, in Handbook of Star-Forming Regions, ed. B. Reipurth (San Francisco: ASP), in press
- Blaauw (1991) Blaauw, A. 1991, in The Physics of Star Formation and Early Stellar Evolution, eds. C. J. Lada & N. D. Kylafis, Kluwer, p. 125
- Barrado y Navascués & Martín (2003) Barrado y Navascués, D., Martín, E. L. 2003, AJ, 126, 2997
- Le Borgne et al. (2003) Le Borgne, J.-F., Bruzual, G., Pello, R., Lancon, A., Rocca-Volmerange, B., Sanahuja, B., Schaerer, D., Soubiran, C., Vilchez-Gomez, R. 2003, A&A, 402, 433
- Brown et al. (1994) Brown, A. G. A., de Geus, E. J., de Zeeuw, P. T. 1994, A&A, 289, 101
- Casassus et al. (2006) Casassus, S., Cabrera, G. F., Förster, F., Pearson, T. J., Readhead, A. C. S., Dickinson, C. 2006, ApJ, 639, 951
- Cieza et al. (2005) Cieza, L. A., Kessler-Silacci, J. E., Jaffe, D., Harvey, P. M., Evans, N. J. II. 2005, ApJ, 635, 422
- Cohen et al. (1981) Cohen, J. G., Frogel, J. A., Persson, S. E., Elias, J. H. 1981, ApJ, 249, 481
- Cohen & Kuhi (1979) Cohen, M., Kuhi, L.V. 1979, ApJS, 41, 743
- Comerón et al. (2003) Comerón, F., Fernández, M., Baraffe, I., Neuhäuser, R., Kaas, A. 2003, A&A, 406, 1001
- Correia et al. (2006) Correia, S., Zinnecker, H., Ratzka, Th., Sterzik, M. F. 2006, A&A, 459, 909
- Cutri et al. (2003) Cutri, R. M., Skrutskie, M. F., van Dyk, S., et al. 2003, VizieR On-line Data Catalog: II/246
- Elmegreen (1998) Elmegreen, B. G. 1998, in: Origins, ASP Conf. Ser., 148, ed. C. E. Woodward, J. M. Shull, H. A. Thronson, Jr., p.150
- Elmegreen & Lada (1977) Elmegreen, B. G., Lada, C. J., 1977, ApJ, 214, 725
- Engelbracht et al. (2007) Engelbracht, C. W., Blaylock, M., Su, K. Y. L., Rho, J., Rieke, G. H., Muzerolle, J., Padgett, D. L., Hines, D. C., et al. 2007, PASP, 119, 994
- Fabricant et al. (1998) Fabricant, D., Cheimets P., Caldwell N., Geary J. 1998, PASP, 110, 79
- Furlan et al. (2006) Furlan, E., Hartmann, L., Calvet, N., D’Alessio, P., Franco-Hernández, R., Forrest, W. J., Watson, D. M., Uchida, K. I. et al. 2006, ApJS, 165, 568
- Gaustad et al. (2001) Gaustad, J. E., McCullough, P. R., Rosing, W., Van Buren, D. 2001, PASP, 113, 1326
- de Geus, Bronfman, Thaddeus (1990) de Geus, E. J., Bronfman, L., Thaddeus, P. 1990, A&A, 231, 137
- Glass (1999) Glass, I. S. 1999, Handbook of Infrared Astronomy, Cambridge Univ. Press, p. 63
- Gordon et al. (2005) Gordon, K. D., Rieke, G. H., Engelbracht, C. W., Muzerolle, J., Stansberry, J. A., Misselt, K. A., Morrison, J. E., Cadien, J., et al. 2005, PASP, 117, 503
- Gutermuth et al. (2004) Gutermuth, R. A., Megeath, S. T., Muzerolle, J., Allen, L. E., Pipher, J. L., Myers, P. C., Fazio, G. G. 2004, ApJS, 154, 374
- Hartigan et al. (1994) Hartigan, P., Strom K. M., Strom S. E. 1994, ApJ, 427, 961
- Herbig & Bell (1988) Herbig, G. H., Bell, K. R. 1988, Lick Obs. Bull. 1111
- Herbig & Rao (1972) Herbig, G. H., Rao, K. N. 1972, ApJ, 174, 401
- Jayawardhana et al. (2006) Jayawardhana, R., Coffey, J., Scholz, A., Brandeker, A., van Kerkwijk, M. H. 2006, ApJ, 648, 1206
- Jaschek & Jaschek (1987) Jaschek C., Jaschek M. 1987, The Classification of Stars, Cambridge Univ. Press
- Kenyon & Hartmann (1995) Kenyon, S. J., Hartmann, L. 1995, ApJS, 101, 117
- Kirkpatrick et al. (1991) Kirkpatrick, J. D., Henry, T. J., McCarthy, D. W. 1991, ApJS, 77, 417
- Knude et al. (2002) Knude, J., Fabricius, C., Hog, E. & Makarov, V. 2002, A&A, 392, 1069
- Kun et al. (2004) Kun, M., Prusti, T., Nikolić, S., Johansson, L. E. B., Walton, N. A. 2004, A&A, 418, 89
- Kutner & Ulich (1981) Kutner, M. L., Ulich, B. L. 1981, ApJ, 250, 341
- Lada & Wilking (1984) Lada, C. J., Wilking, B. A. 1984, ApJ, 287, 610
- Landolt (1983) Landolt, A. U. 1983, AJ, 88, 439
- Lee & Myers (1999) Lee, C. W., Myers, P. C. 1999, ApJS, 123, 233
- Lee, Myers, Tafalla (2001) Lee, C. W., Myers, P. C., Tafalla, M. 2001, ApJS, 136, 703
- Luhman et al. (2003) Luhman, K. L., Briceño, C., Stauffer, J. R., Hartmann, L., Barrado y Navascués, D., Caldwell, N. 2003, ApJ, 590, 348
- Maddalena et al. (1986) Maddalena, R. J., Morris, M., Moscowitz, J., Thaddeus, P. 1986, ApJ, 303, 375
- Martín & Kun (1996) Martín, E. L., Kun, M. 1996, A&AS, 116, 467
- Mekkaden et al. (2007) Mekkaden, M. V., Muneer, S., Raveendran, A. V. 2007, MNRAS, 378, 1079
- Meyer et al. (1997) Meyer, M. R., Calvet, N., Hillenbrand, L. A. 1997, AJ, 114, 288
- Mizuno et al. (1995) Mizuno, A., Onishi, T., Yonekura, Y., Nagahama, T., Ogawa, H., Fukui, Y. 1995, ApJL, 445, L161
- Mizuno et al. (1998) Mizuno, A., Hayakawa, T., Yamaguchi, N., Kato, S., Hara, A., Mizuno, N.,; Yonekura, Y., Onishi, T., et al. 1998, ApJL, 507, L83
- Nielbock & Chini (2005) Nielbock, M., Chini, R. 2005, A&A, 434, 585
- Ogawa et al. (1990) Ogawa, H., Mizuno, A., Hoko, H., Ishikawa, H., Fukui, Y. 1990, Int. J. Infrared Millimeter Waves, 11, 717
- Ogura & Hasegawa (1983) Ogura, K., Hasegawa, T. 1983, PASJ, 35, 299
- Palla & Stahler (1999) Palla, F., Stahler, S. W. 1999, ApJ, 525, 772
- Preibish et al (2001) Preibisch T., Guenther E., Zinnecker H. 2001, AJ, 121, 1040
- Racine (1968) Racine, R. 1968, AJ, 73, 233
- Reach et al. (2005) Reach, W. T., Megeath, S. T., Cohen, M., Hora, J., Carey, S., Surace, J., Willner, S. P., Barmby, P., et al. 2005, PASP, 117, 978
- Reipurth & Madsen (1989) Reipurth, B., Madsen, C. 1989, Messenger, 55, 32
- Reipurth & Zinnecker (1993) Reipurth, B., Zinnecker, H. 1993, A&A, 278, 81
- Reipurth et al. (2008a) Reipurth, B., Herbig, G.H., Aspin, C. 2008, in prep.
- Reipurth et al. (2008b) Reipurth, B., Megeath, S. T., Bally, J., Walawender, J. 2008, in Handbook of Star-Forming Regions, ed. B. Reipurth (San Francisco: ASP), in press
- Robitaille et al. (2007) Robitaille, T. P., Whitney, B. A., Indebetouw, R., Wood, K. 2007, ApJS, 169, 328
- Rodríguez & Reipurth (1994) Rodríguez, L.,F., Reipurth, B. 1994, A&A, 281, 882
- Wainscoat et al. (1992) Wainscoat, R. J., Cohen, M., Volk, K., Walker, H. J., Schwartz, D. E. 1992, ApJS, 83, 111
- Weaver & Jones (1992) Weaver, W. B., Jones, G. 1992, ApJS, 78, 239
- White & Basri (2003) White, R. J., Basri, G. 2003, ApJ, 582, 1109
- Wilson et al. (2005) Wilson, B. A., Dame, T. M., Masheder, M. R. W., Thaddeus, P. 2005, A&A, 430, 523