Quantum optical coherence tomography of a biological sample
Abstract
Quantum optical coherence tomography (QOCT) makes use of an entangled-photon light source to carry out dispersion-immune axial optical sectioning. We present the first experimental QOCT images of a biological sample: an onion-skin tissue coated with gold nanoparticles. 3D images are presented in the form of 2D sections of different orientations.
PACS numbers: 42.30.Wb, 42.50.Nn, 42.65.Lm
I Introduction
A number of nonclassical (quantum) sources of light have come to the fore in recent years TeichSaleh89 –MandelWolf , but few practical applications have emerged. One such application is quantum optical coherence tomography (QOCT) Abouraddy ; NasrOptExp , a fourth-order interferometric optical-sectioning scheme that makes use of frequency-entangled photon pairs generated via spontaneous optical parametric down-conversion (SPDC) MandelWolf ; SPDC1 ; SPDC2 . A particular merit of QOCT is that it is inherently immune to group-velocity dispersion (GVD) by virtue of the frequency entanglement of the photon pairs Kwiat2 –NasrQOCTExpPRL . Conventional optical coherence tomography (OCT), in contrast, is a second-order interferometric scheme that provides high-resolution axial sectioning by employing ultra-broadband light youngquist87 –Brezinski . Unfortunately, however, this leads to GVD, which degrades resolution SalehTeich2007 . Here we present the first experimental QOCT images of a biological sample: an onion-skin tissue coated with gold nanoparticles. Three-dimensional images are displayed in the form of 2D transverse sections at different depths and 2D axial sections at different transverse positions. The results reveal that QOCT can become a viable biological imaging technique.
II Experimental arrangement
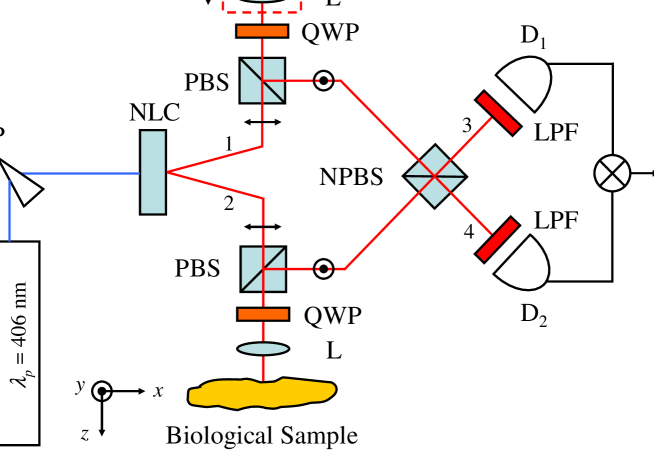
The details of the QOCT experimental arrangement are provided in Fig. 1 (for a detailed review of the theory of QOCT, the reader is referred to Ref. Abouraddy ). A monochromatic Kr+-ion laser operated at a wavelength = 406 nm pumps an 8-mm-thick type-I LiIO3 nonlinear crystal (NLC) after passage through a prism (P) and an aperture (not shown), which remove the spontaneous glow of the laser tube. A fraction of the pump photons disintegrate into pairs of down-converted entangled photons (biphotons) MandelWolf ; SPDC1 ; SPDC2 . The entangled photons, centered about nm, have horizontal polarization with respect to the optical table and are emitted in a non-collinear configuration into beams 1 and 2.
The photon in beam 1 is directed to the delay arm, where it is transmitted through a polarizing beam splitter (PBS) followed by a broadband quarter-wave plate (QWP), which converts it into a circularly-polarized photon. It is then focused by an -mm achromatic lens (L), onto a mirror (M). The lens is introduced to match that in the sample arm (discussed in the next paragraph) to maintain the indistinguishability of the paths, thereby insuring interference. The lens-mirror combination is scanned in the z direction during the experiment. The reflected photon becomes vertically polarized after traversing the QWP for a second time and it then reflects from the PBS, as illustrated in Fig. 1.
The photon in beam 2 is directed to the sample arm, which contains an identical set of optical components as the delay arm, with the exception that the mirror is replaced by a biological sample that can be scanned in the transverse plane (x and y directions). The use of a PBS-QWP pair in the sample arm provides a factor of four improvement in the number of photons collected relative to the use of a single non-polarizing beam splitter (NPBS), as used in earlier demonstrations of QOCT NasrOptExp ; NasrQOCTExpPRL . This factor of four improvement accrues for samples that do not affect the polarization of the photon. The use of the lens in the sample arm, in conjunction with a matching lens in the delay arm, provides a transverse-sectioning capability that was not previously implemented NasrOptExp ; NasrQOCTExpPRL .
The photons returned from the delay arm and the sample arm are each directed to one of the input ports of a NPBS. Beams 3 and 4, at the output of the NPBS are directed to single-photon-counting detectors (EGG, SPCM-AQR-15) D1 and D2, respectively, after passing through long-pass filters (LPFs) with a cutoff wavelength of = 625 nm. A coincidence circuit (denoted ) measures the coincidence rate between D1 and D2 within a 3.5-nsec time window.
A single QOCT depth scan (A-scan) is obtained by sweeping the lens-mirror combination in the delay arm in the direction and recording the coincidence rate with the sample fixed at a particular transverse () position. The collection of all A-scans for different transverse positions provides the three-dimensional optical sections for our sample.
If a mirror were to replace the biological sample, the setup depicted in Fig. 1 would be equivalent to a Hong-Ou-Mandel (HOM) interferometer HOM and the coincidence rate would trace out a dip whose minimum would occur when the path lengths of the delay and sample arms were equal. As such, an A-scan of a biological sample would comprise a collection of coincidence-rate minima occuring whenever the path length in the delay arm matches that of a reflecting surface in the sample. These coincidence-rate minima constitute one class of features that appear in a QOCT A-scan and comprise the information that is most often sought in OCT: the depth and reflectance of the internal surfaces that constitute the sample. Each of these features is associated with a reflection from a single surface and is immune to the degradation of axial resolution caused by group-velocity dispersion (GVD) in the layers above that surface. As will be shown shortly, these features are used to trace the surface topography of an onion-skin cell.
A second class of features in the QOCT A-scan arises from cross-interference among the reflection amplitudes associated with every pair of surfaces and is sensitive to the dispersion characteristics of the media between them. This class of features generally washes out for photons that are returned from scattering samples NasrOptExp , and we shall not be concerned with it here.
III Enhancing the reflectance of a biological sample via coating with gold nanoparticles
The biological sample investigated in this work was an onion-skin tissue from a white onion that was coated with spherical gold nanoparticles to increase its reflectance. Gold nanoparticles have recently been used as a molecular-specific contrast-enhancement agent in optical-imaging modalities that rely on the detection of backscattered light, such as OCT and reflectance-confocal microscopy (RCM) Boppart(2003) .
We used commercial citrate-stabilized gold nanoparticles with a nominal diameter of 40 nm, which we modified with two different surface chemistries. One batch consisted of gold nanoparticles whose surface was passivated (pegylated) with a monolayer of self-assembled polyethylene glycols (O-(2-Carboxyethyl)-O′-(2-mercaptoethyl)-heptaethylene glycols). The second batch of gold nanoparticles contained bovine serum albumin (BSA) non-specifically attached to the gold surface. Our gold nanoparticles had a plasmon resonance that peaked at = 527 nm in solution; however, the binding of the gold particles to the cell surface was accompanied by some agglomeration of the particles, which red-shifted the plasmon resonance. We incubated an onion-skin sample into each of the gold-nanoparticle batches for 48 hours and then rinsed them in distilled water.
We optically investigated the two samples, in addition to an untreated (bare) sample, using RCM operated at a wavelength of = 632 nm with a 40X objective lens (NA = 0.9). The results are depicted in Fig. 2. The images in the top row show 300 300 transverse (x y) sections (C-scans) of the onion-skin samples that are (a) untreated (bare), (b) incubated in the first gold-nanoparticle batch, and (c) incubated in the second gold nanoparticle batch. The x y sections clearly show the elongated onion-skin cells with dimensions 75 300 in the transverse plane and with a thickness of about 12 m (not shown). Images (d), (e), and (f), appearing in the middle row, are y z sections (B-scans) of the same onion-skin samples that were used to obtain the C-scans, (a), (b), and (c), respectively. The y z sections were taken along the green lines shown in the C-scans in the top row. Finally, in the bottom row, graphs (g), (h), and (i) display depth scans in the z direction (A-scans) along the red lines shown in the B-scans, (d), (e), and (f), respectively.
Each of the A-scans exhibits three peaks. The left-most peak arises from the reflectance at the surface of the microscope cover slip and corresponds to the 4 reflectance expected from an air-glass interface. We used the height of this peak as a reference to estimate the reflectance of the other peaks. The central peak corresponds to the glass-onion interface, while the right-most peak corresponds to the reflection from the surface of the onion-skin cell. The A-scans in (g) and (h) were obtained by placing the onion skin on a thin cover slip, whereas a thicker microscope slide was used to obtain the A-scan in (i), thereby explaining why the abscissa scale in (i) differs from that in (g) and (h). It is clear that the onion-skin sample coated with the BSA-functionalized gold nanoparticles [Fig. 2(c), (f), and (i)] exhibits the highest reflectance (about 7). Moreover, the transverse cross section in image (c) reveals a relatively flatter surface in comparison with those in images (a) and (b). We believe that this surface flatness greatly improves the z component of the scattering potential of our sample, which is the measurable quantity in an OCT or QOCT A-scan Zaiat(1995) .
IV QOCT optical sectioning of an onion-skin sample
For the QOCT experiment, we prepared an onion-skin sample coated with BSA-functionalized nanoparticles, following the method used to obtain the images in Fig. 2(c), (f), and (i). In this case, the sample was placed on a 1.25-cm-thick antireflection-coated glass slab to insure that the back-reflected photons in the sample arm arose only from the onion skin. We placed the sample in the setup depicted in Fig. 1 and obtained a collection of A-scans at different transverse (x y) positions of the sample.
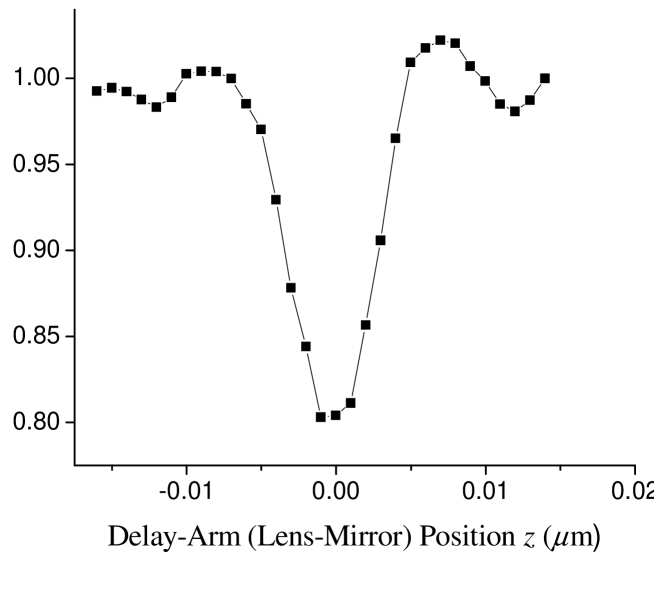
At a particular transverse position of the sample, we scanned the delay-arm lens-mirror combination in the z direction over a range of 30 , using a 1- step size, and recorded the coincidence rate at each step for a 5-second accumulation time. The A-scan obtained thereby was normalized to the measured value of at m, which corresponds to the first collected data point, where the path length of the delay arm did not match the path length to any of the reflecting surfaces in the sample arm. This choice guaranteed that each A-scan was not normalized at an interference point.
The sample was then moved to the next transverse position, with a step size of 5 in both the x and y directions, and a new normalized A-scan was recorded by repeating the steps indicated above. A typical A-scan is displayed in Fig. 3. The observed dip is a result of reflection from the top surface of the sample. The width of the dip, which is m, is in accord with the axial resolution of the experimental setup, which was measured by using a mirror in place of the sample. The transverse resolution was determined by scanning a 5-m-diameter pinhole in the focal plane of the lens; it was estimated to be m.
The collected A-scans were then used to reconstruct optical sections of the sample in the form of C-scans and B-scans.
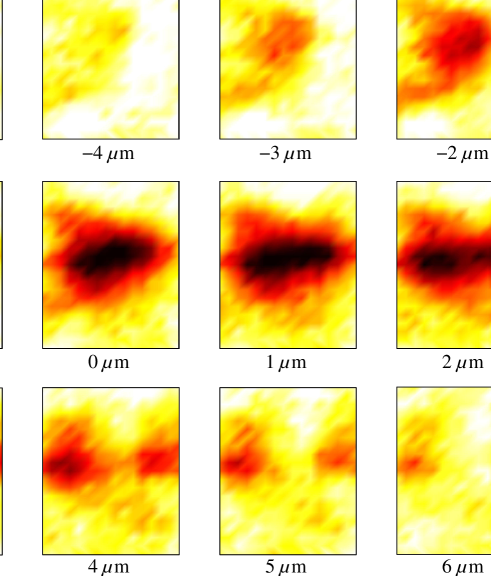
The C-scans (transverse x y sections at various depths ) are displayed in Fig. 4. These x y sections are 75 100 each, and are taken at depth intervals of 1 . The z origin is chosen to approximately coincide with the surface of the onion-skin cells so that, roughly speaking, negative z positions correspond to sectioning in the air above the sample, while positive z positions correspond to sectioning within the cells. A strong QOCT signal is indicated by a decrease in the observed coincidence rate, corresponding to a path-length match between the delay and the sample arms NasrOptExp ; NasrQOCTExpPRL . The C-scan at m clearly shows the elongated structure that is characteristic of onion-skin cells. The dimensions of the onion cells observed using QOCT are smaller than those observed using RCM, probably because of normal sample variation (smaller-sized onion) or dehydration of the sample.
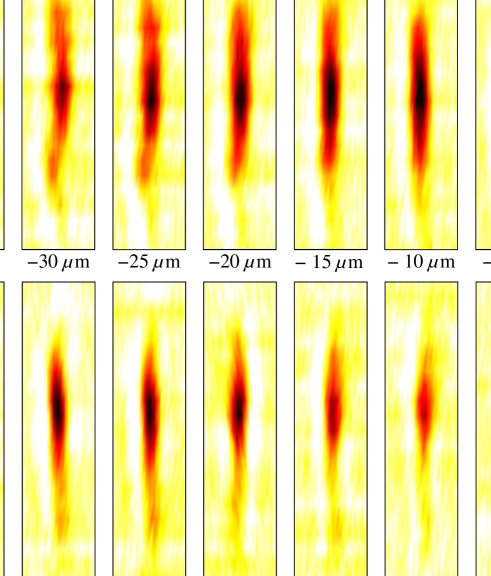
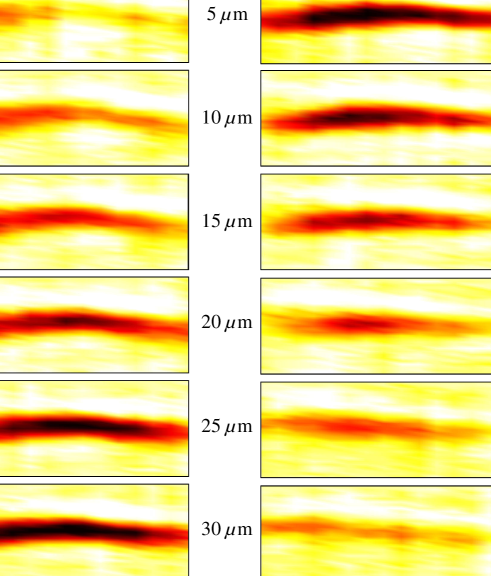
The B-scans take two forms: axial y z sections at various transverse positions and axial x z sections at various transverse positions . These are displayed in Figs. 5 and 6, respectively. The y z sections are 100 30 each, and are shown at intervals of 5 , whereas the x z sections are 75 30 each, and are also shown at intervals of 5 . The x and y origins are placed roughly at the center of the cell. Most of the B-scans shown in Fig. 6 clearly display the curved topography of the onion-skin cell surface.
V Discussion
The results presented here are the first experimental QOCT data from a biological specimen. The signal-to-noise ratio (SNR) and speed of the QOCT technique are determined by a number of factors, including the optical power (biphoton flux) in the interferometer SalehTeichSNR . The experiments presented in this paper were carried out with a flux of about biphotons/sec, corresponding to an optical power of 0.5 pW. This low flux, which was generated by pumping the NLC with a pump power of about 2 mW, can be raised by simply increasing the pump power, but an upper limit on the biphoton flux is imposed by the saturation level of the single-photon detectors and coincidence circuit. Faster single-photon detectors, including those relying on the superconducting technology SSPD(2008) , as well as faster coincidence circuits, are expected to greatly enhance the SNR and speed of QOCT. Furthermore, recent advances in the production of biphotons have provided ultrahigh axial resolution (about 1 ) Nasr(2008) . In the offing are electrically driven solid-state biphoton sources Hayat(2008) that promise optical powers in the W region, making QOCT even more attractive. In short, our experiments suggest that future enhancements in the source photon flux, spatial resolution, and image acquisition time will help make QOCT a viable biological imaging technique.
It is gratifying that QOCT has inspired a number of post-processing algorithms and classical nonlinear-optical configurations that offer dispersion-immune axial sectioning of a sample shapiro(2006) –Resh(2008) . These “quantum-mimetic” techniques have various limitations, however, and to date none of these proposed schemes has successfully been used to demonstrate a scan of a biological specimen.
Acknowledgments
This work was supported by a U. S. Army Research Office (ARO) Multidisciplinary University Research Initiative (MURI) Grant; by the Bernard M. Gordon Center for Subsurface Sensing and Imaging Systems (CenSSIS), an NSF Engineering Research Center; and by the Army Research Laboratory through cooperative agreement W911NF-06-2-0040. We are grateful to A. V. Sergienko for helpful comments, to P. G. Allen for instruction on the use of the reflection confocal microscope, and to D. Whitney for help with the data-collection software.
References
- (1) M. C. Teich and B. E. A. Saleh, “Squeezed states of light,” Quantum Opt. 1, 153–191 (1989) [Reprinted in Tutorials in Optics, edited by D. T. Moore (Optical Society of America, Washington, D.C., 1992), ch. 3, pp. 29-52.
- (2) M. C. Teich and B. E. A. Saleh, “Squeezed and antibunched light,” Phys. Today 43, No. 6, 26–34 (1990).
- (3) L. Mandel and E. Wolf, Optical Coherence and Quantum Optics (Cambridge, New York, 1995), Chaps. 21 & 22.
- (4) A. F. Abouraddy, M. B. Nasr, B. E. A. Saleh, A. V. Sergienko, and M. C. Teich, “Quantum-optical coherence tomography with dispersion cancellation,” Phys. Rev. A 65, 053817 (2002).
- (5) M. B. Nasr, B. E. A. Saleh, A. V. Sergienko, and M. C. Teich, “Dispersion-cancelled and dispersion-sensitive quantum optical coherence tomography,” Opt. Express 12, 1353–1362 (2004).
- (6) S. E. Harris, M. K. Oshman, and R. L. Byer, “Observation of tunable optical parametric fluorescence,” Phys. Rev. Lett. 18, 732–734 (1967).
- (7) D. Magde and H. Mahr, “Study in ammonium dihydrogen phosphate of spontaneous parametric interaction tunable from 4400 to 16000 Å,” Phys. Rev. Lett. 18, 905–907 (1967).
- (8) A. M. Steinberg, P. G. Kwiat, and R. Y. Chiao, “Dispersion cancellation in a measurement of the single-photon propagation velocity in glass,” Phys. Rev. Lett. 68, 2421–2424 (1992).
- (9) T. S. Larchuk, M. C. Teich, and B. E. A. Saleh, “Nonlocal cancellation of dispersive broadening in Mach-Zehnder interferometers,” Phys. Rev. A 52, 4145–4154 (1995).
- (10) M. B. Nasr, B. E. A. Saleh, A. V. Sergienko, and M. C. Teich, “Demonstration of dispersion-canceled quantum-optical coherence tomography,” Phys. Rev. Lett. 91, 083601 (2003).
- (11) R. C. Youngquist, S. Carr, and D. E. N. Davies, “Optical coherence-domain reflectometry: a new optical evaluation technique,” Opt. Lett. 12, 158–160 (1987).
- (12) K. Takada, I. Yokohama, K. Chida, and J. Noda, “New measurement system for fault location in optical waveguide devices based on an interferometric technique,” Appl. Opt. 26, 1603–1606 (1987).
- (13) A. F. Fercher and E. Roth, “Ophthalmic laser interferometry,” Proc. SPIE 658, 48–51 (1986).
- (14) D. Huang, E. A. Swanson, C. P. Lin, J. S. Schuman, W. G. Stinson, W. Chang, M. R. Hee, T. Flotte, K. Gregory, C. A. Puliafito, and J. G. Fujimoto, “Optical coherence tomography,” Science 254, 1178–1181 (1991).
- (15) J. M. Schmitt, “Optical coherence tomography (OCT): A review,” IEEE J. Sel. Topics Quantum Electron. 5, 1205–1215 (1999).
- (16) A. F. Fercher, W. Drexler, C. K. Hitzenberger, and T. Lasser, “Optical coherence tomography—principles and applications,” Rep. Prog. Phys. 66, 239–303 (2003).
- (17) P. H. Tomlins and R. K. Wang, “Theory, developments and applications of optical coherence tomography,” J. Phys. D: Appl. Phys. 38, 2519 -2535 (2005).
- (18) M. E. Brezinski, Optical Coherence Tomography: Principles and Applications (Academic, San Diego, 2006).
- (19) B. E. A. Saleh and M. C. Teich, Fundamentals of Photonics (Wiley, Hoboken, N.J., 2007), 2nd ed., Chap. 22.
- (20) C. K. Hong, Z. Y. Ou, and L. Mandel, “Measurement of subpicosecond time intervals between two photons by interference,” Phys. Rev. Lett. 59, 2044–2046 (1987).
- (21) T. M. Lee, A. L. Oldenburg, S. Sitafalwalla, D. L. Marks, W. Luo, F. J. Toublan, K. S. Suslick, and S. A. Boppart, “Engineered microsphere contrast agents for optical coherence tomography,” Opt. Lett. 28, 1546–1548 (2003).
- (22) A. F. Fercher, C. K. Hitzenberger, G. Kamp, and S. Y. El-Zaiat, “Measurement of intraocular distances by backscattering spectral interferometry,” Opt. Commun. 117, 43–48 (1995).
- (23) B. E. A. Saleh and M. C. Teich, “Noise in Classical and Quantum Photon-Correlation Imaging,” in Advances in Information Optics and Photonics, Vol. PM183, edited by A. T. Friberg and R. Dändliker (SPIE Press, Bellingham, WA, 2008), ch. 21, pp. 423–435.
- (24) F. Marsili, D. Bitauld, A. Fiore, A. Gaggero, F. Mattioli, R. Leoni, M. Benkahoul, and F. Lévy, “High efficiency NbN nanowire superconducting single photon detectors fabricated on MgO substrates from a low temperature process,” Opt. Express 16, 3191–3196 (2008).
- (25) M. B. Nasr, S. Carrasco, B. E. A. Saleh, A. V. Sergienko, M. C. Teich, J. P. Torres, L. Torner, D. S. Hum, and M. M. Fejer, “Ultrabroadband biphotons generated via chirped quasi-phase-matched optical parametric down-conversion,” Phys. Rev. Lett. 100, 183601 (2008).
- (26) A. Hayat, P. Ginzburg, and M. Orenstein, “Observation of two-photon emission from semiconductors,” Nature Phot. 2, 238–241 (2008).
- (27) B. I. Erkmen, and J. H. Shapiro, “Phase-conjugate optical coherence tomography,” Phys. Rev. A 74, 041601 (2006).
- (28) K. Banaszek, A. S. Radunsky, and I. A. Walmsley, “Blind dispersion compensation for optical coherence tomography,” Opt. Commun. 269, 152–155 (2007).
- (29) K. J. Resch, P. Puvanathasan, J. S. Lundeen, M. W. Mitchell, and K. Bizheva, “Classical dispersion-cancellation interferometry,” Opt. Express 15, 8797–8804 (2007).
- (30) R. Kaltenbaek, J. Lavoie, D. N. Biggerstaff, and K. J. Resch, “Quantum-inspired interferometry with chirped laser pulses,” e-print quant-ph/0804.4022.