A New Spectroscopic and Photometric Analysis of the Transiting Planet Systems TrES-3 and TrES-4
Abstract
We report new spectroscopic and photometric observations of the parent stars of the recently discovered transiting planets TrES-3 and TrES-4. A detailed abundance analysis based on high-resolution spectra yields [Fe/H] , K, and for TrES-3, and [Fe/H] , K, and for TrES-4. The accuracy of the effective temperatures is supported by a number of independent consistency checks. The spectroscopic orbital solution for TrES-3 is improved with our new radial-velocity measurements of that system, as are the light-curve parameters for both systems based on newly acquired photometry for TrES-3 and a reanalysis of existing photometry for TrES-4. We have redetermined the stellar parameters taking advantage of the strong constraint provided by the light curves in the form of the normalized separation (related to the stellar density) in conjunction with our new temperatures and metallicities. The masses and radii we derive are , , and , for TrES-3 and TrES-4, respectively. With these revised stellar parameters we obtain improved values for the planetary masses and radii. We find , for TrES-3, and , for TrES-4. We confirm TrES-4 as the planet with the largest radius among the currently known transiting hot Jupiters.
1 Introduction
The 40 transiting planet systems confirmed as of August 2008111For a complete listing see http://www.inscience.ch/transits/, or http://exoplanet.eu . show a remarkable diversity of properties, which is indicative of the complexity of planet formation and evolution processes. Many different follow-up studies enabled by the special orientation of these systems (e.g., Queloz et al., 2000; Charbonneau et al., 2002, 2005; Knutson et al., 2007; Tinetti et al., 2007, see Charbonneau et al. 2007 for a review) have brought about rapid improvements in evolutionary models of planet interiors and atmospheres (Baraffe et al., 2004; Lecavelier des Etangs, 2006; Guillot et al., 2006; Burrows et al., 2007). The increasing predictive power of these models is beginning to drive even more challenging observations. On the other hand, the precision and accuracy with which the most basic planet properties such as the mass and radius can be determined is currently limited by our knowledge of the properties of the host stars. Significant uncertainties remain in the stellar mass and radius determinations of many systems. In some cases this is due to poorly determined photospheric properties (mainly temperature and metallicity), and in others to a lack of an accurate luminosity estimate. Additionally, the variety of methodologies used for these determinations and the different approaches towards systematic errors have resulted in a rather inhomogeneous set of planet properties, as discussed by Torres et al. (2008). This complicates the interpretation of patterns and correlations that are being proposed (e.g., Mazeh et al., 2005; Guillot et al., 2006; Hansen & Barman, 2007). Recent improvements in the analysis techniques have the potential to increase the accuracy of the stellar and planetary parameters significantly, especially for the large majority without a direct distance estimate. In particular, the application of the constraint on the stellar density that comes directly from the transit light curves has been shown to be superior to the use of other indicators of luminosity such as the surface gravity () determined spectroscopically (Sozzetti et al., 2007; Holman et al., 2007). Torres et al. (2008) have recently reanalyzed a large subset of the known transiting planets, incorporating these improvements and applying a uniform methodology to all systems.
In the present work we focus on two of the recently discovered transiting systems, TrES-3 (O’Donovan et al., 2007) and TrES-4 (Mandushev et al., 2007), which lack accurate estimates for the photospheric properties of the parent stars and as a result have more uncertain stellar and planetary parameters. To improve upon these properties, we present new radial-velocity and photometric observations of TrES-3 with which we refine both the light curve solution and the spectroscopic orbit. We also carry out a reanalysis of existing TrES-4 photometry utilizing a technique which treats stellar limb darkening using adjustable parameters. We perform the first detailed spectroscopic determination of the photospheric properties of both stars, and we make use of the constraint on the stellar density mentioned above to infer more accurate values for the stellar and planetary masses and radii. Our paper is organized as follows. In § 2 we summarize the observations. In § 3 we present our effective temperature and metallicity determinations, along with several consistency checks aimed at establishing the accuracy of the temperatures. In § 4 we report an updated spectroscopic orbital solution for TrES-3, and the light curve solutions for both systems are discussed in § 5. Section 6 then describes our determination of the stellar masses and radii, which in turn lead to refined values for the planetary parameters over those reported in the discovery papers. We conclude in § 7 by providing a summary of our results and by discussing whether the properties of the host stars give any useful clues on the origin of the strongly contrasting densities of their close-in gas giant planets, particularly in comparison with the other known transiting planet systems.
2 Observations
2.1 New radial velocities for TrES-3
High-resolution, high-SNR (signal-to-noise ratio) spectroscopic observations of TrES-3 were obtained in July and September 2007 with the HIRES spectrograph on the Keck I telescope (Vogt et al., 1994), using essentially the same setup as in the discovery paper. The spectra cover the effective wavelength range 3200–8800 Å, and an iodine (I2) gas absorption cell placed in front of the spectrograph slit was used to superimpose a dense set of narrow molecular lines between 5000 Å and 6000 Å. This iodine spectrum provides a stable wavelength reference and a means of monitoring the instrumental profile that are crucial for achieving precise radial velocity determinations. The observations were reduced and extracted using the MAKEE software written by T. Barlow. We obtained 4 spectra with typical exposure times of 15 min resulting in SNRs of 100 pixel-1, which we combined with the discovery observations reported by O’Donovan et al. (2007) for a total of 11 iodine spectra.
Precise radial velocities were measured following a procedure based on the methodology developed for the AFOE spectrograph (Korzennik et al., 2000), and adapted for the processing of HIRES spectra. Conceptually, the method models the observed star and I2 spectrum by using templates for the stellar and I2 spectra. This model includes physically motivated parameters that describe the spatial and temporal variations of the instrument, including the instrumental profile, as well as the sought-after relative Doppler shift with respect to the stellar template. The model parameters are adjusted to minimize the difference between the model and the observations in a least-squares sense, down to the Poisson noise. The stellar template is estimated by deconvolving an observation taken without superimposing I2, whereas the template for the I2 is based on a high-resolution and high SNR scan of the gas cell using the Fourier Transform Spectrometer on the McMath Solar Telescope at the Kitt Peak Observatory (see Butler et al., 1996). Each spectral order is modeled as a whole but analyzed independently. The final radial velocities are estimated from the mean of the Doppler shifts computed for each order and their uncertainties from the standard deviation of that mean. The resulting velocities, expressed in the solar system barycentric frame, along with their associated formal errors are reported in Table 1. These measurements include and supersede the velocities presented in the discovery paper, and they also correct a minor error in the previously published dates of observation. The revised orbital solution is presented and discussed in § 4.
2.2 Differential photometry: new TrES-3 data and revisited TrES-4 data
In addition to the photometric measurements presented in the discovery paper (O’Donovan et al., 2007), we have collected six other high-cadence, high-precision transit light-curves of TrES-3. One was obtained in the band on UT 2007 April 23 using the CCD camera of the IAC80 telescope at the Observatorio del Teide, Tenerife, Spain, and the other five were gathered using KeplerCam (see, e.g., Holman et al., 2006) at the FLWO 1.2-m telescope: two in the Sloan and bands on UT 2007 April 25 and 2008 March 27, and the remaining three in the band on UT 2008 March 9, April 12, and May 8. On all nights conditions were quite good, except for the presence of high cirrus and highly variable seeing on UT 2008 April 12. The transits were observed at airmasses ranging between 1.00 and 1.80.
All datasets were reduced using standard calibration techniques (overscan correction, trimming, bias subtraction, flat fielding). We then performed aperture photometry of TrES-3 and between 10 and 30 comparison stars, depending on the filter and exposure time. We experimented with different choices for the aperture size, comparison star ensemble, and weighting of the comparison stars, aiming for the smallest out-of-transit (OOT) RMS. In practice, the best aperture size was approximately twice the FWHM of the stellar image on each night, and the best results were obtained using a straight average of the normalized light curves of the comparison stars. As for the formal errors on each photometric data point, we used the product of the OOT RMS of each light-curve and the factor , used to account for departures from Gaussian (“white”) uncorrelated noise (see, e.g., Winn et al., 2008b).
For consistency, we also re-processed in the same way the two discovery light-curves of TrES-3 presented in O’Donovan et al. (2007), as well as the three photometric datasets utilized by Mandushev et al. (2007) in their discovery announcement of TrES-4.
The main characteristics of the TrES-3 and TrES-4 light-curves are summarized in Table 2. The final set of photometric time-series of TrES-3 in all filters (including the discovery data) is available in machine-readable form in the electronic version of Table 3, and is plotted in Figure 1. Table 4 reports all photometric data for TrES-4, which are shown graphically in Figure 2.
3 Atmospheric parameters and age constraints
3.1 Spectroscopic abundance analysis
A detailed abundance analysis was carried out using the Keck/HIRES template spectra of TrES-3 and TrES-4. The stellar atmosphere parameters , , and [Fe/H] were determined using standard methodology (e.g., Gonzalez & Lambert, 1996; Gonzalez et al., 2001; Santos et al., 2004), which we summarize as follows. Equivalent widths (EWs) for a set of relatively weak Fe I and Fe II lines were measured manually in the Keck spectra using the splot task in IRAF (see, e.g., Sozzetti et al., 2004, and references therein, for details on the specific choice of lines). These were then used together with a grid of Kurucz ATLAS plane-parallel stellar model atmospheres (Kurucz, 1993) as inputs to the 2002 version of the MOOG spectral synthesis code (Sneden, 1973)222http://verdi.as.utexas.edu/moog.html .. Atmospheric parameters were derived under the assumption of local thermodynamic equilibrium (LTE), imposing excitation and ionization balance. Formal uncertainties on , , and microturbulent velocity were derived using the approach described in Neuforge & Magain (1997) and Gonzalez & Vanture (1998), while the nominal uncertainty for [Fe/H] corresponds to the scatter obtained from the Fe I lines rather than the formal error of the mean. The resulting set of parameters for TrES-3 is K, , , and [Fe/H] = , and for TrES-4 we obtain K, , , and [Fe/H] = . These values are collected in Table 7 and Table 8, respectively.
As a check, the manual EW measurements used above were compared against the results from the automated software ARES333http://www.astro.up.pt/∼sousasag/ares ., made available to the community by Sousa et al. (2007). Figure 3 shows the comparison between the EWs measured for TrES-3 using ARES and those from the manual approach with IRAF. The top panel indicates excellent agreement between the two; the linear fit has a slope of 1.011. There are no significant correlations with the Fe I line strength (see middle panel): the fractional difference between EWs measured by the two methods has a probability of no correlation of 0.1. Finally, the histogram in the bottom panel shows there is no appreciable systematic difference between the methods. The mean difference and scatter are only 0.67 mÅ and 2.6 mÅ, respectively, which are smaller than found by Sousa et al. (2007) from a similar comparison between FEROS, HARPS and UVES spectra. Consequently, the results of the abundance analysis with MOOG using EWs measured with ARES are virtually identical to those presented earlier.
Following Gonzalez (2008) we also synthesized a number of unblended Fe I lines in the template spectra of both TrES-3 and TrES-4, and determined projected rotational velocities of and , respectively.
Our new determinations of the atmospheric parameters for the parent stars of TrES-3 and TrES-4 are generally in good agreement with the values reported by O’Donovan et al. (2007) and Mandushev et al. (2007), the main difference being that those authors assumed [Fe/H] = 0.0 in their studies, whereas we find significant departures from solar metallicity in both stars.
3.2 External checks on
We describe here additional estimates of the effective temperature for TrES-3 and TrES-4 that serve to test the accuracy of our determinations above.
3.2.1 CfA spectroscopy
Both planet host stars were observed spectroscopically with the Center for Astrophysics (CfA) Digital Speedometer (Latham, 1992) as part of the regular follow-up after the discovery of photometric signals suggesting transits. These observations cover 45 Å in a single echelle order centered at 5187 Å, and have . While this resolving power is moderately high, the SNRs of the spectra are low, ranging from 7 to 13 per resolution element of 8.5 for the 13 exposures of TrES-3, and SNRs of 11–13 for the 7 exposures of TrES-4. Nevertheless, useful information on the stellar properties can be extracted from these spectra as described by Torres et al. (2002). Briefly, the observed spectra are cross-correlated against a library of synthetic spectra based on Kurucz model atmospheres (see Nordström et al., 1994; Latham et al., 2002), calculated over a wide range of values of , , [Fe/H], and rotational velocity . The combination of parameters yielding the highest correlation averaged over all exposures is adopted as a representation of the properties of the star. Due to the narrow wavelength range and limited SNRs, the first three of the above properties are typically strongly correlated and are difficult to determine simultaneously. Given these constraints, in the discovery papers we initially held the metallicity fixed at the solar value for both stars.
For TrES-3, which our Keck spectroscopy indicates is slightly metal-poor, we repeated the above determination using a fixed metallicity of [Fe/H] , and interpolated and to the precise composition from Table 7. We obtained K and , where the uncertainties include contributions both from the error in the adopted [Fe/H] and the internal errors. The temperature as well as the surface gravity are consistent with the Keck determinations, within the uncertainties. Similarly for TrES-4 we repeated the determinations for [Fe/H] , given the metal-rich composition indicated by the Keck spectroscopy, and interpolated to the intermediate value from Table 8. The results are K and , which are once again in good agreement with the more reliable estimate from Keck.
3.2.2 Line depth ratios
While the temperature determinations discussed so far are implicitly based on the strength of the spectral lines, Gray & Johanson (1991) have demonstrated that highly precise information can also be extracted using the ratio of the depths of two spectral lines having different sensitivity to temperature. However, rather than yielding absolute temperatures, this technique in its original formulation only measures changes in temperature, albeit with extremely high precision often reaching a few Kelvin (see, e.g., Gray, 1994; Catalano et al., 2002; Kovtyukh et al., 2003). Absolute temperatures can still be obtained with recourse to external color-temperature calibrations, since line-depth ratios (LDRs) are usually strongly correlated with the color index of the star. The accuracy of such determinations is then limited by the calibrations themselves.
Biazzo et al. (2007) have presented LDR- calibrations based on 26 carefully selected lines of Fe, V, Sc, Si, and Ni in the spectral interval 6190–6280 Å, grouped into 16 line pairs. These calibrations are valid for stars with temperatures between 3800 K and 6000 K, so unfortunately the technique is not applicable to TrES-4. For TrES-3 we measured all 26 lines in our high-SNR Keck template spectrum, and adopted the Biazzo et al. (2007) calibrations appropriate for stars with rotational velocities of 10 (very close to the value reported by Mandushev et al. (2007) and obtained also in this work). The temperature scale of these relations relies on a transformation between and by Gray (2005), which makes use of a mixture of dwarf and giant temperatures obtained by many different methods and does not account for differences in metallicity. For the present work we have preferred to use more sophisticated color-temperature relations such as those by Ramírez & Meléndez (2005) and Casagrande et al. (2006), which account not only for luminosity class but include also metallicity terms, and are based on effective temperatures derived homogeneously by the Infrared Flux Method. The conversion from the LDR-based inferred from the Biazzo et al. (2007) relations back to an average color for the star using the Gray (2005) prescription gives . Our two preferred color-temperature relations mentioned above then yield a weighted average temperature of K for TrES-3, in which the uncertainty includes observational errors propagated from the LDR measurements as well as the scatter of the calibrations. This result is consistent with our more direct estimate in § 3.1.
3.2.3 Hα line profiles
As is well known, the wings of the line (but not its core, formed higher up in the atmosphere under non-LTE conditions) are very sensitive to variations, but are relatively insensitive to changes in and [Fe/H] (see, e.g., Sozzetti et al., 2007; Santos et al., 2006, and references therein). This allows for a useful consistency check on our estimates above. We compared the observed Hα line profiles in our Keck template spectra of TrES-3 and TrES-4 against synthetic profiles for solar-metallicity dwarfs ([Fe/H] = 0.0, ) from the Kurucz database. The results of this exercise are displayed in Figure 4, in which 10 Å regions centered on Hα are shown for each star together with four calculated profiles for different values of . In both cases the temperatures one would infer from these comparisons agree well with the estimates reported in Table 7 and Table 8.
3.2.4 Photometric estimates
An additional check on the effective temperatures is available from the multi-color photometry for TrES-3 and TrES-4. Measurements in Johnson , Cousins , and 2MASS were used to derive seven color indices for TrES-3, and nine for TrES-4 when considering also the and measurements from the Tycho-2 catalog (Høg et al., 2000). The calibrations by Ramírez & Meléndez (2005) and Casagrande et al. (2006) then yielded weighted average temperatures of K and K for TrES-3 and TrES-4, respectively, ignoring extinction and adopting [Fe/H] in each case as determined in § 3.1. The uncertainties include photometric errors and metallicity errors, as well as the scatter of the calibrations, but exclude unquantified systematic errors in the calibrations themselves. These temperatures are 260 K and 65 K cooler than our spectroscopic determinations above. They can be reconciled with the values in § 3.1 if we assume the presence of reddening, and correct each of the indices. For TrES-4 the required value of is hardly significant ( mag), but for TrES-3 we obtain mag.444The presence of reddening in TrES-3 is already apparent from our results in § 3.2.2, in which the LDR-based color is significantly bluer than the measured value of (O’Donovan et al., 2007). For comparison, the reddening maps of Burstein & Heiles (1982) and Schlegel et al. (1998) indicate a total reddening along the line of sight to each star of only mag, and similar results are obtained from the model of Galactic dust distribution by Drimmel & Spergel (2001). This is not inconsistent with the small value we infer for TrES-4, but it is much smaller than our estimate for TrES-3. Possible explanations include patchy interstellar material combined with the relatively coarse resolution of these maps (a few arc minutes for Schlegel et al., 1998), or perhaps the presence of circumstellar material in TrES-3.
3.3 Constraints on the age
The reliability of age indicators for stars older than 1–2 Gyr, such as chromospheric activity and lithium (Li) abundance, as well as their interagreement, have been the subject of much debate in the literature (e.g., Pace & Pasquini, 2004; Lambert & Reddy, 2004; Song et al., 2004; Sestito & Randich, 2005; Sestito et al., 2006). The difficulties are due to many factors, including (but not limited to) non-trivial correlations between chromospheric activity, rotation, mass, and age, limited availability of activity estimates averaged over entire stellar activity cycles555One can appreciate how sensitive the age can be to activity cycles by considering the temporal evolution of the activity levels in the Sun, with values of that range from to . These correspond to ages of Gyr and 2.5 Gyr, respectively (see, e.g., Henry et al., 1996)., insufficient understanding of the temporal evolution of Li depletion due to the complex interplay between various processes (e.g., convection, mixing, diffusion, mass loss), and non-negligible differences in the observed behavior of chromospheric activity and Li depletion as a function of mass, age, and chemical abundance between stars in young and old clusters, and in the field.
We have nonetheless attempted to use the Ca II activity indicator and the lithium abundance as measured in our HIRES spectra of TrES-3 and TrES-4 to provide independent constraints for comparison with the formal age estimates determined below from evolutionary models (see § 6), as well as to search for possible peculiarities of these two planet hosts compared to other samples of stars with and without planets.
Figure 5 shows a region of the HIRES template spectra for each star centered on the Ca II H line. Clear emission is seen in the core of the line of TrES-3, but not in TrES-4. Following the procedure outlined in Sozzetti et al. (2004) we measured the chromospheric emission ratio , corrected for the photospheric contribution, from the Ca II H and K lines in each of our spectra. We obtained and for TrES-3 and TrES-4, respectively. TrES-3 thus appears moderately active, while TrES-4 is quite the opposite. The resulting chromospheric age estimates, using the relations summarized in Wright et al. (2004), are Gyr for TrES-3 and Gyr for TrES-4.
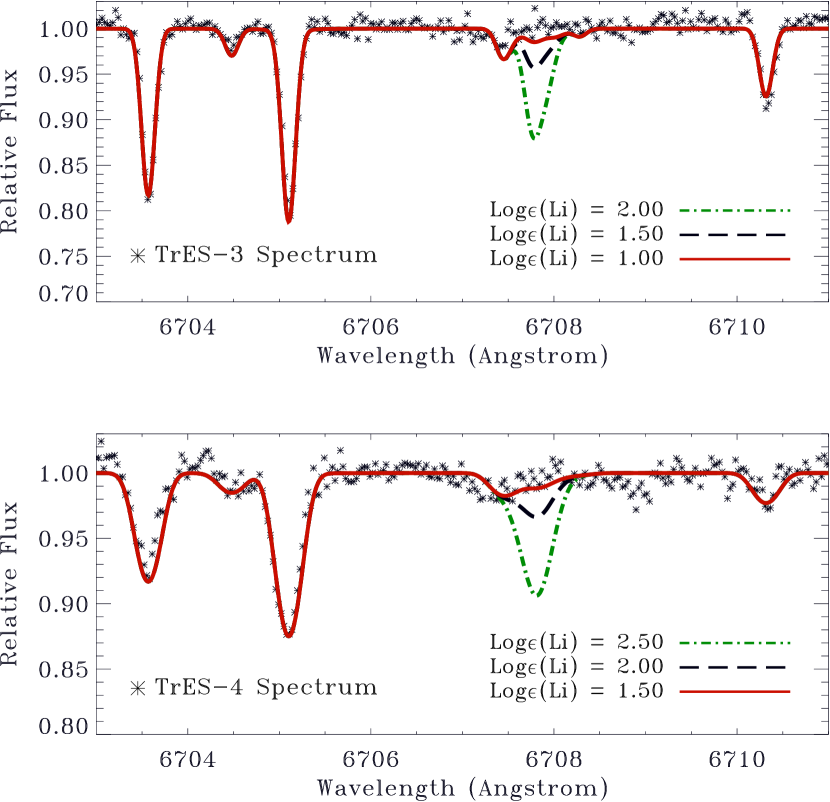
In Figure 6 we show the results of the spectral synthesis of a 10 Å region centered on the Li 6707.8 line, using the atmospheric parameters derived from the Fe-line analysis and the line list of Reddy et al. (2002). The two panels display the comparison between the observed spectra and three synthetic spectra, each differing only in the assumed Li abundance. Neither star shows a measurable Li line, and we can only place upper limits of and for TrES-3 and TrES-4, respectively. By comparison with average Li abundance curves as a function of effective temperature for clusters of different ages (Sestito & Randich, 2005), one would infer a rather old age for TrES-3 of Gyr, nominally inconsistent with the estimate above from the Ca II activity index. Based on its Li the object appears decidedly older than Hyades stars of the same , and this argument is corroborated (e.g., Pace & Pasquini, 2004) by the small we measure (see Table 7). For TrES-4, the age inferred from the Sestito & Randich (2005) relations is Gyr, which is in qualitative agreement with the absence of significant chromospheric activity as well as with the inferred value of the surface gravity (see Table 8), which indicates the star is somewhat evolved. The measured Li abundance for TrES-3 is in line with values determined by Israelian et al. (2004) for a sub-sample of nearby planet hosts with the same , while TrES-4 appears more depleted than other planet hosts of similar , , and [Fe/H]. We discuss briefly in § 7 some implications of these findings in the broader context of the existence of chemical peculiarities in planet hosts in comparison with stars without detected planets.
From the measurements in this section we conclude that the above results are consistent with the notion that neither star is very young ( 1–2 Gyr), that TrES-3 is likely to be of intermediate age (3 Gyr), and that TrES-4 appears older and more evolved.
4 Revised spectroscopic orbital solution for TrES-3
Using the radial velocities presented in § 2.1 we have updated the orbital solution given by O’Donovan et al. (2007), adopting the improved ephemeris described below in § 5.1. A Keplerian circular orbit was adjusted to the data, and the results may be seen in Table 9 and are shown graphically in Figure 7. As found also by O’Donovan et al. (2007), the solution gives a scatter that is larger than expected from the internal velocity errors. This is most likely due to velocity “jitter” associated with chromospheric activity. If we model this as excess scatter to be added quadratically to the internal errors, we find that the amount of jitter required to produce a reduced value near unity is 18.5 . External estimates of the jitter for TrES-3 can be made on the basis of the spectral type, the measured value of , and the activity index , and vary considerably but generally range from about 5 to 20 (Saar et al., 1998; Santos et al., 2000; Paulson et al., 2002; Wright, 2005). These estimates are thus consistent with our findings. Nevertheless, as a test we also modeled the data with an eccentric orbit but did not obtain much improvement, and the result for the eccentricity was not significantly different from zero (). There are no indications of long-term variations in the observations at hand.
5 Light-curve analysis
The analysis of the differential photometry for TrES-3 and TrES-4 was carried out in essentially the same manner as described in Torres et al. (2008). We refer the reader to that paper for the details. Given that we have multiple light curves for each system, we first determined the individual times of transit as described below in order to improve the ephemeris, and we subsequently refined the light-curve parameters.
5.1 Transit timings
To determine the center of each measured transit event we initially adopted the light-curve parameters from the discovery papers. For TrES-3, we adopted a quadratic limb darkening (LD) law with coefficients from Claret (2004), interpolated to the values K, dex, [M/H] dex, and . All LD coefficients for the various filters are reported in Table 5. We fitted each light curve individually to solve only for the time of transit center and also a linear function of time (two parameters) to describe the OOT flux (the slope in the OOT flux accounts for systematic errors, including differential extinction). The measured mid-transit times are presented in Table 6. We then fitted a straight line to the central times of the eight transits of the form and derived the following new ephemeris (which we report in Table 9): (HJD), days. With a number of degrees of freedom , the resulting reduced indicates a rather poor fit. The transit timing residuals for TrES-3 are shown in Figure 8. There are four outliers at the 2–3.5 level. This could be seen as evidence suggesting that the period is not constant. Alternatively, the errors might have been underestimated. The data available are not enough to draw any significant conclusion on the nature of these variations, but clearly additional observations are warranted. We leave for a future study the evaluation of the dynamical interpretation and significance of the transit times, as was done, for example, by Steffen & Agol (2005) for TrES-1 and by Diaz et al. (2008) for OGLE-TR-111b.
Similarly for TrES-4, we re-fitted the three discovery light-curves using the Claret (2004) LD coefficients listed in Table 5 appropriate for K, dex, [M/H] dex, and = 2.0 . The corresponding times of transit center, derived with the same procedure adopted for TrES-3, are presented in Table 6. Given the short time baseline of these observations, we did not derive a new ephemeris for the system, but for the purpose of the analysis presented in the next Section we simply adopted the Mandushev et al. (2007) values of and .
5.2 Light-curve system parameters
Next, for both TrES-3 and TrES-4 we locked the transit times and OOT baseline functions at the values indicated above and then, under the assumption of a circular orbit, we fitted all light curves simultaneously using the algorithm by Mandel & Agol (2002) to derive the relevant quantities radius ratio (where and are the planetary and stellar radius, respectively), inclination , projected separation (where is the semi-major axis), and impact parameter . For TrES-3 we found , , , and . For TrES-4, we obtained , , , and . These estimates were derived assuming initial values for the stellar and planetary masses of and for TrES-3, and and for TrES-4, although the results are insensitive to these values.
Recent studies of transiting exoplanets light curves (e.g., Southworth, 2008, and references therein) have highlighted some issues related to how much effect different treatments of limb darkening can have on the light-curve solutions. In particular, these do not appear to be significantly affected by the specific choice of the LD law, while fixing the LD coefficients to their theoretical values seems to result in significantly smaller uncertainties in the fitted parameters with respect to the case in which the LD coefficients are also adjusted during the fitting procedure. The above results were obtained keeping all LD coefficients fixed. We decided to investigate the effect of fitting for the LD coefficients in the following way. Given the quality of the data available to us, we can only fit for one coefficient (or one combination of the two coefficients). We chose to fix the quadratic coefficient and solve for the linear coefficient . We found that allowing complete freedom in the linear coefficient resulted in “unphysical” solutions (e.g., largely negative coefficients). Southworth (2008) found that the fitted LD coefficients are usually within 0.1–0.2 of the theoretical Claret values, and that is consistent with our experience (see, e.g., Winn et al., 2007). We then decided to use an a priori constraint enforcing an agreement of , modifying the merit function as follows:
| (1) |
where is the stellar flux observed at time , its corresponding error, is the model value, is the adjustable linear LD coefficient, and its theoretical value (appropriate for each band-pass). Furthermore, for TrES-3 all three -band light curves were required to agree on the LD parameter, and the same requirement was set on the two -band light curves for TrES-4. The results for the TrES-3 system parameters in this case were , , and . For TrES-4, we obtained , , and .
In both cases, the agreement between the system parameters derived keeping the LD coefficients fixed and those when the LD coefficients are part of the solution was excellent, with only a slight increase in the estimated uncertainties for the latter case. Indeed, as already noted by Southworth (2008), fixing the LD coefficients at their theoretically predicted values does not appear to significantly bias the results. However, in the interest of providing more conservative error estimates, we believe that, for the purpose of the analysis of high-quality light-curves such as the ones presented in this paper, a procedure that treats LD coefficients as adjustable parameters is preferable. Based on the above considerations, for both TrES-3 and TrES-4 we elected to include in Table 9 and Table 10 the values of the systems parameters obtained from the light-curve analysis in the case in which the linear LD coefficient was allowed to float. We note that this approach provides a departure from the Torres et al. (2008) analysis.
6 Stellar and planetary parameters
The revised spectroscopic determinations of and [Fe/H], along with the new spectroscopic orbital solution for TrES-3 and the light curve fits presented above, allow us to refine the determination of the stellar and planetary properties for both systems. To establish the properties of the parent stars we rely on stellar evolution models by Yi et al. (2001) and Demarque et al. (2004). We make explicit use of the constraint on the stellar density provided by the light-curve quantity , as described by Sozzetti et al. (2007). The procedure follows closely that given in the previous citation. Briefly, we seek the best match (in a sense) between the measured {, [Fe/H], } and points on a finely interpolated grid of isochrones spanning a wide range of metallicities and ages. Two minor improvements in this procedure, described in more detail by Torres et al. (2008), have to do with the weighting of each point sampled along the isochrones according to the distance in -[Fe/H]- space compared to the observed values, and an additional weighting according to the likelihood that the star is in a particular evolutionary state. The latter effect is accounted for by multiplying the first weight by the expected number density of stars at each location in the H-R diagram, according to an adopted Initial Mass Function (which in this case is simply a power law with a Salpeter index). The impact of these weighting factors is generally minor.
The results for the stellar properties of TrES-3 and TrES-4 are presented in Table 7 and Table 8. The distance estimate to TrES-3 accounts for interstellar extinction ( mag), as described in § 3.2.4. For both stars the surface gravity inferred from the models is typically much more accurate than the spectroscopic gravity determination, showing the power of the constraint on the luminosity and size of the star afforded by . The results for both TrES-3 and TrES-4 supersede those given recently by Torres et al. (2008) because of the new photometry and radial velocities contributed here in the former case, and the new light-curve solutions for both systems. The evolutionary ages for the two stars are qualitatively consistent with our conclusions from § 3.3, but are somewhat more uncertain in the case of TrES-3. Finally, using the distance estimates inferred in this work, the UCAC2 proper motion components (Zacharias et al., 2004) reported by O’Donovan et al. (2007) and Mandushev et al. (2007), and the mean radial velocity values and as measured with the CfA Digital Speedometers, we obtain Galactic space motion vectors [, , ] = [+27.3, +6.7, +33.0] and [, , ] = [43.9, 39.1, 6.9] for TrES-3 and TrES-4, respectively (where is taken to be positive toward the Galactic anticenter). We collect these results along with the other properties derived previously in Table 7 and Table 8.
The planet parameters follow from the stellar properties and the results of the transit light curve and spectroscopic orbits, and are presented in Table 9 and Table 10. For TrES-3, our planetary mass and radius are significantly larger compared with the determinations in the discovery paper and in Torres et al. (2008). This is due in part to the increased mass and radius for the parent star, but also to the larger radius ratio based on the new photometry.
7 Summary and discussion
Our detailed spectroscopic analyses of TrES-3 and TrES-4 have yielded accurate values of the atmospheric properties ( and [Fe/H]), which are critical for establishing the fundamental properties of the hosts. The accuracy of the temperatures is supported by a number of independent checks (low-resolution spectroscopy, line-depth ratios, Hα line profiles, color-temperature calibrations) that gives us confidence that the inferred stellar properties are reliable. We find that TrES-3 is a main-sequence G dwarf with a metallicity about 1.5 times lower than the Sun’s, not a very common occurence among exoplanets hosts. TrES-4 is a somewhat evolved late F star that is nearing the end of its main-sequence phase, and is slightly enhanced in its iron content with respect to the solar abundance.
The agreement we find between age indicators for TrES-3 and TrES-4 based on measurements of the Ca II activity levels, the lithium abundances, and rotation, and the evolutionary age inferred from the models is fair, although, as discussed in § 3.3, the reliability of empirical age estimates for stars that are not young ( Gyr) is somewhat questionable. The model estimates themselves are not without their problems. Nevertheless, we conclude the stars are 1–3 Gyr old. Neither star stands out as peculiar when compared with other planet hosts with similar physical properties. In TrES-3 the small value and the fact that we can only place an upper limit on the Li abundance are consistent with the notion that planet hosts with similar to the Sun appear to rotate more slowly and are more Li-depleted than stars without detected planets. As pointed out recently (Gonzalez, 2008, and references therein), this evidence suggests that a planet-forming disk may induce additional rotational braking, leading to enhanced mixing in the stellar envelope, which in turn accelerates the destruction of lithium. TrES-4, on the other hand, does not seem consistent with the claim by Gonzalez (2008) that hotter planet hosts with K have higher Li abundances, possibly due to self-enrichment processes. It is worth keeping in mind, however, that these discrepancies may not be significant given the large spread in the Li abundance for field stars with the temperature and mass of TrES-4 (e.g., Lambert & Reddy, 2004). New investigations on these issues are clearly needed based on uniform analyses of large samples of planet hosts and statistically significant, well-defined control samples of stars without detected planets.
New radial-velocity measurements for TrES-3 presented here have enabled us to revise the spectroscopic orbit for that system. We detect no indication of any longer-term variations in the radial velocities that might suggest the presence of another body in the system. However, the small number of observations and their limited time span of only 6 months emphasize the need for continued Doppler monitoring of this and other transiting planet systems to investigate the possibility of additional companions. In stark contrast to the considerable ground-based and space-based efforts invested in studying in great detail the atmospheric properties of many of these objects, which have undoubtedly led to tremendous insights into their structure, formation, and evolution, the amount of radial-velocity data available for transiting planets is meager, and often does not go beyond the handful of observations published in the discovery papers. Interest in the radial velocities seems to be quickly lost. It should be pointed out that the frequency of close-in giant planets ( day) with additional massive planets in outer orbits (up to the detection limit of today’s Doppler surveys, AU; see, e.g., Butler et al., 2006, and references therein) is about 12% (8 out of 70 systems discovered via RV methods), and it would therefore be wise to continue the velocity monitoring of some of the transiting systems. If additional planets in a transiting system were detected, they might also be found to undergo transits, and such a discovery would allow us to constrain structural models for gas giants akin to Jupiter or Saturn, and open exciting opportunities for additional investigations with present (Spitzer) and upcoming (JWST) space-borne observatories.
Accurate stellar properties for TrES-3 and TrES-4 have been derived here following the approach described in Sozzetti et al. (2007) and Holman et al. (2007), comparing the spectroscopically determined and [Fe/H] values along with the photometrically measured with current stellar evolution models. These properties have in turn allowed us to refine the determination of the mass and radius of the planets. In particular, we confirm that TrES-4 is the planet with the largest radius among the currently known transiting hot Jupiters.
Recently, Winn et al. (2008a) derived upper limits on the albedo of TrES-3 based on the nondetection of occultations observed at optical wavelengths. Our findings are relevant to this study in two ways. Firstly, they strengthen the case for a circular orbit, which is important because if the orbit is eccentric then it would be possible that Winn et al. (2008a) did not observe TrES-3 at the actual times of occultations and that their data place no constraint on the albedo. Secondly, our revised light-curve parameters are relevant because the upper limit on the geometric albedo () was inferred from the measured upper limit on the planet-to-star flux ratio () according to
| (2) |
Our revised value of therefore leads to revised upper limits on the geometric albedo of TrES-3. However, this revision turns out to be minor: the new value of is only 1.5% larger than the value used by Winn et al. (2008a). The upper limits on the geometric albedo become weaker by about 3%. At 99% confidence, the revised upper limits are 0.31, 0.64, and 1.10 in , , and band, respectively.
There is a large spread in the observed radii and densities for transiting planets of comparable mass placed at similar orbital distance from stars of very similar properties (, , [Fe/H], and age). For example, if we consider TrES-4 along with 5 other transiting planet hosts (excluding HAT-P-2) with similar characteristics (HD 149026, HD 209458, OGLE-TR-56, OGLE-TR-132, and WASP-1), the nominal masses of the attending planets vary by a factor of , but reported densities vary by a factor of (e.g., Torres et al., 2008). Many theoretical mechanisms have been proposed to inflate the radius of a strongly irradiated planet, such as additional sources of internal heating due to stellar insolation (Guillot & Showman, 2002), tidal heating due to non-zero eccentricity caused by gravitational interaction with an outer companion (Bodenheimer et al., 2001) or by rotational obliquity (Winn & Holman, 2005), elevated interior opacity due to enhanced atmospheric metallicity (Guillot et al., 2006; Burrows et al., 2007), or varying core masses (Fortney et al., 2007). None of these appear capable of explaining the observed spread in density in a natural way (see also Fabrycky et al., 2007).
Of the 6 stars just mentioned, all are more metal-rich than the Sun, except for HD 209458, which has [Fe/H] close to solar. Some of the above models (Guillot et al., 2006; Burrows et al., 2007) predict a positive correlation between the inferred planetary core mass and the host star’s metallicity, as in the framework of the core-accretion model of giant planet formation (e.g., Pollack et al., 1996; Alibert et al., 2005). This idea assumes [Fe/H] closely tracks the metallicity of the protoplanetary disk, so that more metal-rich stars should be orbited by more metal-rich planets, with a larger heavy-element content. However, among these 6 systems only one planet (HD 149026b) has an inferred core mass significantly larger than zero, and four of the other planets have measured radii so large that the cores are likely to be insignificant. In fact, even in the absence of a core the observed radii cannot be reproduced by the models, with TrES-4 being the extreme case. Interestingly, over 40% of the transiting planets reported in Table 5 of Torres et al. (2008) do not appear to require any core at all to explain their sizes (according to the models of Fortney et al., 2007). Taking all this into consideration, the claimed evidence for a core mass–metallicity correlation could indeed be seen as supporting the more widely accepted scenario of formation by core accretion, but from the indications above it may also be that a significant fraction of these objects formed in a different way (e.g., Durisen et al., 2007, and references therein).
Given the evidence collected so far, we suggest that simply connecting the host star’s characteristics to the structural properties of transiting planets may in fact be an over-simplification. We conclude by stressing the importance of refining our understanding of the complex interplay between the disk environment and a forming giant planet, and its evolutionary history after envelope accretion, which might turn out to be more directly responsible for its final structure and composition than the metal content of the parent star.
References
- Alibert et al. (2005) Alibert, Y., Mordasini, C., Benz, W., & Winisdoerffer, C. 2005, A&A, 434, 343
- Baraffe et al. (2004) Baraffe, I., Selsis, F., Chabrier, G., Barman, T., Allard, F., Hauschildt, P. H., & Lammer, H. 2004, A&A, 419, L16
- Bevington (1969) Bevington, P. R. 1969, Data Reduction and Error Analysis for the Physical Sciences (McGraw-Hill: New York), p. 200
- Biazzo et al. (2007) Biazzo, K., Frasca, A., Catalano, S., & Marilli, E. 2007, AN, 328, 938
- Bodenheimer et al. (2001) Bodenheimer, P., Lin, D. N. C., & Mardling, R. A. 2001, ApJ, 548, 466
- Burrows et al. (2007) Burrows, A., Hubeny, I., Budaj, J., & Hubbard, W. B. 2007, ApJ, 661, 502
- Burstein & Heiles (1982) Burstein, D., & Heiles, C., 1982, AJ, 87, 1165
- Butler et al. (1996) Butler, R. P., Marcy, G. W., Williams, E., McCarthy, C., Dosanjh, P., & Vogt, S. S. 1996, PASP, 108, 500
- Butler et al. (2006) Butler, R. P., et al. 2006, ApJ, 646, 505
- Casagrande et al. (2006) Casagrande, L., Portinari, L., & Flynn, C. 2006, MNRAS, 373, 13
- Catalano et al. (2002) Catalano, S., Biazzo, K., Frasca, A., & Marilli, E. 2002, A&A, 394, 1009
- Charbonneau et al. (2002) Charbonneau, D., Brown, T. M., Noyes, R. W., & Gilliland, R. L. 2002, ApJ, 568, 377
- Charbonneau et al. (2005) Charbonneau, D., et al. 2005, ApJ, 626, 523
- Charbonneau et al. (2007) Charbonneau, D., Brown, T. M., Burrows, A., & Laughlin, G. 2007, in Protostars and Planets V, B. Reipurth, D. Jewitt, and K. Keil (eds.), University of Arizona Press (Tucson), 701
- Claret (2004) Claret, A. 2004, A&A, 428, 1001
- Deeg & Doyle (2001) Deeg, H. J., & Doyle, L. R. 2001, in Third Workshop on Photometry, 85
- Deeg et al. (2008) Deeg, H. J., Ocaña, B., Kozhevnikov, V. P., Charbonneau, D., O’Donovan, F. T., & Doyle, L. R. 2008, A&A, 480, 563
- Demarque et al. (2004) Demarque, P., Woo, J.-H., Kim, Y.-C., & Yi, S. K. 2004, ApJS, 155, 667
- Diaz et al. (2008) Díaz, R. F., Rojo, P., Melita, M., Hoyer, S., Minniti, D., Mauas, P. J. D., and Ruíz, M. T. 2008, ApJ, 682, L49
- Drimmel & Spergel (2001) Drimmel, R., & Spergel, D. N. 2001, ApJ, 556, 181
- Durisen et al. (2007) Durisen, R. H., Boss, A. P., Mayer, L., Nelson, A. F., Quinn, T., & Rice, W. K. M. 2007, in Protostars and Planets V, B. Reipurth, D. Jewitt, and K. Keil (eds.), University of Arizona Press (Tucson), 607
- Fabrycky et al. (2007) Fabrycky, D. C., Johnson, E. T., & Goodman, J. 2007, ApJ, 665, 754
- Fortney et al. (2007) Fortney, J. J., Marley, M. S., & Barnes, J. W. 2007, ApJ, 659, 1661
- Giménez (2006) Giménez, A. 2006, A&A, 450, 1231
- Gonzalez & Lambert (1996) Gonzalez, G., & Lambert, D. L. 1996, AJ, 111, 424
- Gonzalez (1998) Gonzalez, G. 1998, A&A, 334, 221
- Gonzalez & Vanture (1998) Gonzalez, G., & Vanture, A. D. 1998, A&A, 339, L29
- Gonzalez et al. (2001) Gonzalez, G., et al. 2001, AJ, 121, 432
- Gonzalez (2008) Gonzalez, G. 2008, MNRAS, in press (arXiv:0802.0434)
- Gray & Johanson (1991) Gray, D. F., & Johanson, H. L. 1991, PASP, 103, 439
- Gray (1994) Gray, D. F., 1994, PASP, 106, 1248
- Gray (2005) Gray, D. F. 2005, The Observation and Analysis of Stellar Photospheres, 3rd Edition, Cambridge, UK: Cambridge University Press
- Guillot & Showman (2002) Guillot, T., & Showman, A. P. 2002, A&A, 385, 156
- Guillot et al. (2006) Guillot, T., Santos, N. C., Pont, F., Iro, N., Melo, C., & Ribas, I. 2006, A&A, 453, L21
- Hansen & Barman (2007) Hansen, B. M. S., & Barman, T. 2007, ApJ, 671, 861
- Høg et al. (2000) Høg, E., Fabricius, C., Makarov, V. V., Urban, S., Corbin, T., Wycoff, G., Bastian, U., Schwekendiek, P., & Wicenec, A. 2000, A&A, 355, L27
- Henry et al. (1996) Henry, T. J., Soderblom, D. R., Donahue, R. A., & Baliunas, S. L. 1996, AJ, 111, 439
- Holman et al. (2006) Holman, M. J., et al. 2006, ApJ, 652, 1715
- Holman et al. (2007) Holman, M. J., et al. 2007, ApJ, 664, 1885
- Israelian et al. (2004) Israelian, G., Santos, N. C., Mayor, M., & Rebolo, R. 2004, A&A, 414, 601
- Knutson et al. (2007) Knutson, H. A., et al. 2007, Nature, 447, 183
- Korzennik et al. (2000) Korzennik, S. G., Brown, T. M., Fischer, D. A., Nisenson, P., & Noyes, R. W. 2000, ApJ, 533, L147
- Kovtyukh et al. (2003) Kovtyukh, V. V., Soubiran, C., Belik, S. I., & Gorlova, N. I. 2003, A&A, 411, 559
- Kurucz (1993) Kurucz, R. L. 1993, ATLAS9 Stellar Atmosphere Programs and 2 km/s Grid CDROM, Vol. 13, Smithsonian Astrophysical Observatory
- Lambert & Reddy (2004) Lambert, D, L., & Reddy, B. E. 2004, MNRAS, 349, 757
- Latham (1992) Latham, D. W. 1992, in IAU Coll. 135, Complementary Approaches to Double and Multiple Star Research, ASP Conf. Ser. 32, eds. H. A. McAlister & W. I. Hartkopf (San Francisco: ASP), 110
- Latham et al. (2002) Latham, D. W., Stefanik, R. P., Torres, G., Davis, R. J., Mazeh, T., Carney, B. W., Laird, J. B., & Morse, J. A. 2002, AJ, 124, 1144
- Lecavelier des Etangs (2006) Lecavelier Des Etangs, A. 2006, A&A, 461, 1185
- Mandel & Agol (2002) Mandel, K., & Agol, E. 2002, ApJ, 580, L171
- Mandushev et al. (2007) Mandushev, G. et al. 2007, ApJ, 667, L195
- Mazeh et al. (2005) Mazeh, T., Zucker, S., & Pont, F. 2005, MNRAS, 356, 995
- Neuforge & Magain (1997) Neuforge-Verheecke, C., & Magain, P. 1997, A&A, 328, 261
- Nordström et al. (1994) Nordström, B., Latham, D. W., Morse, J. A., Milone, A. A. E., Kurucz, R. L., Andersen, J., & Stefanik, R. P. 1994, A&A, 287, 338
- O’Donovan et al. (2007) O’Donovan et al. 2007, ApJ, 663, L37
- Pace & Pasquini (2004) Pace, G., & Pasquini, L. 2004, A&A, 426, 1021
- Paulson et al. (2002) Paulson, D. B., Saar, S. H., Cochran, W. D., & Hatzes, A. P. 2002, AJ, 124, 572
- Pollack et al. (1996) Pollack, J. B., Hubickyj, O., Bodenheimer, P., Lissauer, J. J., Podolack, M., & Greenzweig, Y. 1996, Icarus, 124, 62
- Queloz et al. (2000) Queloz, D., Eggenberger, A., Mayor, M., Perrier, C., Beuzit, J. L., Naef, D., Sivan, J. P., & Udry, S. 2000, A&A, 359, L13
- Ramírez & Meléndez (2005) Ramírez, I., & Meléndez, J. 2005, ApJ, 626, 465
- Randich et al. (2006) Randich, S., Sestito, P., Primas, F., Pallavicini, R., & Pasquini, L. 2006, A&A, 450, 557
- Reddy et al. (2002) Reddy, B. E., Lambert, D. L., Laws, C., Gonzalez, G., & Covey, K. 2002, MNRAS, 335, 1005
- Saar et al. (1998) Saar, S. H., Butler, R. P., & Marcy, G. W. 1998, AJ, 498, L153
- Santos et al. (2000) Santos, N. C., Mayor, M., Naef, D., Pepe, F., Queloz, D., Udry, S., & Blecha, A. 2000, A&A, 361, 265
- Santos et al. (2004) Santos, N. C., Israelian, G., & Mayor, M. 2004, A&A, 415, 1153
- Santos et al. (2006) Santos, N. C., Ecuvillon, A., Israelian, G., Mayor, M., Melo, C., Queloz, D., Udry, S., Ribeiro, J. P., & Jorge, S. 2006, A&A, 458, 997
- Schlegel et al. (1998) Schlegel, D. J., Finkbeiner, D. P., & Davis, M. 1998, ApJ, 500, 525
- Sestito & Randich (2005) Sestito, P., & Randich, S. 2005, A&A, 442, 615
- Sestito et al. (2006) Sestito, P.; Degl’Innocenti, S.; Prada Moroni, P. G., & Randich, S. 2006, A&A, 454, 311
- Sneden (1973) Sneden, C. A. 1973, Ph.D. Thesis, The University of Texas at Austin
- Song et al. (2004) Song, I., Zuckerman, B., & Bessell, M. S. 2004, ApJ, 614, L125
- Sozzetti et al. (2004) Sozzetti, A., Yong, D., Torres, G., Charbonneau, D., Latham, D. W., Allende Prieto, C., Brown, T. M., Carney, B. W., & Laird, J. B. 2004, ApJ, 616, L167
- Sozzetti et al. (2007) Sozzetti, A., Torres, G., Charbonneau, D., Latham, D. W., Holman, M. J., Winn, J. N., Laird, J. B., & O’Donovan, F. T. 2007, ApJ, 664, 1190
- Sousa et al. (2007) Sousa, S. G., Santos, N. C., Israelian, G., Mayor, M., & Monteiro, M. J. P. F. G. 2007, A&A, 469, 783
- Southworth (2008) Southworh, J. 2008, MNRAS, 386, 1644
- Steffen & Agol (2005) Steffen, J. H., & Agol, E. 2005, MNRAS, 364, L96
- Tinetti et al. (2007) Tinetti, G., et al. 2007, Nature, 448, 169
- Torres et al. (2002) Torres, G., Neuhäuser, R., & Guenther, E. W. 2002, AJ, 123, 1701
- Torres et al. (2008) Torres, G., Winn, J. N., & Holman, M. J. 2008, ApJ, in press (arXiv:0801.1841)
- Vogt et al. (1994) Vogt, S. S., et al., 1994, in Instrumentation in Astronomy VIII, D. L. Crawford & E. R. Craine eds., Proc. SPIE, 2198, 362
- Winn & Holman (2005) Winn, J. N., & Holman, M. J. 2005, ApJ, 628, L159
- Winn et al. (2007) Winn, J. N., Holman, M. J., & Fuentes, C. I. 2007, AJ, 133, 11
- Winn et al. (2008a) Winn, J. N., Holman, M. J., Shporer, A., Fernández, J., Mazeh, T., Latham, D. W., Charbonneau, D., & Everett, M. E. 2008a, AJ, 136, 267
- Winn et al. (2008b) Winn, J. N., et al. 2008b, ApJ in press (arXiv:0804.4475)
- Wright et al. (2004) Wright, J. T., Marcy, G. W., Butler, R. P., & Vogt, S. S. 2004, ApJS, 152, 261
- Wright (2005) Wright, J. T. 2005, PASP, 117, 657
- Yi et al. (2001) Yi, S. K., Demarque, P., Kim, Y.-C., Lee, Y.-W., Ree, C. H., Lejeune, T., & Barnes, S. 2001, ApJS, 136, 417
- Zacharias et al. (2004) Zacharias, N., Urban, S. E., Zacharias, M. I., Wycoff, G. L., Hall, D. M., Monet, D. G., & Rafferty T. J. 2004, AJ, 127, 3043
| Radial Velocity | ||
|---|---|---|
| BJD2,400,000 | (m s-1) | (m s-1) |
| 54187.04136 | 176.0 | 8.2 |
| 54187.13832 | 99.4 | 10.7 |
| 54188.02349 | 189.5 | 11.2 |
| 54188.12067 | 292.4 | 13.3 |
| 54189.01696 | 331.6 | 5.5 |
| 54189.09680 | 246.4 | 11.4 |
| 54189.14038 | 195.8 | 7.3 |
| 54288.85394 | 241.6 | 7.8 |
| 54288.98956 | 116.7 | 11.5 |
| 54289.82337 | 5.9 | 10.8 |
| 54372.86102 | 335.9 | 9.5 |
| UT Date | Filter | Observatory | Cadence (min) | OOT RMS | Res RMS | |
|---|---|---|---|---|---|---|
| TrES-3 | ||||||
| 2007-03-25 | FLWO | 1.73 | 0.0012 | 0.0011 | 1.17 | |
| 2007-04-08 | FTN | 1.15 | 0.0011 | 0.0014 | 1.46 | |
| 2007-04-24 | OT | 1.34 | 0.0016 | 0.0016 | 1.30 | |
| 2007-04-25 | FLWO | 0.98 | 0.0014 | 0.0015 | 1.16 | |
| 2008-03-09 | FLWO | 0.73 | 0.0018 | 0.0016 | 1.00 | |
| 2008-03-27 | FLWO | 0.73 | 0.0014 | 0.0014 | 1.07 | |
| 2008-04-12 | FLWO | 1.05 | 0.0015 | 0.0015 | 1.02 | |
| 2008-05-08 | FLWO | 0.73 | 0.0021 | 0.0020 | 1.16 | |
| TrES-4 | ||||||
| 2007-05-03 | FLWO | 0.73 | 0.0015 | 0.0016 | 1.26 | |
| 2007-05-10 | FLWO | 0.73 | 0.0019 | 0.0017 | 1.23 | |
| 2007-05-10 | Lowell | 1.54 | 0.0015 | 0.0015 | 1.22 | |
Note. — Column 4 gives the median spacing between exposures, in minutes. Column 5 gives the out-of-transit root-mean-squared relative flux. Column 6 gives the residual RMS relative flux after subtracting the best-fitting model. Column 7 gives the scaling factor that was applied to the single-point flux uncertainties to account for red noise (see § 2.2).
| HJD | Relative flux | Uncertainty |
|---|---|---|
| band (FLWO 1.2-m) | ||
| 2454185.850884 | 0.99965 | 0.00115 |
| 2454185.853303 | 0.99948 | 0.00115 |
| 2454185.854495 | 0.99852 | 0.00115 |
| band (FTN 2.0-m) | ||
| 2454198.948010 | 0.99987 | 0.00109 |
| 2454198.948809 | 1.00054 | 0.00109 |
| 2454198.949606 | 0.99878 | 0.00109 |
| band (OT 0.8-m) | ||
| 2454214.574418 | 1.00159 | 0.00157 |
| 2454214.575348 | 1.00247 | 0.00157 |
| 2454214.576280 | 0.99766 | 0.00157 |
| band (FLWO 1.2-m) | ||
| 2454215.850393 | 0.99951 | 0.00150 |
| 2454215.851076 | 0.99912 | 0.00150 |
| 2454215.851771 | 0.99842 | 0.00150 |
| band (FLWO 1.2-m) | ||
| 2454535.897759 | 0.99906 | 0.00163 |
| 2454535.898268 | 0.99996 | 0.00163 |
| 2454535.898766 | 0.99755 | 0.00163 |
| band (FLWO 1.2-m) | ||
| 2454552.866642 | 0.99987 | 0.00135 |
| 2454552.867140 | 1.00181 | 0.00135 |
| 2454552.867638 | 1.00086 | 0.00135 |
| band (FLWO 1.2-m) | ||
| 2454569.875280 | 1.00116 | 0.00149 |
| 2454569.875778 | 0.99975 | 0.00149 |
| 2454569.876287 | 1.00090 | 0.00149 |
| band (FLWO 1.2-m) | ||
| 2454594.713269 | 1.00015 | 0.00204 |
| 2454594.713778 | 0.99628 | 0.00204 |
| 2454594.714276 | 1.00394 | 0.00204 |
Note. — The time stamps represent the Heliocentric Julian Date at the time of mid-exposure. The data have been corrected for residual extinction effects, and the uncertainties have been rescaled as described in § 2. We intend for this table to appear in its entirety in the electronic version of the journal. A portion is shown here to illustrate its format. The data are also available from the authors upon request.
| HJD | Relative flux | Uncertainty |
|---|---|---|
| band (FLWO 1.2-m) | ||
| 2454223.741853 | 0.99446 | 0.00160 |
| 2454223.745823 | 0.99218 | 0.00160 |
| 2454223.746321 | 0.99209 | 0.00160 |
| band (FLWO 1.2-m) | ||
| 2454230.705029 | 0.99892 | 0.00170 |
| 2454230.705550 | 1.00057 | 0.00170 |
| 2454230.706059 | 0.99974 | 0.00170 |
| band (Lowell 0.8-m) | ||
| 2454230.770620 | 0.99944 | 0.00150 |
| 2454230.773240 | 0.99791 | 0.00150 |
| 2454230.774280 | 0.99852 | 0.00150 |
Note. — The time stamps represent the Heliocentric Julian Date at the time of mid-exposure. The data have been corrected for residual extinction effects, and the uncertainties have been rescaled as described in § 2. We intend for this table to appear in its entirety in the electronic version of the journal. A portion is shown here to illustrate its format. The data are also available from the authors upon request.
| Filter | Linear coefficient | Quadratic coefficient |
|---|---|---|
| TrES-3 | ||
| 0.6379 | 0.1792 | |
| 0.4378 | 0.2933 | |
| 0.5535 | 0.2351 | |
| 0.3643 | 0.3178 | |
| 0.2777 | 0.3191 | |
| 0.2179 | 0.3162 | |
| TrES-4 | ||
| 0.1483 | 0.3600 | |
| 0.5377 | 0.2579 | |
Note. — The assumed limb-darkening law was .
| HJD | Uncertainty (days) | Epoch |
|---|---|---|
| TrES-3 | ||
| 2454185.910430 | 0.000198 | 0 |
| 2454198.973147 | 0.000223 | 10 |
| 2454214.646298 | 0.000280 | 22 |
| 2454215.952080 | 0.000214 | 23 |
| 2454535.968246 | 0.000166 | 268 |
| 2454552.948971 | 0.000147 | 281 |
| 2454569.929089 | 0.000153 | 294 |
| 2454594.745943 | 0.000253 | 313 |
| TrES-4 | ||
| 2454223.797215 | 0.000847 | 0 |
| 2454230.904913 | 0.000656 | 7 |
| 2454230.905624 | 0.001106 | 7 |
| Parameter | Value |
|---|---|
| (K)aaDetermined spectroscopically. | 5650 75 |
| aaDetermined spectroscopically. | 4.4 0.1 |
| bbInferred from stellar evolution models using observational constraints (see text). | |
| (km s-1)aaDetermined spectroscopically. | 1.5 1.0 |
| (km s-1)aaDetermined spectroscopically. | 0.85 0.1 |
| Fe/HaaDetermined spectroscopically. | 0.19 0.08 |
| aaDetermined spectroscopically. | |
| aaDetermined spectroscopically. | |
| (g cm-3)ccDerived observationally. | |
| ()bbInferred from stellar evolution models using observational constraints (see text). | |
| ()bbInferred from stellar evolution models using observational constraints (see text). | |
| Age (Gyr)bbInferred from stellar evolution models using observational constraints (see text). | |
| ()bbInferred from stellar evolution models using observational constraints (see text). | |
| (mag)bbInferred from stellar evolution models using observational constraints (see text). | |
| Distance (pc)bbInferred from stellar evolution models using observational constraints (see text). | |
| , , (km s-1)bbInferred from stellar evolution models using observational constraints (see text). | [+27.3, +6.7, +33.0] |
Note. — The value adopted for the solar abundance of iron is
| Parameter | Value |
|---|---|
| (K)aaDetermined spectroscopically. | 6200 75 |
| aaDetermined spectroscopically. | 4.0 0.1 |
| bbInferred from stellar evolution models using observational constraints (see text). | |
| (km s-1)aaDetermined spectroscopically. | 8.5 0.5 |
| (km s-1)aaDetermined spectroscopically. | 1.50 0.05 |
| Fe/HaaDetermined spectroscopically. | +0.14 0.09 |
| aaDetermined spectroscopically. | |
| aaDetermined spectroscopically. | |
| (g cm-3)ccDerived observationally. | |
| ()bbInferred from stellar evolution models using observational constraints (see text). | |
| ()bbInferred from stellar evolution models using observational constraints (see text). | |
| Age (Gyr)bbInferred from stellar evolution models using observational constraints (see text). | |
| ()bbInferred from stellar evolution models using observational constraints (see text). | |
| (mag)bbInferred from stellar evolution models using observational constraints (see text). | |
| Distance (pc)bbInferred from stellar evolution models using observational constraints (see text). | |
| , , (km s-1)bbInferred from stellar evolution models using observational constraints (see text). | [43.9, 39.1, 6.9] |
Note. — The value adopted for the solar abundance of iron is
| Parameter | Value |
|---|---|
| Light curve parameters | |
| (days) | 1.30618581 (fixed) |
| (HJD) | 2,454,185.9104 (fixed) |
| (deg) | |
| Spectroscopic parameters | |
| () | |
| aa is the center-of-mass velocity for the Keck relative velocities () | |
| 0 (fixed) | |
| () | |
| rms () | 22.0 |
| Planet parameters | |
| () | |
| (bbThe equatorial radius of Jupiter at 1 bar is 71,492 km.) | |
| () | |
| (AU) | |
| (cgs) | |
| Parameter | Value |
|---|---|
| Light curve parameters | |
| (days) | 3.553945 (fixed) |
| (HJD) | 2,454,230.9053 (fixed) |
| (deg) | |
| Spectroscopic parameters | |
| () | |
| aa is the center-of-mass velocity for the Keck relative velocities () | |
| 0 (fixed) | |
| () | |
| rms () | 11.1 |
| Planet parameters | |
| () | |
| (bbThe equatorial radius of Jupiter at 1 bar is 71,492 km.) | |
| () | |
| (AU) | |
| (cgs) | |