1 –3
Turbulence: A Probe of the Dynamics and Physics of the Magellanic Stream
Abstract
A recent paper by Stanimirović et al. (2008) presents quit interesting results from HI observations of the Magellanic Stream (MS) tip. The high spatial resolution of the data reveals rich and complex morphological and kinematic structures; notably four coherent substreams extending over angular size of about were found.
We suggest to use the data to search for the existence of an underlying turbulence in the residuals of velocity fields. If existent, a turbulence would provide a dynamical evidence ,that the sub streams are cohorent structures. The characteristics of the turbulence could yield information about the energy source, as well as about the physical parameters of the gas in these streams.
We use the position-velocity images of Stanimirović et al. (2008) to derive spatial power spectra for the velocity residuals. These, indicate the presence of a large scale turbulence with size comparable to that of the streams themselves. The turbulent velocity on the largest scale is estimated to be about . Adopting, a distance of , implies a turbulent largest scale of and timescale for decay of about .
For a turbulence with scale that large, the natural energy source is the tidal interaction between the Magellanic Clouds, and between them and the Milky Way galaxy. The estimated turbulent timescale for decay is consistent with this mechanism. Such a mechanism has been suggested for the turbulence in the ISM of the SMC by Goldman (2000, 2007). In effect, the turbulence is a fossil from the era of the streams formation.
The shape of derived turbulence spectrum is used here to obtain constraints on the inclination of the streams and on the density of the emitting neutral hydrogen.
keywords:
galaxies: general, galaxies: individual (Magellanic clouds), galaxies: kinematics and dynamics, turbulence,ISM: kinematics and dynamics .1 Introduction
In a recent paper Stanimirović et al. (2008) present quit interesting results from HI observations of the tip of the Magellanic Stream (MS) . The high spatial resolution of the data obtained by Stanimirović et al. (2008), reveals rich and complex morphological and kinematic structures. The authors find four coherent substreams in the tip of the MS extending over projected angular size of about . Three of the these streams (S2, S3, S4) originate from about the same location and are clumpy. The remaining, S1 stream, seems more diffuse and doesn’t share the common location of the former streams. In all streams, the kinematic data show large scale velocity gradients of .
By comparing the observations to the simulations of Connors et al. (2006), Stanimirović et al. (2008), interpret the three former streams to be the result of the tidal splitting of the main MS by tidal interaction of the LMC and the MS about 1.05 Gyr and 0.55 Gyr ago. In this picture, the MS stream itself was formed about 1.5 Gyr ago by close tidal encounter of the SMC, LMC and the Milky Way (MW).
The S1 sub-stream, is interpreted to have formed much more recently, about 0.2 Gyr ago, and consists of gas drawn from the Magellanic Bridge. Contrary to the former three streams, it had not enough time to cool and fragment.
2 Present Work
The tidal interactions assumed to create the streams, generate large scale shear flows, as indeed is evident in the data of Stanimirović et al. (2008). These, in turn, are bound to create turbulence in the ISM by several instabilities. Turbulence can be created also by shocks via the Richtmeir-Meshkov instability. The ultimate energy source for all these instabilities are the tidal interactions. The result is a large scale turbulence of size comparable to the entire size of the system. Furtheremore, if the decay time of the turbulence turns out to exceed the age of the system, the turbulence can serve as a ”fossil evidence” that can supply valuable information. For more details on these issues see Goldman (2000, 2007).
In the present work we analyze the position-velocity images along the streams, derived by Stanimirović et al. (2008). For each stream, we fitted a mean velocity field consisting of a constant plus a gradient. This mean velocity field was substracted from the observed velocity, yielding the residual velocity field, as function of projected angle.
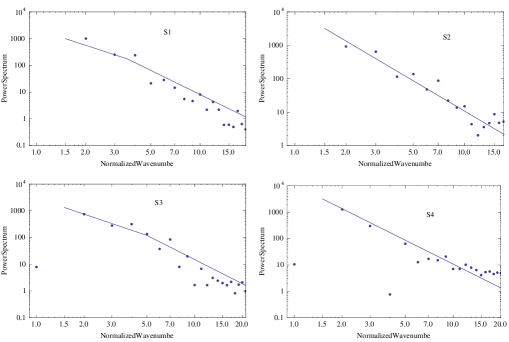
We derived the spatial power spectrum for the residual velocity field of each stream. The results are shown in Figure 1. The power spectrum for each stream is a power law that indicates the presence of an underlying statistical order that reflects correlations between the fluctuations on different scales. Such a power law is a signature of the inertial range of wavenumbers of a turbulent velocity field.
The turbulence for all streams encompasses the total extent of the the stream. Such a large scale turbulence can not be generated by a localized source such as supernovae winds. A large scale source with scale at least at that of the stream is required. Tidal interactions is the natural candidate.
The residual velocity fields originate from integration along the line of sight. For scales in the plane of the sky, that are large compared to the depth along the line of sight, the index of the power spectrum power law, equals the index of the turbulent energy spectral function. For scales in the plane of the sky, that are small compared to the depth along the line of sight, the index of the power spectrum power law, equals the index of the turbulent energy spectral function minus 1.
For S2 and S4, the power spectrum can be fitted by a single power law with index . This corresponds to a turbulence energy spectral function which is the inertial range for compressible turbulence, when the depth over which the velocity was integrated, is larger than the scale in the plane of the sky.
For S1 and S3 there is an indication that the power spectrum changes from a power law with index to a power law with index at a relative wavenumber of . This implies that the depth of these streams is about . The r.m.s turbulent velocity for all the streams is similar: namely mildly supersonic. This is consistent with the index of the turbulence energy spectral function.
3 Discussion
The main results of the present work are:
-
1.
Each of the streams exhibits a large scale turbulence comparable to the size of the stream. This provides dynamical proof that the streams are coherent structures, as stated in Stanimirović et al. (2008).
-
2.
For an assumed distance of 120 kpc to the MS tip, the projected size of the stream and the largest turbulence scale is kpc.
-
3.
The turbulent r.m.s velocity on the largest scale is about , namely mildly supersonic. This is in line with the inertial range index of the turbulent spectral energy function being instead of the Kolmogorov value , appropriate for subsonic turbulence.
-
4.
The resulting timescale for decay of the turbulence is about 3 Gyr and is longer than the age of the MS, thus providing ”fossil evidence”.
-
5.
The fact that a break in the power spectrum is evident in S1, and even more so in S3 indicates that the inclination angle of these stream, with respect to the line of sight is not large; they are viewed almost face-on.
-
6.
The absence of a clear break in the power spectra of S2 and S4, suggest that their inclination is larger. Taking the absence of the break to imply that the projected depth is larger than about and assuming that the true depth is , as deduced for S2 and S4, results in an inclination of . From Fig. 6 of Connors et al. (2006) one can deduce a similar inclination at the tip of the MS.
-
7.
A depth of at a distance of 120 kpc corresponds to a physical depth of a 8 kpc. For column densities in the range this implies a depth-averaged density of the warm neutral medium: .
Acknowledgements.
I would like to thank the conference organizers and the IAU for an IAU award.References
- Connors, Kawata, & Gibson (2006) Connors T. W., Kawata D., Gibson B. K., 2006,textit MNRAS, 371, 108
- (2) Goldman, I. 2000. ApJ, 541, 701
- Goldman (2007) Goldman, I. 2007, IAU Symposium, 237, 96
- Stanimirović et al. (2008) Stanimirović, S., Hoffman, S., Heiles, C., Douglas, K. A., Putman, M., & Peek, J. E. G. 2008, ApJ, 680, 276