Experimental magnetic form factors in Co3V2O8: A combined study of ab initio calculations, magnetic Compton scattering and polarized neutron diffraction
Abstract
We present a combination of ab initio calculations, magnetic Compton scattering and polarized neutron experiments, which elucidate the density distribution of unpaired electrons in the kagome staircase system Co3V2O8. Ab initio wave functions were used to calculate the spin densities in real and momentum space, which show good agreement with the respective experiments. It has been found that the spin polarized orbitals are equally distributed between the and the levels for the spine (s) Co ions, while the orbitals of the cross-tie (c) Co ions only represent 30% of the atomic spin density. Furthermore, the results reveal that the magnetic moments of the cross-tie Co ions, which are significantly smaller than those of the spine Co ions in the zero-field ferromagnetic structure, do not saturate by applying an external magnetic field of 2 T along the easy axis a, but that the increasing bulk magnetization originates from induced magnetic moments on the O and V sites. The refined individual magnetic moments are (Coc)=1.54(4) , (Cos)=2.87(3) , (V)=0.41(4) , (O1)=0.05(5) , (O2)=0.35(5) and (O3)=0.36(5) combining to the same macroscopic magnetization value, which was previously only attributed to the Co ions.
pacs:
75.25.+z; 75.30.Et; 75.30.GwI Introduction
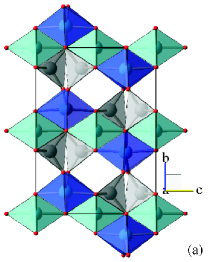
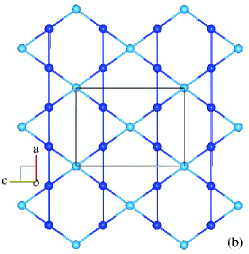
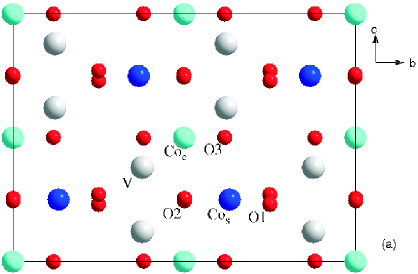
Co3V2O8 represents the 3d transition metal ortho-oxo-vanadates labeled as kagome staircase structures and crystallizes in the orthorhombic space group Cmca.Fuess et al. (1970); Sauerbrei et al. (1973) Its crystallographic structure is characterized by edge-sharing CoO6 octahedra forming buckled layers of corner-sharing triangles, the kagome staircases, which are separated along the b axis by VO4 tetrahedra (Fig. 1).
The magnetic exchange is effectuated by a 90∘ Co-O-Co intralayer pathway. Interestingly, this system exhibits a sequence of five magnetic phase transitions featuring temperature dependent incommensurate antiferromagnetic phases with commensurate lock-ins and a ferromagnetic ground state, where all magnetic structures are collinear along the a axis.Chen et al. (2006) The ferromagnetic structure reveals two strongly different magnetic moments for the cross-tie Co ions (4a site) and spine Co ions (8e site) of 1.54 and 2.73 ,Chen et al. (2006) respectively, despite the fact that both Co2+ ions apparently present high-spin configurations as macroscopic measurements exhibit saturation of the cross-tie moments.Wilson et al. (2007) In the kagome staircase structure several nearest and next-nearest neighbor exchange interaction pathways are possible,Chen et al. (2006) which is the motivation for this study. Investigating the magnetization density, which is reflected by the respective magnetic form factors of the ions, may reveal preferred exchange pathways with the presence of magnetization on the involved O sites. Eventual induced magnetization on the empty d-shell of V sites would allow interlayer coupling by super-superexchange. Therefore, magnetic Compton scattering and polarized neutron diffraction experiments have been carried out leading to the spin density in momentum space and the magnetization density in real space, respectively. However, detailed and precise analysis of these quantities are required in order to determine the exact contribution of the atomic species involved in the studied system. Quantum chemical modeling is therefore needed to gain insights, at a molecular level, into the electronic structure of the two cobalt-oxide octahedra. In this context, ab initio cluster calculations were performed for the CocO6 and CosO6 octahedra yielding precise molecular orbitals (MO) and wave functions (wf). The latter were used to analyze the experimentally observed density distributions. The refinement of the contribution of each MO/wf, at a quantum chemical level, to the real and momentum space densities simultaneously is a powerful procedure allowing interesting and valuable features of the magnetic form factors to be determined.
II Ab initio calculations
The two different clusters CocO6 and CosO6 were modelled separately. The calculations were performed within the framework of the Kohn-Sham formulation of the density functional theory using the PC GAMESS program.Nemukhin et al. (2004) The functional B3LYP was employed to approximate the exchange-correlation interaction. The B3LYP is a hybrid functional, well adapted to study transition metal compounds and magnetic interactions, in which a predefined amount of the exact Hartree-Fock exchange is added to the well known pure density functionals.Becke (1993); Lee et al. (1988); Miehlich et al. (1989); Stephens et al. (1994) The atoms in the cluster were described using Ahlrich’s pVDZ atomic orbital (AO) basis setSchäfer et al. (1992) Co(14s,8p,5d,1p)/[5s,2p,2d,1p],O(7s,4p,1d)/[3s,2p,1d]. The notations (klm) and [klm] indicate the number of Gaussian type orbitals and contracted Gaussian type orbitals, respectively. In order to mimic the Madelung potential, the two quantum mechanical clusters were surrounded by point charges (PC) according to the Effective Fragment Potential method.Gordon et al. (2001) As previously reported for other systems,Radzhabov and Kirm (2005); Pascual et al. (2006); Barandiarán and Seijo (1988); Pascual et al. (1993) the choice of the embedding method was shown to be crucial for the physical meaning of the ab initio calculations. To avoid the electron density leaking out of the cluster, a boundary region has been introduced, which is formed by effective core potentials (ECP) placed in the nearest cationic positions around the cluster. Thus, the first coordination shell of Co2+ and V5+ ions has been described by ECPs according to the SBKJC ECP basis set.Stevens and Krauss (1992) As native ECPs for Co and V do not treat the 3s and 3p electrons as core electrons, those ECPs would in fact be too compact due to the higher number of valence electrons. In order to overcome this problem the ECPs for Mg and Al have been used due to the fact that their ionic radii are closer to those of Co and V, respectively. Except for the 3d shells, the remaining electrons are replaced by an effective potential. Thus, 1565 PC (3x3x3 unit cells with the respective Co ion in the center) have been built to mimic the Madelung potential on the cluster. The MO coefficients relevant to the Co3d were extracted from the simulations and used to model the Magnetic Compton Profiles (MCP) and the magnetic form factors.
III Experimental
III.1 Unpolarized neutron diffraction
Co3V2O8 single crystals have been grown from self-flux in a ZrO2/Y crucible by the slow cooling method. Some of the crystals have been ground and investigated at the high-flux neutron powder diffractometer D20 (Institut Laue Langevin, Grenoble) confirming the absence of parasitic phases. The nuclear structure of a chosen single crystal has been studied at the four-circle diffractometer D9 (Institut Laue Langevin, Grenoble). A set of more than 500 independent reflections up to =0.92 has been measured using two different wavelengths in order to determine the extinction effects (=0.835 Å, =0.512 Å). The data collection has been performed in the paramagnetic phase at =13.5 K, which is just above the Néel temperature of 11.2 K. In order to reveal possible structural changes between the paramagnetic and the ferromagnetic phase due to structural phase transitions or magnetostriction an additional nuclear structure investigation has been carried out at the single crystal diffractometer D15 (Institut Laue Langevin, Grenoble) under the same experimental conditions as the polarized neutron diffraction experiment (Sec. III.2), i.e. at =3.5 K with an applied magnetic field of =2 T along the easy axis a and using a wavelength of =0.854 Å.
III.2 Polarized neutron diffraction (PND)
The real space magnetization density has been studied at the hot neutron spin polarized two-axes diffractometer 5C1 (Laboratoire Léon Brillouin, Saclay). Neutrons from the source are monochromated and polarized by the (111) reflection of a magnetized Heusler crystal Cu2MnAl. The wavelength is 0.84 Å, which corresponds to the maximum flux of the hot source and is ideal for studying large domains of reciprocal space. The polarization factor of the beam is . In order to fully magnetize the sample and avoid beam depolarization a magnetic field of =2 T has been applied along the easy axis a. The flipping ratios (Eq. 1), the ratios between the spin-up and spin-down intensities, of over 500 independent reflections with =0,1,2 have been measured in the ferromagnetic phase at =3.5 K.
| (1) |
and denote the magnetic and nuclear structure factors. = is a geometric factor with being the angle between the scattering vector and the magnetization vector. The parameters and are extinction correction factors of the respective cross-sections according to Ref. Bonnet et al., 1976.
III.3 X-ray magnetic Compton scattering (MCS)
The investigation of the spin density in momentum space has been carried out at the High Energy Inelastic Scattering beamline BL08W at SPring-8 in Hyogo, Japan. This beamline is designed for magnetic Compton scattering spectroscopy as it offers high energy elliptically polarized X-rays emitted from an Elliptic Multipole Wiggler. The incident photon beam with an energy range of 170-300 keV is monochromated and focused by an asymmetric Johann type monochromator using the Si (620) reflection. The sample magnetization is achieved with a superconducting magnet with a maximum field of 2.5 T and a minimum polarity-switching time of 5 seconds. The backscattered photon energy is analyzed by a 10-segmented Ge solid state detector positioned at a scattering angle of 178.4∘. The experiment has been carried out with an incident photon energy of 176.3 keV, which gives a good compromise between the beam intensity and the scattering cross section. The initial interest of applying this method to Co3V2O8 was to map the momentum space spin density of the ferromagnetic phase as a projection onto the b∗-c∗ plane in order to gather information about the 3d electron spin states and to correlate the results with those obtained from the polarized neutron diffraction experiment, but the experimental conditions and especially the large magnetic anisotropy of the system did not allow that. The minimal achievable sample temperature is approximately 5.6 K, i.e. close below the magnetic transition into the antiferromagnetic phase. It can be seen in the magnetic phase diagrams of Co3V2O8Qureshi et al. (2007); Wilson et al. (2007) that at this temperature already weak magnetic fields applied along the b or c axis induce a magnetic phase transition into the antiferromagnetic phase, while stabilizes the ferromagnetic one. The necessity of applying a magnetic field of considerable strength and therewith magnetizing the sample along the incident beam in order to increase the magnetic contribution to the scattering cross-section beside the requirement of turning the sample about a vertical axis to be able to reconstruct the two-dimensional momentum density, led to a change of strategy. To make sure not to induce magnetic phase transitions by rotating the sample with respect to the field direction the measurements have been carried out within the antiferromagnetic phase at =7.5 K and by applying a magnetic field of =2 T with the induced ferromagnetic component lying in the b-c plane. In addition to the trivial directions [010] and [001] four further directional MCPs in the - plane have been investigated. An additional profile has been measured along the [100] direction by decreasing the applied magnetic field to 0.25 T. A directional MCP yields the projection of the spin momentum space density onto the scattering vector, which is by definition :
| (2) |
with denoting the momentum wf of an occupied majority (minority) spin state. The Compton profiles of the respective sample magnetization states have been recorded for 60 seconds, repeating the cycle multiple times.
IV Results
IV.1 Nuclear structure and extinction
The nuclear structure investigation at 13.5 K on the four-circle
diffractometer D9 confirmed the correct phase formation of the
orthorhombic structure (space group Cmca) with =6.015(3) Å,
=11.480(5) Å and =8.289(4) Å. The observed integrated
intensities have been corrected for absorption by applying the
transmission factor integral and analyzed by simultaneously fitting a structure
model to both datasets with and using
FullProf.Rodríguez-Carvajal (1993) The refinement process included the atomic
positions and isotropic temperature factors of Co and O plus three
additional extinction parameters according to an anisotropic
Shelx-like empirical extinction correction.Larson (1970) The atomic
position and temperature factor of V have been fixed in all
refinements, because of its low coherent neutron scattering cross
section. The refined structural parameters (=5.3) are listed in
Tab.1.
| Atom | x | y | z | B(Å2) |
|---|---|---|---|---|
| Co1 | 0 | 0 | 0 | 0.27(10) |
| Co2 | 0.25 | 0.1328(7) | 0.25 | 0.20(7) |
| V | 0 | 0.3773 | 0.1204 | 0.30 |
| O1 | 0 | 0.2489(3) | 0.2700(4) | 0.38(4) |
| O2 | 0 | 0.0008(4) | 0.2448(4) | 0.33(4) |
| O3 | 0.2702(3) | 0.1185(3) | 0.9990(2) | 0.33(4) |
| Extinction parameters | ||||
| =1.0(1) =0.36(5) =0.6(1) | ||||
In order to analyze the nuclear structure under identical conditions as the flipping ratio measurement (=3.5 K, =2 T), only those reflections have been measured for which the ratio between the magnetic and the nuclear structure factor has been derived from the observed flipping ratios. The ferromagnetic contribution to the integrated intensity has been canceled out according to
| (3) |
where is the magnetic interaction vector. The
subsequent refinement showed that no considerable change in the
nuclear structure has taken place, i.e. the derivation of the
from observed flipping ratios by using the observed at
K is justified.
All low-angle nuclear reflections suffer considerably from extinction, therefore, special attention has been paid to the extinction of magnetic scattering. As the flipping ratio treatment uses the same extinction parameters for both nuclear and magnetic scattering, it is important to verify, if the extinction effects are indeed comparable. Therefore, three strong magnetic reflections have been measured as a function of applied magnetic field after the sample has been cooled in zero-field to 3.5 K. Fig. 2 shows the integrated intensities of three reflections after the nuclear contribution has been subtracted. The field dependence of the magnetic contribution reveals a surprising and interesting tendency: Instead of increasing with increasing applied field, as one would expect if the cross-tie moments get saturated, the intensity of magnetic scattering drops significantly.
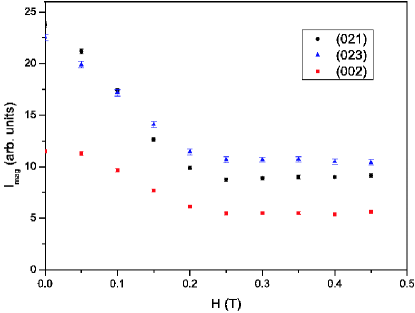
This observation can be explained with field dependent increase of primary extinction. At =0 T the sample exhibits a multidomain state with presumably negligible extinction effects. By increasing the field the magnetic domains grow until they reach approximately the size of the structural domains. On reaching saturation at 0.25 T the primary extinction effects for magnetic scattering should be comparable to those of nuclear scattering. The mosaicity which governs secondary extinction should a priori not be affected. In order to verify these assumptions the extinction correction factor has been calculated for three magnetic reflections using the refined extinction parameters from the nuclear structure refinement according to the anisotropic FullProf model:
| (4) |
The calculated values have been compared with the observed ones, which can easily be deduced from the intensity ratios at =0 T and =0.25 T. The results are listed in Tab. 2. It can be seen that the calculated extinction factors are to a greater or lesser extent comparable with the observed ones. Nevertheless, the extinction of magnetic scattering seems to be underestimated.
| (hkl) | (Å-1) | (10-12 cm) | ||
|---|---|---|---|---|
| (021) | 0.10595 | 4.87(1) | 0.39(7) | 0.46(3) |
| (002) | 0.12064 | 3.39(1) | 0.47(6) | 0.64(3) |
| (023) | 0.20083 | 4.72(1) | 0.47(6) | 0.60(3) |
IV.2 Real space magnetization density
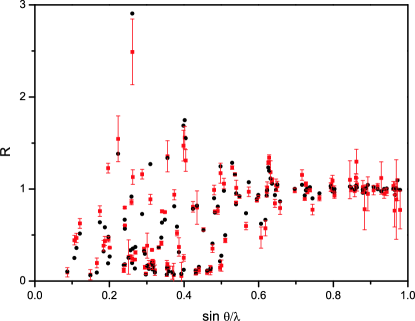
The nuclear structure factors, which have been deduced from the unpolarized neutron experiments, have been used to derive the magnetic structure factors from the observed flipping ratios by solving Eq. 1 with respect to . The individual observed and calculated flipping ratios are shown in Fig. 3 as a function of .
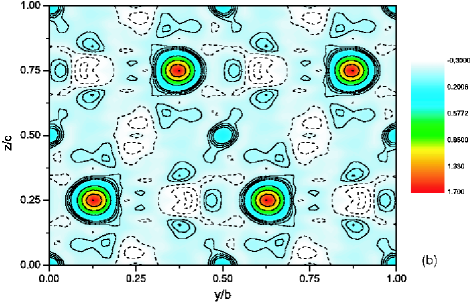
As the crystal structure is centrosymmetric the experimental magnetization density can directly be reconstructed by a Fourier synthesis. Fig. 4(b) shows the projection of the observed magnetization density onto the b-c plane, while Fig. 4(a) depicts the unit cell viewed along the a axis in order to assign the density peaks to the respective atoms. As it has been assumed in the previous section, the Coc moments do not get saturated, but significant magnetization density is present on V and O sites. While the density is quite localized for the V, O1 and O2 sites, rather diffuse density can be observed around the O3 site. The split density peaks of O1 result from the fact, that actually two O1 ions are visible in the projection. Similarly, the density around the Cos ions seems to be much higher compared to the Coc ions, which is due to the fact, that two Cos ions are contained in the projection, while only one Coc ion is projected. Besides the superexchange pathways Cos-O2-Coc and Cos-O3-Coc an interlayer exchange becomes evident with the non-zero magnetization density of V and O1. Further ab initio solid state computations are currently being performed to simulate the spin density map of Co3V2O8 and to elucidate the composite mechanisms of the induced magnetic moments on the different O and V sites. This will be the subject of a forthcoming publication.Zbiri et al. (2008)
IV.3 Momentum space density
The MCPs were extracted by taking the difference of the scattered
intensities and of the respective charge Compton
profiles. Due to the fact that the more intense charge Compton
profiles still exhibit relatively large values at the outermost
measured positions of a.u. (atomic units), the actual
number of electrons between -10 a.u. and +10 a.u. is evaluated from
the profiles interpolated using tabulated data for the elements
resulting from Hartree-Fock calculations.Biggs et al. (1975) Before
summing up the magnetic intensity of each detector cell, the data
have been corrected for the detector cell efficiency, sample
absorption and scattering cross-section according to
Ref. Żukowski, 2004. Furthermore, the energy scale of each
detector cell has been calibrated by measuring a radioactive sample
with well known emission energies.
The experimental MCPs were folded at =0 to increase statistical accuracy by taking the average of
each branch. The area under each profile has been normalized to the
number of magnetic electrons per formula unit. With the use of iron
standards the induced ferromagnetic component can be deduced from
the magnetic effect, which is the relative contribution of the MCP
to the total Compton profile
| (5) |
The magnetic effects of the respective directional MCPs are listed in Tab. 3 with their corresponding ferromagnetic components induced parallel to the scattering vector. In the - plane the spin moments monotonically decrease with increasing angle between the magnetic field direction and the direction, which directly reveals the magnetic anisotropy with b being the hard axis of this system.Balakrishnan et al. (2004); Wilson et al. (2007) Effective beam path length dependent multiple scattering effects due to the rotation of the sample are estimated to be less than a few percent of the spin values given in Tab. 3.
| MCP | (∘) | (%) | S () | |
|---|---|---|---|---|
| 0 | 2 | 0.541 | 0.616 | |
| 17 | 2 | 0.488 | 0.556 | |
| 34.7 | 2 | 0.415 | 0.472 | |
| 54.1 | 2 | 0.274 | 0.312 | |
| 64.3 | 2 | 0.229 | 0.261 | |
| 90 | 2 | 0.095 | 0.108 | |
| 90 | 0.25 | 0.251 | 0.287 |
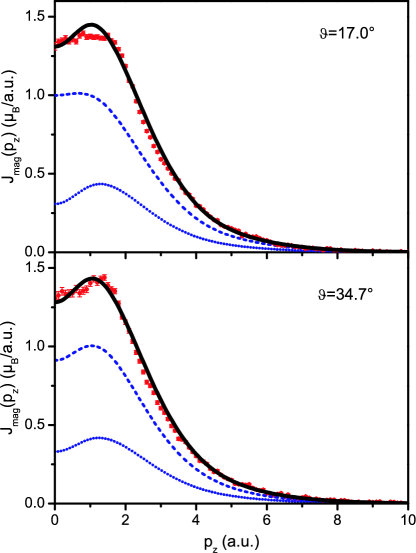
Fig. 5 shows the normalized observed MCPs, which reveal similar shapes for the seven investigated crystallographic directions.

Using all profiles except the one along the [100] direction the two-dimensional momentum spin density in the - plane has been reconstructed by the direct Fourier-transform method.Suzuki et al. (1989); Tanaka et al. (2001) The calculation has been performed on a grid with a distance of 0.1 a.u. between each point. The result is shown as a two-dimensional contour plot in Fig. 6(a).
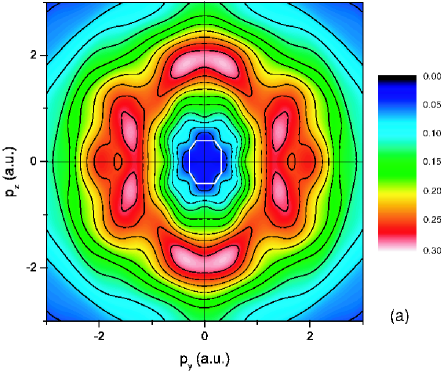
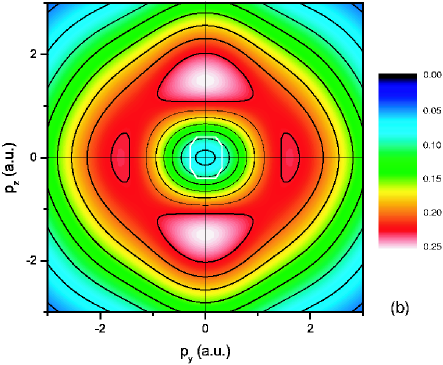
Low spin density can be recognized inside the first Brillouin zone (BZ), which extends beyond its border along the 010 and 001 directions. In the vicinity of the first BZ border the density increases more rapidly with increasing momentum along 021. Peaks are present at = and .
IV.4 Correlated refinement in both spaces
The idea behind correlating the density distributions in real and momentum space is that the population of each spin polarized orbital must be represented likewise in the observed densities in both spaces. The fact that the MCS method only samples the spin part and the PND method both the spin and the orbital part of the magnetic moment has been handled in the following way. As the observed MCPs have been normalized, the area under each profile corresponding to the size of the spin moment is not refined. The refined parameters were the populations of each spin polarized orbital (in correlation with the real space quantities), thus only the shape of each profile is refined. The refined magnetic moments stem solely from the PND data. In order to analyze the observed MCPs theoretical ones have been calculated by projecting the square of the ab initio wf onto the respective scattering vector. Thereby the symmetry relations between the different cluster density distributions in the unit cell have to be taken into account, which yields two and four symmetrically inequivalent CocO6 and CosO6 clusters, respectively (Tab. 4).
| cluster | Co position | symmetry relation to c1/s1 |
|---|---|---|
The point symmetries of the CocO6 and CosO6 clusters are and ,Hahn (1983) which correspond to and in momentum space. Due to the special symmetry of the CosO6 density, the projections of the different clusters in momentum space are invariant for the principal axes and those in the - plane. In the case of the CocO6 clusters, the projections onto non-principal axes in the - yield different profiles, which need to be averaged. The projected orbitals have been convoluted with a Gaussian function having a full width at half maximum of the instrumental resolution. As reported previouslyKoizumi et al. (2001) the fact that the projection of each MO in momentum space has a characteristic shape makes it possible to refine its population which is the contribution to the observed MCP:
| (6) |
Here, denotes a momentum space MO/wf. Similarly, the populations of the real space MOs can be used to deduce the magnetic form factors of the respective elements by calculating the Fourier transform of the atomic spin density:
| (7) |
where defines the real space MO only including the atomic orbitals of element =Co, O. With this procedure the observed flipping ratios can be refined based on a simple aspheric magnetic form factor model deduced from ab initio wf. For the V ions the analytic approximation of the V4+ form factorLisher and Forsyth (1971) has been used. Refining the population parameters for each MCP individually yields excellent agreement with the observed profiles. But since the refinement process exhibits numerous local minima with significantly varying results, it has been considered more reasonable to include all MCPs in the refinement despite the magnetic anisotropy. The respective population parameters have been refined simultaneously in both spaces together with the magnetic moments of Co, V and O by minimizing the function
| (8) |
with and defining discrete data points of the PND and MCS experiment, respectively, and referring to the respective MCPs. The refinement yields fairly good agreement expressed by =5.7 and =9.6 for the respective experiments. The refined total magnetic moments along the a axis are
Summing the magnetic moments of all ions in the unit cell weighted by their site multiplicity and dividing by the number of Co ions yields an averaged magnetization of 3.45 /Co2+. This value shows excellent agreement with the macroscopic magnetization for T along the a axis reported in Ref. Wilson et al., 2007. The resulting relative orbital populations are listed in Tab. 5. The refined parameters were used to calculate the MCPs, which are depicted as solid lines in Fig. 5. Fig. 7 shows that the line shapes of the two respective contributing parts (CocO6 and CosO6 MOs) are different concerning the ratio between the value at the peak and at =0 and that they vary with the projection angle, which is important for a meaningful fit.
| orbital | Coc | Cos |
|---|---|---|
| 0.27(2) | 0.12(2) | |
| 0.27(2) | 0.12(2) | |
| 0.16(2) | 0.26(2) | |
| 0.17(2) | 0.30(2) | |
| 0.13(2) | 0.20(2) |
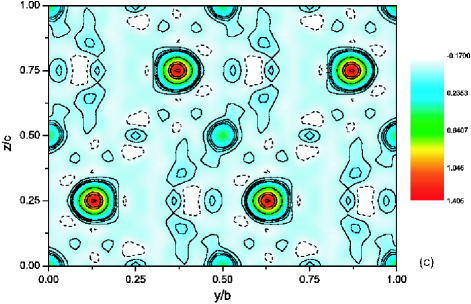
From the calculated MCPs the momentum space spin density has been reconstructed [Fig. 6(b)]. The calculated real space magnetization density map [Fig. 4(c)] has been obtained by a Fourier synthesis of the calculated magnetic structure factors. The main features of the respective density maps coincide well, although some differences are evident: the dip in the momentum space density around =0 is not pronounced well in the calculated map and has a shape, which is rotated by 90∘ with respect to the observed map. This possibly results from strong hybridization effects between the Co3d and O2p orbitals. Furthermore, the disagreements between the experimental and calculated MCPs are most probably due to the limitation of the cluster calculations. Considering a larger sized cluster or the solid state, the gap between the experiment and fitting could be reduced. The real space spin density of the O1 and O3 sites is slightly underestimated. Furthermore, density peaks exist next to the spine site density along the z axis, which do not coincide with atomic positions. However, this fact can be attributed to truncation effects in the Fourier series.
IV.5 Discussion
The study presented here combining several methods reveals very interesting magnetic properties of the kagome staircase system Co3V2O8. The previous assumption, that the ferromagnetic structure at zero magnetic field is not fully ordered because of the Coc only exhibiting 1.54 , is disproved. Previous macroscopic magnetization measurementsWilson et al. (2007) indeed showed a saturated moment of approximately 3.4 per Co site at =2 T along a, but the results of the polarized neutron single-crystal diffraction experiment with adequate extinction correction presented here reveal that the field dependent increase of magnetization stems from the V, O2 and O3 sites. Hereby, the V and O2 site show quite localized magnetization density, while the O3 density seems to be smeared out due to truncation effects in the Fourier series. A periodic ab initio calculation confirms the existence of magnetization density on the V and O sites and will be presented elsewhere.Zbiri et al. (2008) The spin polarized density on O2 and O3, which are those oxygen ions in the CocO6 clusters, may be a strong indication for a partially covalent character of the Coc ions and the reason for their relatively low magnetic moment compared to Cos. The magnetization density distribution clearly exhibits the superexchange pathways between the two different Co sites, but it indicates also the interlayer coupling, which is mediated by the V-O1 bridge. Combining the methods of polarized neutron diffraction and magnetic Compton scattering allowed us to refine the occupations of the Co3d orbitals in a stable way. Like it has been previously reported but with inverted valuesFuess et al. (1982) the two crystallographically different Co ions exhibit different spin polarized orbital occupations. While the unpaired electrons are equally distributed between the and levels for the Cos ion, the magnetic signal stems by only 30% from the orbitals for the Coc ion as a consequence of the spin transfer from the surrounding O ions. Concerning the orbitals of both ions the basal plane orbital is more populated than the apical orbital. This possibly indicates a higher exchange interaction between the Cos ions via an intermediate O2 ion. In the case of the Coc ions it could be a hint that the magnetic exchange with the spine Co ions takes place preferentially via an O3 ion.
Acknowledgements.
This research was supported by the Deutsche Forschungsgemeinschaft within the priority program 1178. The magnetic Compton scattering experiment was performed with the approval of the Japan Synchrotron Radiation Research Institute (JASRI) (Proposal No. 2007B2021). Helpful discussions with Dr. A. A. Granovsky and Prof. A. Koizumi are thankfully acknowledged.References
- Fuess et al. (1970) H. Fuess, E. F. Bertaut, R. Pauthenet, and A. Durif, Acta Crystallogr., Sect. B: Struct. Sci 26, 2036 (1970).
- Sauerbrei et al. (1973) E. E. Sauerbrei, R. Faggiani, and C. Calvo, Acta Crystallogr., Sect. B: Struct. Crystallogr. Cryst. Chem. 29, 2304 (1973).
- Chen et al. (2006) Y. Chen, J. W. Lynn, Q. Huang, F. M. Woodward, T. Yildirim, G. Lawes, A. P. Ramirez, N. Rogado, R. J. Cava, A. Aharony, et al., Phys. Rev. B 74, 014430 (2006).
- Wilson et al. (2007) N. R. Wilson, O. A. Petrenko, and G. Balakrishnan, J. Phys.: Condens. Matter 19, 145257 (2007).
- Nemukhin et al. (2004) A. V. Nemukhin, B. L. Grigorenko, and A. A. Granovsky, Moscow Univ. Chem. Bull. 45, 75 (2004).
- Becke (1993) A. D. Becke, J. Chem. Phys. 98, 5648 (1993).
- Lee et al. (1988) C. Lee, W. Yang, and R. G. Parr, Phys. Rev. B 37, 785 (1988).
- Miehlich et al. (1989) B. Miehlich, A. Savin, H. Stoll, and H. Preuss, Chem. Phys. Lett. 157, 200 (1989).
- Stephens et al. (1994) P. J. Stephens, F. J. Devlin, C. F. Chabalowski, and M. J. Frisch, J. Phys. Chem. 98, 11623 (1994).
- Schäfer et al. (1992) A. Schäfer, H. Horn, and R. Ahlrichs, J. Chem. Phys. 97, 2571 (1992).
- Gordon et al. (2001) M. S. Gordon, M. A. Freitag, P. Bandyopadhyay, J. H. Jensen, V. Kairys, and W. J. Stevens, J. Phys. Chem. A 105, 293 (2001).
- Radzhabov and Kirm (2005) E. Radzhabov and M. Kirm, J. Phys.: Condens. Matter 17, 5821 (2005).
- Pascual et al. (2006) J. L. Pascual, J. Schamps, Z. Barandiarán, and L. Seijo, Phys. Rev. B 74, 104105 (2006).
- Barandiarán and Seijo (1988) Z. Barandiarán and L. Seijo, J. Chem. Phys. 89, 5739 (1988).
- Pascual et al. (1993) J. L. Pascual, L. Seijo, and Z. Barandiarán, J. Chem. Phys 98, 9715 (1993).
- Stevens and Krauss (1992) W. J. Stevens and M. Krauss, Can. J. Chem. 70, 612 (1992).
- Bonnet et al. (1976) M. Bonnet, A. Delapalme, P. Becker, and H. Fuess, Acta Crystallogr., Sect. A: Found. Crystallogr. 32, 946 (1976).
- Qureshi et al. (2007) N. Qureshi, H. Fuess, H. Ehrenberg, T. C. Hansen, and D. Schwabe, Solid State Commun. 142, 169 (2007).
- Rodríguez-Carvajal (1993) J. Rodríguez-Carvajal, Physica B 192, 55 (1993).
- Larson (1970) A. C. Larson, in Crystallographic Computing, edited by F. R. Ahmed, S. R. Hall, and C. P. Huber (Copenhagen, Munksgaard, 1970), pp. 291–294.
- Zbiri et al. (2008) M. Zbiri, N. Qureshi, M. R. Johnson, H Fuess, and H Ehrenberg, to be published.
- Biggs et al. (1975) F. Biggs, L. B. Mendelsohn, and J. B. Mann, At. Data Nucl. Data Tables 16, 201 (1975).
- Żukowski (2004) E. Żukowski, in X-ray Compton Scattering, edited by M. J. Cooper, P. E. Mijnarends, N. Shiotani, N. Sakai, and A. Bansil (Oxford University Press, 2004), p. 133.
- Balakrishnan et al. (2004) G. Balakrishnan, O. A. Petrenko, M. R. Lees, and D. M. K. Paul, J. Phys.: Condens. Matter 16, L347 (2004).
- Suzuki et al. (1989) R. Suzuki, M. Osawa, S. Tanigawa, M. Matsumoto, and N. Shiotani, Journal of the Physical Society of Japan 58, 3251 (1989).
- Tanaka et al. (2001) Y. Tanaka, Y. Sakurai, A. T. Stewart, N. Shiotani, P. E. Mijnarends, S. Kaprzyk, and A. Bansil, Phys. Rev. B 63, 045120 (2001).
- Hahn (1983) T. Hahn, ed., International Tables for Crystallography, Volume A: Space Group Symmetry (D. Reidel Publishing Company, 1983).
- Koizumi et al. (2001) A. Koizumi, S. Miyaki, Y. Kakutani, H. Koizumi, N. Hiraoka, K. Makoshi, N. Sakai, K. Hirota, and Y. Murakami, Phys. Rev. Lett. 86, 5589 (2001).
- Lisher and Forsyth (1971) E. J. Lisher and J. B. Forsyth, Acta Crystallogr., Sect. A: Found. Crystallogr. 27, 545 (1971).
- Fuess et al. (1982) H. Fuess, R. Müller, D. Schwabe, and F. Tasset, J. Phys. Col. C7, 253 (1982).