Front- vs back-illuminated CCD cameras for photometric surveys : a noise budget analysis.
Abstract
Exoplanetary transit and stellar oscillation surveys require a very high precision photometry. The instrumental noise has therefore to be minimized. First, we perform a semi-analytical model of different noise sources. We show that the noise due the CCD electrodes can be overcome using a gaussian PSF (Point Spread Function) of full width half maximum larger than 1.6 pixels. We also find that for a PSF size of few pixels, the photometric aperture has to be at least 2.5 times larger than the PSF full width half maximum. Then, we compare a front- with a back-illuminated CCD through a Monte-Carlo simulation. Both cameras give the same results for a PSF full width half maximum larger than 1.5 pixels. All these simulations are applied to the A STEP (Antarctica Search for Transiting Extrasolar Planets) project. As a result, we choose a front-illuminated camera for A STEP because of its better resolution and lower price, and we will use a PSF larger than 1.6 pixels.
keywords:
instrumentation : detectors – methods : numerical – technique : photometric1 Introduction
The photometric technique allows a direct detection of luminosity variations. Several disciplines are therefore concerned. In asteroseismology, these variations are used to identify stellar oscillations, giving an access to the interior of stars. In planetary sciences, a decrease of luminosity caused by an extrasolar planet occulting its parent star during a transit is used to characterize the planet (Charbonneau et al. 2000; Moutou et al. 2004). In both cases, a very high precision photometry is required, typically to a millimagnitude level. Challenging technical issues have therefore to be solved (Rauer et al. 2004), and high accuracy algorithms are needed (Irwin at al. 2007; Gillon et al. 2006; Magain et al. 2007). The Antarctica Search for Transiting Extrasolar Planets (A STEP) aims to detect planetary transits and stellar oscillations from Dome C, Antarctica (Fressin et al. 2005). The three months continuous night as well as a very dry weather are extremely favorable for photometric surveys. A fully automatized telescope is under development. We present here a first noise analysis of this telescope that leads to the choice of the camera, but that applies to other photometric surveys. The first part shows a noise budget obtained with a semi-analytical model. A second part describes a Monte Carlo simulation of a front- and a back-illuminated CCD camera.
2 Noise analysis
2.1 Description of the cameras
When using available commercial cameras and a limited fund, a problem for photometric surveys is whether to use a backward-illuminated camera, which maximizes efficiency by having electrodes on the non-irradiated side of the CCD, or a front-illuminated camera in which the quantum efficiency is limited by direct reflection on the electrodes, but which is simpler to build and has thus more pixels for a similar price tag. More specifically, in the case of A STEP, these two classes of cameras were led by:
-
•
The back-illuminated camera DW 436 by Andor, with a CCD EEV 42-40, containing 2048x2048 pixels. The quantuum efficiency peaks at 94 %, with a mean of 90 % in the spectral range 600-800 nm. The pixel size is 13 m, and the total CCD size is 2.7 cm. The same CCD is used for the CoRoT mission, giving us some facilities for its testing and characterization. The pixel response non-uniformity is around 2 %.
-
•
The front-illuminated camera Proline by FingerLake Instruments, with a CCD KAF-16801E by Kodak, containing 4096x4096 pixels. Its quantuum efficiency peaks at 63 %, with a mean of 50 % in the spectral range 600-800 nm. Around 40 % of flux is lost with respect to the back-illuminated camera. The pixel size is 9 m, and the total CCD size is 3.7 cm. The pixel response non-uniformity is around 0.5 %. The front-illuminated camera has also the advantage to be much cheaper, allowing us to purchase a backup one.
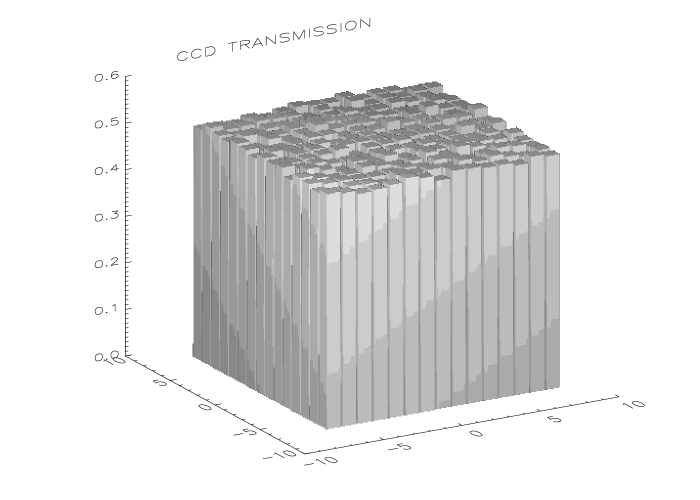
2.2 CCD transmission
In order to test the CCDs, we model a grid in which the optical transmission of each pixel is randomly set, with a standard deviation of few per cent. Electrodes are assumed to cover % of a pixel surface in the case of a front-illuminated camera, thereby explaining the relatively modest quantum efficiency. On the other hand, the back-illuminated camera is considered as ideal, with no loss due to the electrodes. An example of a CCD transmission is shown in figure 1.
2.3 The sources of instrumental noise
We perform a first analysis of the different noise sources. A good understanding of noises is indeed necessary for the choice of a camera. In a more general way, this is critical in transit survey data analysis (Pont, Zucker & Queloz 2006; Smith et al. 2006). All noises are calculated in a semi-analytical model using squared photometric apertures of 3x3 and 5x5 pixels. We use the A STEP instrumental characteristics. The telescope is a 40 cm with a F/D of 4. Stars range from magnitude 11 to magnitude 16. The exposure time is 10 seconds. The PSF (Point Spread Function) is a two-dimensional gaussian function. These parameters are preliminar and will have to be defined more precisely during the telescope design phase, in order to optimize the survey (Horne 2002). Noises correspond to one exposure, without any image processing. This is therefore a worst case. We consider the following noise sources :
-
•
Electrode noise : The bad optical transmission of electrodes leads to a loss of flux. This loss depends on the PSF position with respect to the electrodes. The PSF motion onto the CCD, due to the telescope jitter, leads to loss variations. The resulting noise is therefore calculated as the variation of the flux hitting the electrodes.
-
•
Overflow noise : Because of light sources such as crowding in the field of view, sky brightness, etc., a photometric aperture is set around each target star. The flux outside this aperture is eliminated, shoud it come from the target star or another source. This results in a loss of the flux from the star if the PSF overflows the photometric aperture. The loss depends again on the PSF position inside this aperture, and varies due to the telescope jitter. The noise is then calculated as the variation of the flux inside the aperture.
-
•
Interpixel noise : Each pixel has its own optical transmission, which vary from one pixel to another by typically 1 per cent. This PRNU (Photo Response Non Uniformity) is taken into account defining an equivalent number of pixels under the PSF. The resulting noise is :
were is the standard deviation of the pixel transmission distribution.
-
•
Other noise sources : Other noise sources are implemented such as the photon noise from the target star, the noise from the sky background (taken as 22 mag/arcsec2 with a slow variation along the CCD), and the camera dark current and read-out noise.


2.4 A semi-analytical model
The results of the analysis based on the semi-analytical model are represented in figure 2. The electrode and overflow noises are clearly dominant. The interpixel noise is also dominant for bright stars. As supposed, the other noise sources are not dominant for a 11 magnitude star. For a 16 magnitude star, the photon noise is dominant for full width half maxima between 1.2 and 2 pixels, but does not change the total noise curve shape.
The main observation is that the electode noise reaches a level of for PSF full width half maxima larger than 1.6 pixels. This noise can therefore be overcome adjusting the PSF size. (It can be noted however, that the noise strongly increases when considering non-gaussian PSFs with sharp interfaces, e.g. a top-hat function. We will not consider this further.) We also see that the overflow noise becomes dominant for full width half maxima larger than 2 pixels, given the aperture of 5x5 pixels we use. In a general way, for our PSFs of few pixels, we find that the photometric aperture must be at least 2.5 larger than the PSF full width half maximum.
2.5 Monte-Carlo simulations
In order to test our two cameras, we use a direct simulation of the CCD that attempts to mimic real observations including jitter and interpixel noise. The simulations proceed as follows : during a run, a gaussian PSF is moved along the CCD in an arbitrary direction. For each position, the flux inside the photometric aperture is measured. The resulting noise level is estimated as the peak-to-peak flux variation. This noise is calculated for several PSF full width half maxima, since this parameter can be chosen during the telescope design phase. This simulation is performed for three interpixel values, 0, 1, and 5 % as the real value is unknown, and for two electrode sizes, 50 and 0 % of a pixel, i.e. for both cameras. The results of the Monte-Carlo simulations are shown in figure 3. Note this simulation does not account for different quantuum efficiencies of both cameras. The advantage of the back-illuminated camera, i.e. no electrodes, is valid only for PSFs with full width half maxima smaller than 1.5 pixels. For larger PSFs, both cameras give the same results, which means that the electrode noise is negligible. This is in perfect agreement with our semi-analytical model.

These simulations imply that for well-sampled PSFs, the noise difference is essentially due to the difference in quantuum efficiency, i.e. for the two cameras that are considered, . This is to be compared to the fact that the 4 times increase in pixel number allows having either 4 times as many targets with the same crowding, or, with exactly the same field of view, a reduction of the interpixel noise by a factor 2 due to PSFs that are better sampled spatially.
Other advantages of the presently built CCD cameras is that front-illuminated ones have less interpixel noise (1% vs. 3%), and are generally cheaper (by %). A front-illuminated CCD camera is therefore, in the case of A STEP, more advantageous.
3 Conclusion
We performed a semi-analytical noise analysis to identify the limiting noise sources in precision photometry, using a gaussian PSF. The electrode, overflow, and interpixel noises are dominant, as well as the photon noise for faint stars. We showed that the electrode noise becomes negligible for gaussian PSF full width half maxima larger than 1.6 pixels. We also found that for PSFs of few pixels, the photometric aperture must be at least 2.5 times larger than the PSF full width half maximum.
We then compared a front- and a back-illuminated camera in a Monte Carlo simulation. For photometric surveys for which the PSF is well-sampled (at least 1.5 pixels full width half maximum), and limited in terms of budget to existing commercial cameras, we found that a front-illuminated camera is a better alternative.
References
- [1] Charbonneau, D., Brown, T.M., Latham, D.W., Mayor, M.: 2000, ApJ 529, L45
- [2] Fressin, F., Guillot, T., Bouchy, et al.: 2005, EAS Publ. Ser. 14, 309
- [3] Gillon, M., Pont, F., Moutou, C., Bouchy, F., Courbin, F., Sohy, S., Magain, P.: 2006, AA 459, 249
- [4] Horne, K.: 2002, ESA SP 485, 137
- [5] Irwin, J., Irwin, M., Aigrain, S., Hodgkin, S., Hebb, L., Moraux, E.: 2007, MNRAS 375,1449
- [6] Magain, P., Courbin, F., Gillon, M., Sohy, S., Letawe, G., Chantry, V., Letawe, Y.: 2007, AA 461, 373
- [7] Moutou, C., Pont, F., Bouchy, F., Mayor, M.: 2004, AA 424, L31
- [8] Pont, F., Zucker, S., Queloz, D.: 2006, MNRAS 373, 231
- [9] Rauer, H., Eislöffel, J., Erikson, A., Guenther, E., Hatzes, A.P., Michaelis, H., Voss, H.: 2004, PASP 116, 38
- [10] Smith, A.M.S., Collier Cameron, A., Christian, D.J., et al.: 2006, MNRAS 373, 1151