The Unusual Object IC 2144/MWC 778
Abstract
IC 2144 is a small reflection nebula located in the zone of avoidance near the Galactic anticenter. It has been investigated here largely on the basis of Keck/HIRES optical spectroscopy (R 48,000) and a SpeX spectrogram of the near-IR (R = 2000) obtained at the NASA IRTF. The only star in the nebula that is obvious in the optical or near-IR is the peculiar emission-line object MWC 778 ( = 12.8), which resembles a T Tauri star in some respects. What appear to be F- or G-type absorption features are detectable in its optical region under the very complex emission line spectrum; their radial velocity agrees with the CO velocity of the larger cloud in which IC 2144 is embedded. There are significant differences between the spectrum of the brightest area of the nebula and of MWC 778, the presumed illuminator, an issue discussed in some detail. The distance of IC 2144 is inferred to be about 1.0 kpc by reference to other star-forming regions in the vicinity. The extinction is large, as demonstrated by Fe II emission line ratios in the near-IR and by the strength of the diffuse interstellar band spectrum; a provisional value of of 3.0 mag was assumed. The SED of MWC 778 rises steeply beyond about 1 m, with a slope characteristic of a Class I source. Integration of the flux distribution leads to an IR luminosity of about 510 . If MWC 778 is indeed a F- or G-type pre–main-sequence star several magnitudes above the ZAMS, a population of faint emission H stars would be expected in the vicinity. Such a search, like other investigations that are recommended in this paper, has yet to be carried out.
1 Introduction
On conventional photographs such as the Palomar Sky Atlas, IC 2144 appears as a roughly rectangular object about 25″ 16″ that might be mistaken for a small irregular galaxy like M82, or an H II region. It is in fact a complex reflection nebulosity, apparently illuminated by an off-center star of , and embedded in a small, rather inconspicuous dark cloud. That star111 = 5h 50m 13s.5, = +23∘ 52′ 17′′ (J2000); = 184∘.9, = 1∘.7 was found by Merrill & Burwell (1949) to have H as well as lines of Fe II and [Fe II] in emission. They named it MWC 778 and assigned type Bpe. In what follows, we continue to distinguish between the star MWC 778 and the nebulosity IC 2144.
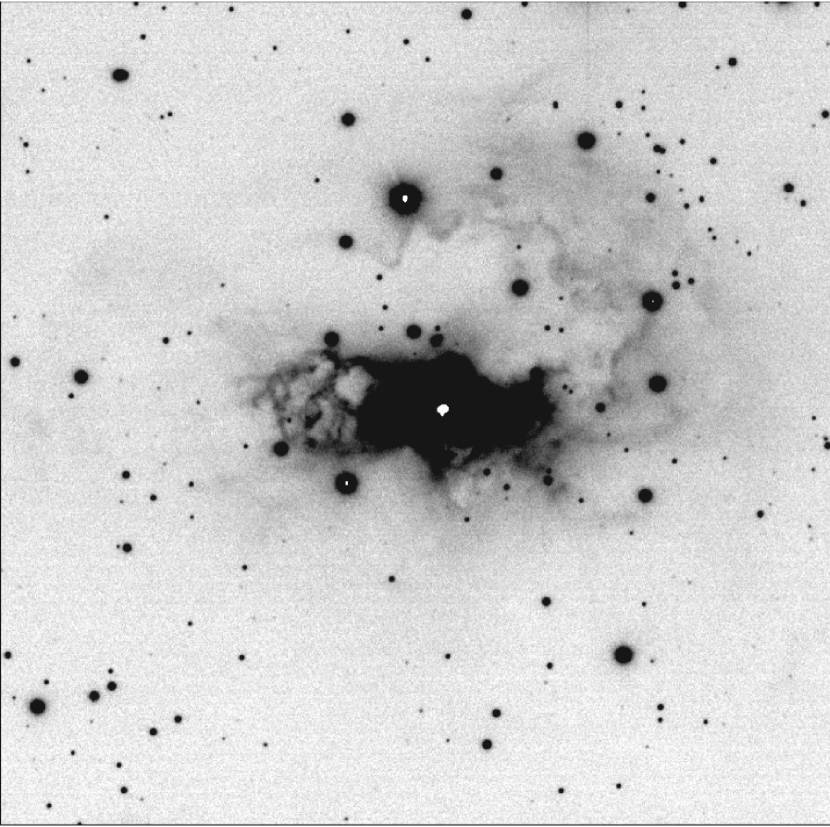
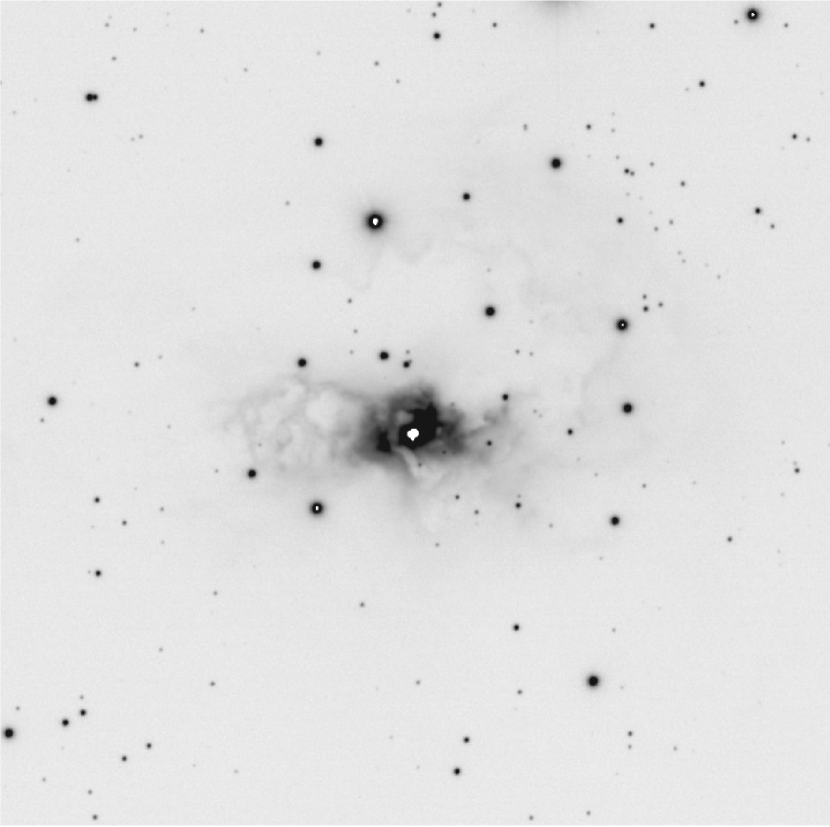
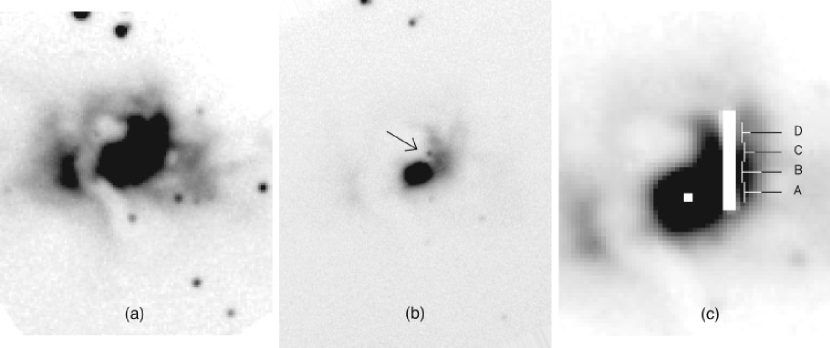
IC 2144 is reproduced in Figure 1 from an exposure obtained with the SuprimeCam instrument behind an H filter at the Subaru Telescope222The Subaru Telescope is operated by the National Astronomical Observatory of Japan. and kindly made available by Bo Reipurth. MWC 778 is located near the white spot in the overexposed nebulosity. The nebula appears to be much larger (about 120″ 100″) and more complex than apparent on earlier images. Figure 2 is the same image plotted on a logarithmic intensity scale. The internal structure is shown in Figures 3a, b, and c, which are -band images of IC 2144, extracted from 2 s snapshots (obtained in poor seeing) of the slit plane of the Keck I HIRES spectrograph during one of the spectroscopic exposures to be described later. Very bright nebulosity immediately surrounds the star and extends about 5″ to the northwest (the image of MWC 778 itself is slightly elongated in the same direction), where it splits into two curving forks, best seen in Figure 3b, which is the same image as Figure 3a, on a logarithmic intensity scale. At longer wavelengths the surface brightness of IC 2144 becomes so high and so structured as to confuse the 2MASS , , and images, which have a resolution of about 4″.
Optically, the appearance of the interior of IC 2144 is defined by what appears to be a band of dust in the shape of a reversed question mark that begins north of MWC 778, curves as it crosses the bright background of the nebula to the east, and appears to unwind as it disappears against the faintly luminous background south of MWC 778. There is a faint (R magnitude about 17) star (arrowed in Fig. 3b) about 4″ northwest of MWC 778, at the beginning of this feature, and another about 3 ″southwest. It is unknown whether they are related to the nebula, or if the brighter of the two northeast forks is really the illuminated base of the dust band.
Allen (1974) noted the emission lines of H, Fe II, [Fe II] and [S II] in MWC 778, and performed the first near-IR photometry out to 18 m. He commented that “its almost linearly rising energy distribution [in the Fλ, plane] is unique.” The IRAS fluxes (it is the point source 05471+2351 and the Small Scale Structure Source X0547+238) reinforce that impression: they have not begun to decline as far as the 100 m point, although the IRAS catalog notes that both the 60 and 100 m fluxes are uncertain because of the bright background. Published photometry of the star is collected in Table 1, but it is not always clear what aperture size was used, or if allowance was made for a contribution by the bright nebulosity.
IC 2144 is near the Galactic anticenter, so the LSR velocity of its associated CO (about +2 km s-1: 2) is too small to establish a kinematic distance. On the sky, there is no well-defined obscuring cloud nearby. Within a radius of 3–4 of IC 2144 there are two distant H II regions (S 242, at about 2 kpc, and S 243), two distant star clusters (NGC 2129 at 2 kpc and Be 21 at 5–6 kpc), and the bright B star 139 Tau (distant 0.9–1.1 kpc). There is no reason to believe that IC 2144 is associated with any of these objects. There are two star-forming regions in that general direction, but both are about 3 distant. To the northwest is the small cloud containing the HAeBe star RR Tau and a few T Tauri Stars (TTS); its distance has been estimated as 380 pc by Rostopchina (1999). The contrast between the star density projected upon that cloud and that of its background is large, unlike the situation at IC 2144 where the contrast is small. This is to be expected if IC 2144 is considerably more distant. To the south is the small cloud CB34, studied most recently by Khanzadyan et al. (2002). Its distance is usually taken to be 1.5 kpc on the assumption that it is associated with the Gem OB1 association, which lies still farther east. On the basis of all these samples, we assume for the purposes of this paper that the distance of IC 2144 is 1.0 kpc, but emphasize the uncertainty of this estimate.
2 Optical Spectroscopy
Spectrograms of the object were obtained on 2003 December 13 and 2004 November 21 with the HIRES spectrograph at the Keck I telescope.333The W. M. Keck Observatory is operated as a scientific partnership among the California Institute of Technology, the University of California, and NASA. The Observatory was made possible by the generous financial support of the W. M. Keck Foundation. The spectrograph is described in some detail in http://www2.keck/hawaii.edu/inst/hires/. The first series covers the region 4350–6740 Å at a resolution of about 48,000 with slit dimensions of 086 7′′. The seeing then was poor: star images have a FWHM of about 15. The first exposure of that series was centered on MWC 778. The second crossed the brightest portion of the nebulous arc about 5′′ northwest of the star; its precise location is shown in Figure 3c. The 2004 exposure was also centered on MWC 778, but covered 4400–8800 Å at slightly higher resolution. Reductions were carried out with standard IRAF procedures. The average S/N per pixel in the continuum of the two (reduced) exposures of the star averaged about 50 in the 5000 Å region, 100 near 6200 Å, and 130 near 7700 Å.
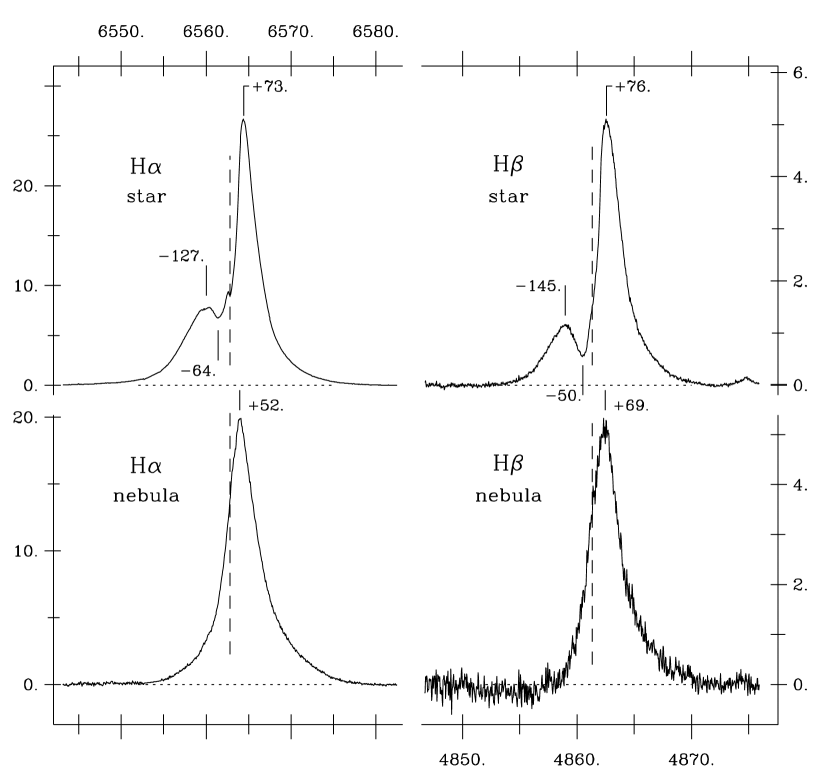
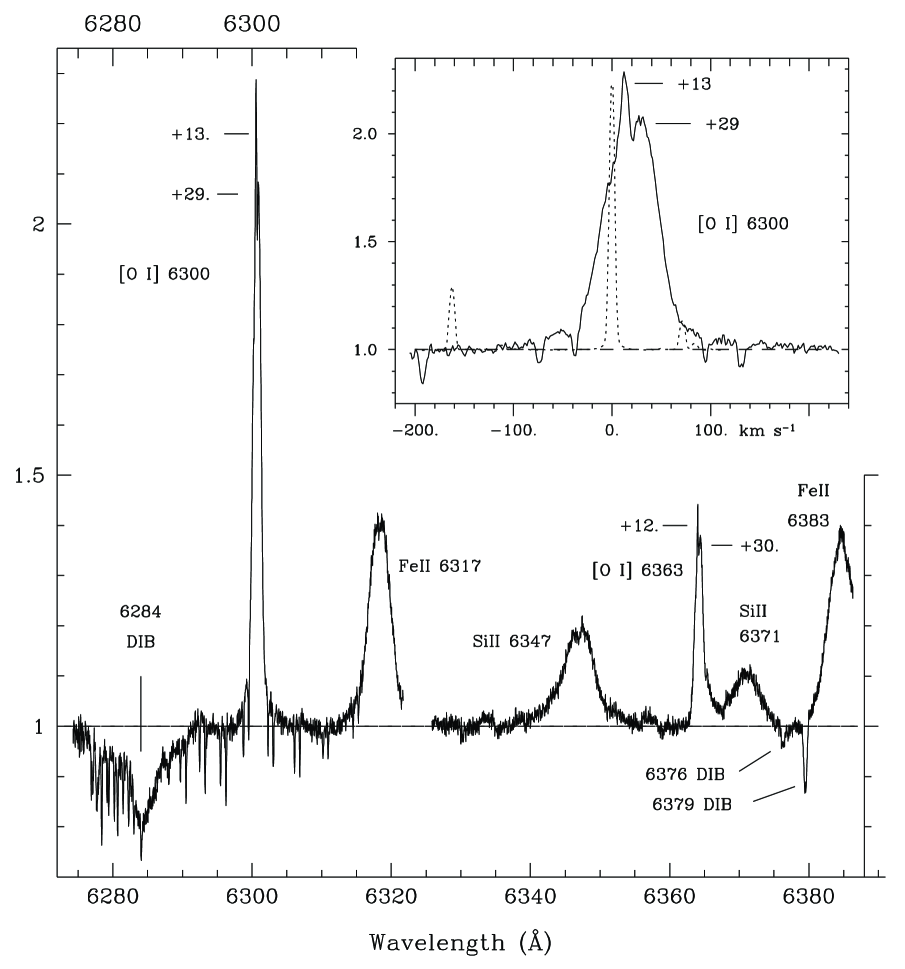
The spectrum of MWC 778 is dominated by a strong ( Å ) H emission, followed by many emission lines of Fe II, [Fe II], [O I], [S II], and Si II, and a few of [Ni II] and [Cr II]. The profiles of H and H are shown in the upper section of Figure 4, with velocities444The radial velocities in this paper are heliocentric, unless noted otherwise. The correction of heliocentric to LSR at the position of IC 2144 is 11.8 km s-1. of several features marked. Vieira et al. (2003), at a resolution of 9,000, also noted the off-center reversal in H and the presence of [S II] and [O I]; they gave the type as “B1?.” The spectrum between 3900 and 6700 Å at moderate resolution was reproduced by Suárez et al. (2006). Only emission lines are apparent. Their classification was “BQ[ ].”
The lines of S II and N II 6583 scatter in velocity between +14 and +17 km s-1, in agreement with Fe II. However, both [O I] 6300 and 6363 are double, with peak velocities of +13 and +29 km s-1. That region (on the 2004 spectrum) is shown in Figure 5, where the splitting of the O I] lines is apparent (see the expanded profile of 6300 in Fig. 5), as is the striking difference between the widths of permitted and forbidden lines. Despite their duplicity, the FWHM of the combined O I] lines is only about 60 km s-1, as compared to 220 km s-1 for Si II 6347.
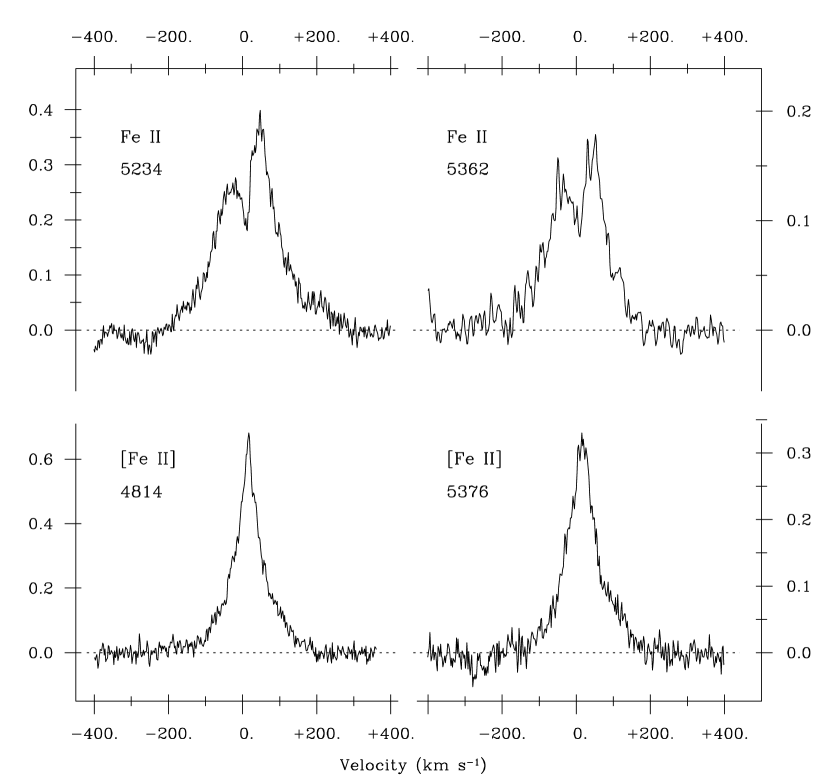
The Fe II lines are double, with a splitting of about 72 km s-1. This is most obvious in the weaker Fe II lines such as 5234 and 5362, shown in Figure 6 (plotted on a velocity scale), while in the strongest, such as 4923 and 5018, it is apparent only as unresolved structure in the shortward wing. The [Fe II] lines, on the other hand, are narrow and single (see two examples in Fig. 6), at a mean velocity of +16.5 1 km s-1, in clear contrast to Fe II at and +44 2 km s-1.
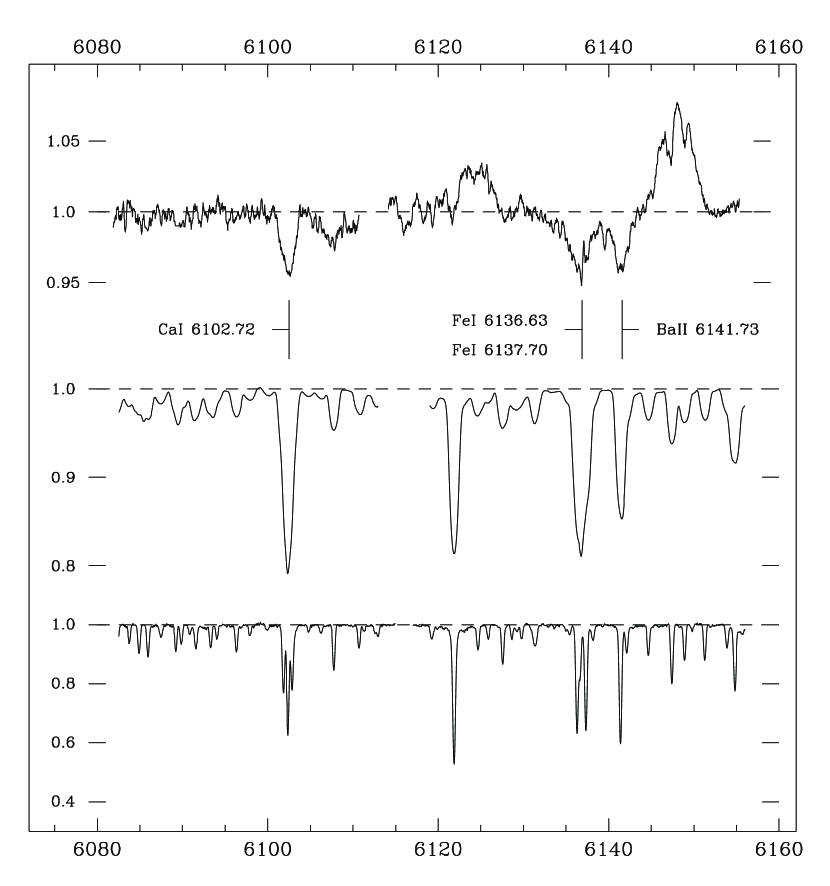
The spectrum of MWC 778 is cluttered with line emission, but an absorption-line spectrum is dimly discernible in the clearer regions. No real classification is possible, but most of the detectable lines are those expected of an F- or G-type star, although a late A type cannot be ruled out. Those lines are shallow, probably because of veiling, and are not sharp; their widths correspond to a sin of 30–40 km s-1. This is apparent in Figure 7, a plot of the 6080–6160 Å region in MWC 778 (top), compared to that region in the G0 V star HR 8314 (bottom), and (middle) the same HR 8314 spectrum broadened to sin = 35 km s-1. Note that the vertical scales in the several panels of Figure 7 are very different in order to display each spectrum at approximately the same line amplitude.
The Li I 6707 Å line is present in MWC 778, as expected for a pre–main-sequence star, at an equivalent width of 47 mÅ. The velocity of the absorption spectrum, from 23 measurable lines, is +13 2 km s-1 The B-type absorption spectrum suspected by Vieira et al. (2003) is not in evidence.
The CO cloud velocity at IC 2144 is +14.1 0.3 km s-1 according to Blitz et al. (1982) and +13.8 0.1 according to Wouterloot & Brand (1989). In the optical region of MWC 778, strong interstellar Na I D1,2 lines are present on the HIRES spectrograms (equivalent widths 0.85 and 0.74 Å) at +13 km s-1. The one unblended interstellar K I line 7698 is at +12 km s-1. Two sets of much weaker IS lines fall in the shortward wings of the D lines, at 4 and 15 km s-1. The diffuse interstellar band spectrum is strong; several diffuse interstellar bands (DIBs) are indicated in Figure 5. Equivalent widths and velocities of some of the more prominent DIBs are given in Table 2; their mean velocity is +12 1 km s-1.
The agreement of cloud CO and MWC 778 absorption line velocities is as expected if the star formed within that cloud. The agreement with the optical interstellar velocities (Na I, K I) is compatible with the idea that that material also is associated with the CO cloud, although at that longitude only a weak dependence of velocity upon distance is expected.
The emission spectrum of MWC 778 is very similar to that of another high-luminosity pre–main-sequence object, LkH-101, in which the Fe II lines also are double, the Fe II lines are single at an intermediate velocity, the O I] lines are double, and the Si II lines are very broad (Herbig et al., 2004). In that case, the Fe II splitting was interpreted as produced in a tipped annulus in rotation around a 15 star.
3 Near-Infrared Spectroscopy
MWC 778 was observed at the NASA Infrared Telescope Facility on Mauna Kea on 2005 October 21, 17:30 UT with SpeX, the facility near-infrared medium-resolution cross-dispersed spectrograph (Rayner et al., 2003). Eight individual exposures, each lasting 90 s, were obtained using the short-wavelength cross-dispersed (SXD) mode of SpeX. This mode yields spectra spanning the wavelength range 0.8–2.5 m divided into six spectral orders. The observations were acquired in “pair mode,” in which the object was observed at two separate positions along the 15″-long slit. The slit width was set to 03, which yields a nominal resolving power of 2000 for the SXD spectra. The slit was set to the parallactic angle during the observations. The airmass was about 1.08. Observations of an A0 V star, used as a “telluric standard” to correct for absorption due to Earth’s atmosphere and to flux calibrate the target spectra, were obtained immediately preceding the observations of MWC 778. The airmass difference between the observations of the object and the standard was 0.05. A set of internal flat fields and arc frames was obtained immediately after the observations of MWC 778 for flat fielding and wavelength calibration purposes.
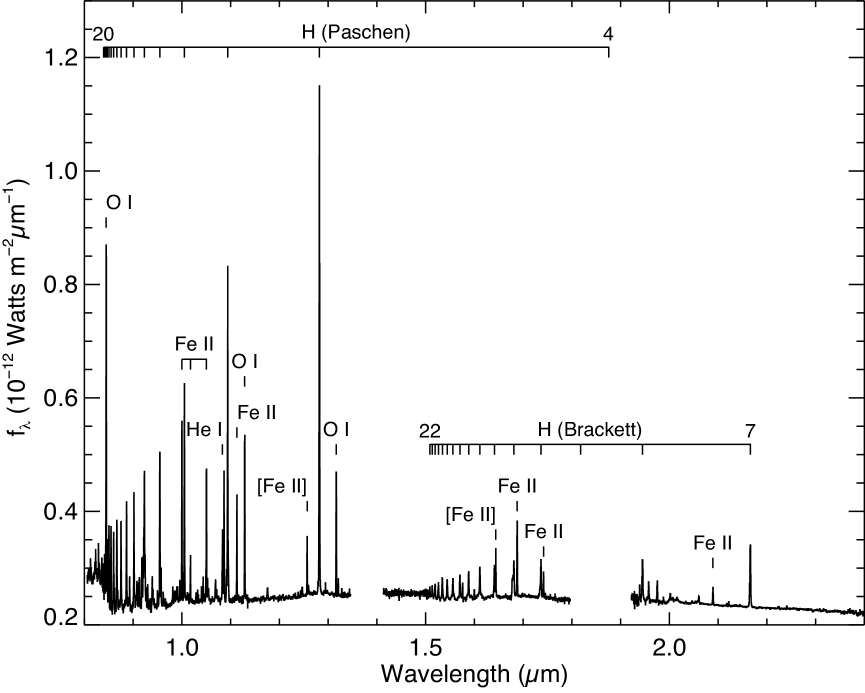
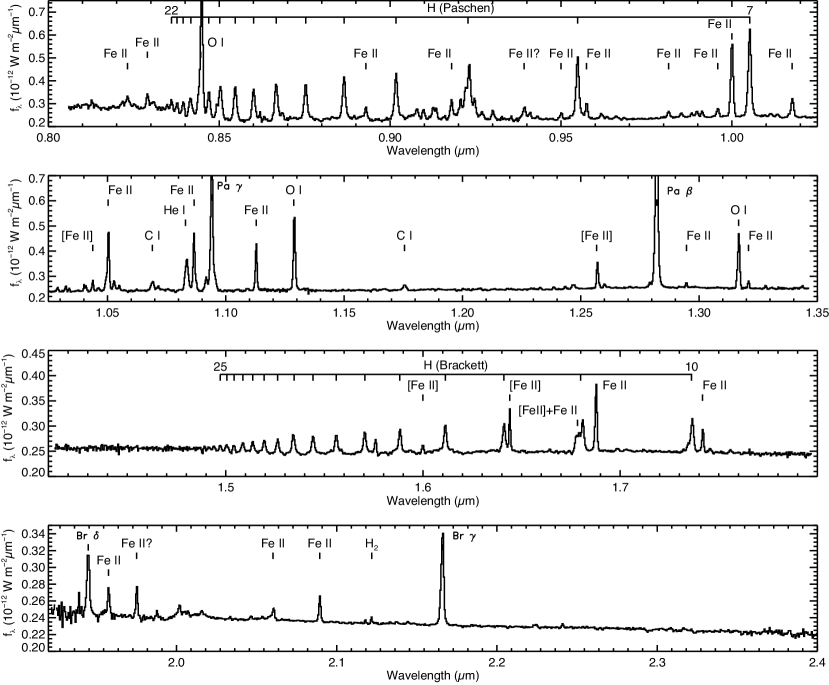
The data were reduced using Spextool (Cushing et al., 2004), the IDL-based package developed for the reduction of SpeX data. The Spextool package performs nonlinearity corrections, flat fielding, image pair subtraction, aperture definition, optimal extraction, and wavelength calibration. The eight sets of spectra resulting from the individual exposures were median combined and then corrected for telluric absorption and flux calibrated using the extracted A0 V telluric standard spectra and the technique and software described by Vacca et al. (2003). The spectra from the individual orders were then spliced together by matching the flux levels in the overlapping wavelength regions, and regions of poor atmospheric transmission were removed. The final spectrum is shown in Figure 8, and in expanded sections in Figure 9. The signal-to-noise ratio varies across the spectral range, but is of the order of 100 at the shortest wavelength and rises to several hundred at the center of the band. Table 3 is a list of the wavelengths, identifications, fluxes, and equivalent widths of emission lines measured on this spectrogram.
The errors of the line fluxes and equivalent widths were estimated following the procedure of Cushing et al. (2005), which uses the errors of the individual pixel values as produced by Spextool (Cushing et al., 2004; Vacca et al., 2004), and follows the method of Sembach & Savage (1992).
The photometric magnitudes of MWC 778 (source 4 in Table 1) were estimated by multiplying the SpeX spectrum by the MKO filter transmission functions (Tokunaga et al., 2002) and integrating over the passbands.
4 Electron Density and Temperature
The multitude of emission lines present in the NIR spectrum of MWC 778 allow, in principle, the physical parameters of the line-emitting regions to be determined via the comparison of observed line strength ratios with theoretical values. Of course, the observed line strengths are affected by extinction, and to properly take this into account, an iterative procedure is required. Nevertheless, there are several relevant line ratios available on which extinction has a relatively minor effect, and that can be used to estimate the electron density () and temperature ().
The [Fe II] lines in the and bands provide three line ratios that can be used for this purpose. Bautista et al. (1995) used the Fe II model of Pradhan & Zhang (1993) to compute the ([Fe II] 1.298 + 1.295 m)/[Fe II] 1.257 and [Fe II] 1.533/[Fe II] 1.257 m ratios as a function of . A combination of these results and the observed ([Fe II] 1.298 + 1.295)/[Fe II] 1.257 m line ratio of 0.2 produces a nearly reddening-independent estimate of [cm-3] 4.15. To obtain the second line ratio from the observed spectrum, the contribution of Br 18 to the observed Br 18 + [Fe II] 1.533 blend was estimated by interpolating the Br line series strengths as a function of quantum number on either side of the line. After subtraction of the Br 18 contribution, it was found that [Fe II] 1.533/[Fe II] 1.257 0.2, which leads to a value of [cm-3] 4.3. However, this ratio is affected by extinction, which drives the ratio and the corresponding derived electron density to larger values, so this value is an upper limit. The results of Pradhan & Zhang (1993) also provide a third estimate of ; by combination of their theoretical [Fe II] 1.533/[Fe II] 1.644 ratio with our (Br 18-subtracted) value, an electron density of [cm-3] 3.8 is obtained. Again, this ratio is affected by extinction, but in the opposite sense of that for the [Fe II] 1.533/[Fe II] 1.257 ratio. Hence the derived density value is a lower limit. In light of the uncertainties in the observed line ratios, all three density estimates are consistent with a value of [cm-3] 4.1.
A limit on in the [Fe II] emitting region can be placed by using the theoretical predictions of Pradhan & Zhang (1993) for the [Fe II] 8617 Å/[Fe II] 1.257 m ratio. For an assumed electron density of [cm-3] 4.1, the observed ratio corresponds to K; a lower limit as reddening will reduce the observed line ratio.
5 The Spectrum of the Nebulosity
One expects that the spectrum of a reflection nebulosity illuminated by MWC 778 would mimic that of the star. That is not the case. The slit of the second HIRES exposure crossed the brightest area of IC 2144 west and northwest of the star, as shown in Figure 3c. The spectrum of the nebula was extracted at four positions along that 7′′-long slit; the boundaries of these segments are marked in that figure. A sky sample was taken from the end of the slit above segment D, and subtracted from each segment. There is a considerable variation in both emission lines and continuous background along the slit, the brightness of both being highest at segment B. However, the two do not maintain a fixed ratio as would be expected if the same illuminating source were being scattered at all positions along the slit. The effect is shown in Table 4, where the brightness (pixel-2) of [O I] 6300, averaged over its central 0.24 Å, is compared to the brightness of the nearby continuum, both expressed in units of the continuum brightness in segment B. The [O I] lines are double in both star and nebula, but at different velocities: +13 and +29 km s-1 in the star, +1 and +13 km s-1 in the nebula; see Table 5 for details.
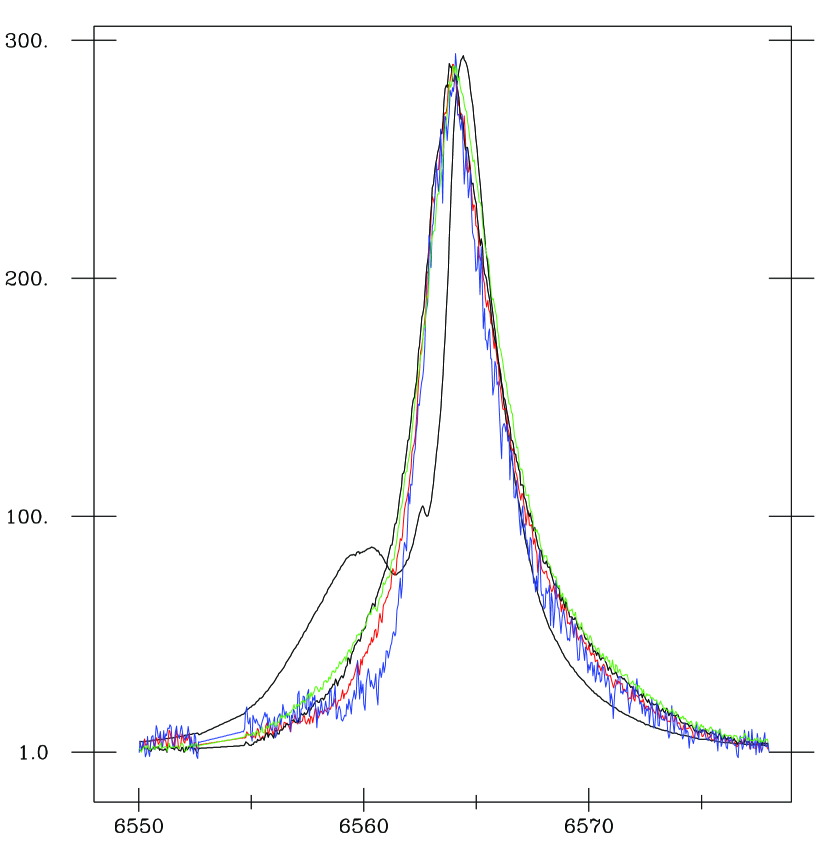
There is a striking difference between star and nebula in the profiles of H and H. Figure 4 shows the two lines in the star (above) and in the nebula (below), the latter being the sum of the spectra extracted from the four slit segments. Both lines in the nebula are structureless and nearly symmetric, while what appears to be a shortward absorption reversal in the star is absent in the nebula. Furthermore, the line peaks in the nebula are displaced 10–20 km s-1 shortward with respect to their positions in the star. These differences, as well as a less obvious mismatch in the longward wing, are apparent when the profile of H in the star is superposed upon the profiles of that line from the four individual samples of the nebular spectrum: see Figure 10, and the details in Table 5.
The lines of [Fe II] that are so prominent in MWC 778 are essentially absent (with respect to Fe II) in the nebula. The evidence is in Table 6, where the equivalent widths of (mostly) unblended lines of Fe II and [Fe II] in star and in nebula are compared.
Table 7 lists the ’s and radial velocities of the S II 6717, 6730 Å lines in MWC 778 (on both dates) and at several points in the nebula (in 2003), and electron densities estimated by comparing the observed [S II] 6717/6730 equivalent width ratios with intensity ratios computed with a 5-level atom model as a function of and . (An electron temperature of K was assumed, but there is relatively little variation in the line ratios with temperature.)
6 Interpretation of the Mismatch between Star and Nebula:
6.1 A Travel-Time Effect?
One explanation of the differences between star and nebula might be that they result from a travel-time effect. That is, could the spectrum of MWC 778 have changed before that change was replicated in the nebular spectrum? The projected separation between the star and the point in the nebula where that spectrum was obtained is about 5, which at 1 kpc corresponds to a light travel time of 29/cos days, being the inclination of the radius vector to the plane of the sky. Variations in the emission-line spectra of pre–main-sequence stars are of course well known, but in the case of MWC 778 there is no evidence of change in the shortward structure of H between the two HIRES observations, 344 days apart. More observations would be instructive, but at the moment this remains a somewhat unlikely possibility.
6.2 Or Another Illuminator of the Nebula?
Another possibility is that the nebula might be illuminated to a significant degree, not by MWC 778, but by some other source that is deeply obscured as seen from our direction. If so, at IR wavelengths the intensity peak might move away from the optical position of MWC 778. To explore this possibility, IRAC images of the field (at 3.6, 4.5, 5.8 and 8.0 m) were extracted from the Spitzer archive.555 These observations were made with the Spitzer Space Telescope, which is operated by the Jet Propulsion Laboratory, California Institute of Technology, under a contract with NASA. About ten stars whose coordinates are available from the USNO A2 compilation lie within about 3 of MWC 778, and at least six of these were measureable on all the IRAC images and served to define a common (, ) coordinate system in which the intensity peak of each image could be located. It was found that there was no systematic shift in its position between 0.65 and 8.0 m; the total scatter around the mean position was 003, 04. The faint star arrowed in Figure 3b does not appear in the Spitzer images, and thus is of no concern in this connection.
Polarization imagery, by discovering the direction from which the nebula is illuminated, could settle the question of whether there is a source other than MWC 778. The polarization maps of the nebula presented by Perrin (2006) do not suggest that there is another source. One has to say that if there were another illuminator of the nebula, it would be surprising that its spectrum is so similar, almost in detail, to that of MWC 778. A useful additional test would be to determine if the F-G absorption lines of MWC 778 are present also in the nebular spectrum. Unfortunately, the present spectrum of the nebula is too noisy (S/N 15 in the continuum) for that check.
6.3 Or MWC 778 Seen from Different Directions?
There remains the more interesting possibility, rather than the nebula being illuminated by some other source, that MWC 778 is in fact the illuminator but is not spherically symmetric, and so looks quite different as seen from our direction and from any point in the dust that it illuminates.
Although the profile of H remains about the same through the sequence of nebular samples A through D, its equivalent width decreases with (projected) distance from the star. The [O I] lines are double in both star and nebula, but at different velocities, velocity separations, and equivalent widths; the details for both H and 6300 are given in Table 5.
The 6300 line is seen in many of the TTS and HAeBe stars observed by Acke et al. (2005). Although a variety of line profiles was found, 6300 is double in some objects, notably in two of the three HAeBe stars studied by van der Plas et al. (2008), although in those stars the peak intensity of the line was only 0.05 to 0.10 of the continuum intensity, as compared with 2 to 2.5 in MWC 778. Nevertheless, their interpretation of the doubling as the consequence of emission in an unresolved, inclined disk might apply to MWC 778. We pursue that possibility.
Imagine that the rotational axis of the central star embedded in the image of MWC 778 is inclined to the line of sight, is directed to the northwest, and that it is surrounded by an equatorial disk in Keplerian rotation. Then the double Fe II lines (splitting 72 km s-1) could be formed in the disk near the star, while the double [O I] lines (splitting 16 km s-1) would be formed farther out. The low ’s inferred from [S II] and [Fe II] and the fact that lines of both ions are single indicate that they originate still farther out in the disk where the orbital velocity is too small for their splitting to be resolved. The different sites thus inferred for [S II] and [O I] may be a consequence of the latter being favored nearer the star by a special mechanism, namely the UV photodissociation of OH and H2O (see Acke et al. 2005 for references). Then the “reversed question mark” feature in the nebula, which resembles the one-armed dust spirals seen at some pre–main-sequence stars like SU Aur, may be material unwound from the disk periphery. If the flux of the outflowing wind that produces the shortward absorption reversals at the Balmer lines is latitude dependent, then the strength of that feature in the nebular spectrum would depend upon the location of the viewing point in the nebula.
If the [O I] splitting is indeed due to disk rotation, the unequal peak intensities (Table 5) would mean that the [O I] brightness is nonuniform in disk azimuth. Then the difference in doublet splitting between star (16 km s-1) and nebula (about 11 km s-1), and the change in doublet intensity ratio between star and nebula would be explained if the nebula “sees” the disk at a different inclination and from a different direction. The shortward velocity shift of the doublet midpoint and of the Balmer lines from star to nebula would then be explained by motion of nebula with respect to star.
Unexplained is the peculiar shortward structure at H and H in the star. The emission wings of those lines would have to be extended about 2 Å shortward, with respect to the nebular profiles, to provide a background if that is indeed an absorption reversal. Another possibility is that it is not an absorption at all, but only a gap between the main emission peak and a secondary emission peak at 127 km s-1 at H or at 145 km s-1 at H. Yet no such feature at those displacements is present in the spectrum of MWC 778 at the He I, Fe II, or unblended Paschen lines (P14, P17, P20).
Future observations should clarify these issues.
7 Extinction
The extinction as inferred from the optical colors will be discussed later, but other indicators also are available.
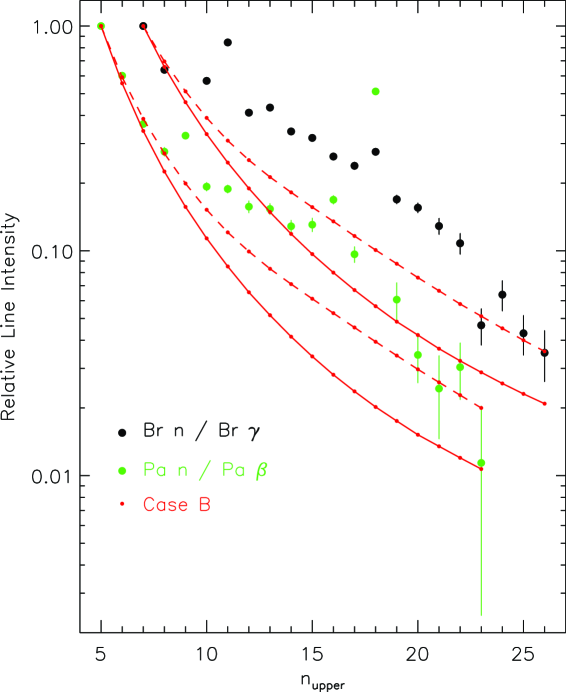
(1) Normally, the numerous Paschen and Brackett emission lines in this spectrum would provide excellent diagnostics of the reddening of MWC 778. However, as is apparent in Figure 11, the relative line strengths do not vary in a manner consistent with Case B. Specifically, ratios of the strengths of higher order Pa lines to Pa, and Br lines to Br appear to be far too strong compared with the Case B predictions of Hummer & Storey (1987) for all but the most extreme combinations of electron temperature and density: 3000 K and 107 ne 1010 cm-3. Probably the lower members of the Pa and Br series are optically thick (or somehow otherwise suppressed relative to the higher levels). Our measured Pa/Br line ratio agrees quite well with the “Case C” values given by Xu et al. (1992), which applies when both the Lyman and Balmer line series are optically thick. In this case, one would expect that some of the lowest lying Pa and Br lines should also be optically thick (Storey, private communication). Unfortunately, Xu et al. (1992) did not give theoretical ratios for any other combination of lines seen in our spectra.
An attempt was made to fit the relative fluxes of various sets of higher order H lines in both the Br and Pa series, allowing the electron density, electron temperature, and reddening to vary. No consistent value of the reddening could be found that resulted in acceptable fits to all of the lines considered. In fact, when the analysis was restricted to only the higher order ( 12) Br line fluxes, the best fits yielded negative reddening values.
Next, [Fe II] transitions arising from the same upper level were examined. The intrinsic flux ratios of such pairs of lines should follow from their wavelengths and values. The strongest suitable line pair observed in MWC 778 consists of the 1.257 m and the 1.644 m transitions. (Other [Fe II] lines are present but either lie in a region of poor telluric correction, or are blended, or are very weak.) Their observed line fluxes, the values given by Nussbaumer & Storey (1988), and the extinction law of Rieke & Lebofsky (1985) result in a color excess of , or .
(2) As remarked, the interstellar diffuse band spectrum is very strong; several DIBs are indicated in Figure 5. The equivalent widths (and velocities) of some prominent features are given in Table 2, together with the average ’s of the same bands in five of the B-type stars in the obscured cluster NGC 1579 (Herbig et al., 2004). Obviously, the DIBs are substantially stronger in MWC 778 than in those B stars, by a factor 1.3 on the average. Since the average of those stars is 3.5 mag, the implication is that the extinction of MWC 778 is still larger. But it is well known that although DIB strengths increase with extinction in a general sense, there is significant scatter about any regression line, there are substantial local variations, and DIB strengths do not respond to the heavy extinction of dense molecular clouds or of circumstellar material.
The looseness of the correlation of DIB strength with color excess is illustrated by the relationship between the equivalent width of the 5780 DIB and from Herbig (1993). The (5780) of MWC 778 from Table 2 leads to , or = 2.57, but the values for individual stars near that value of spread between = 0.63 and 1.6, or = 1.95 and 5.0.
Given the scatter of these indicators, we can say only that for MWC 778, may be about 3 mag.
8 Luminosity
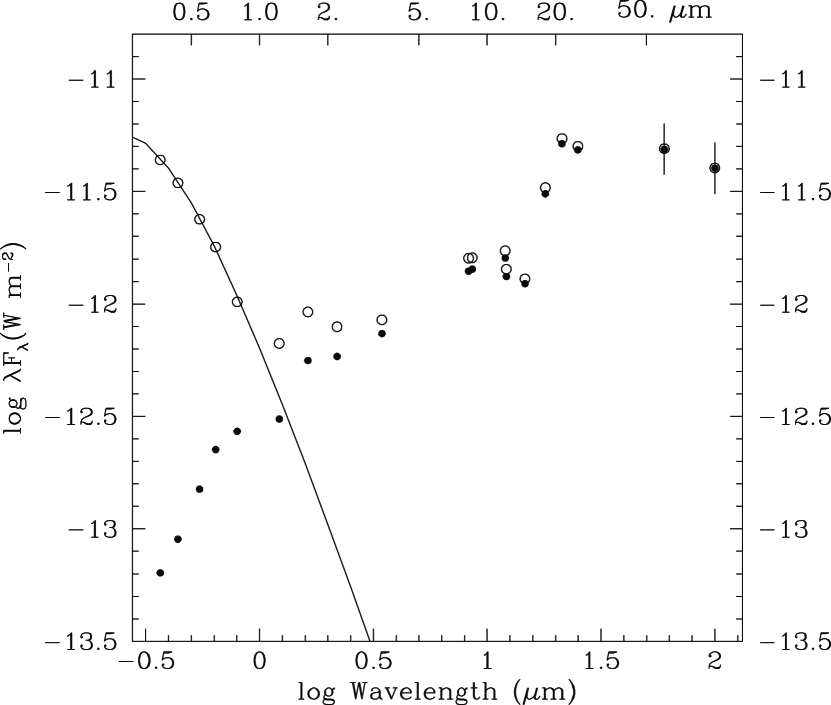
Figure 12 shows the SED of IC 2144/MWC 778, constructed from the data of Table 1. Solid points represent the observed data points, while open circles show the result of correction for , under the assumption of normal reddening (to 10 m from Rieke & Lebofsky 1985, longward of 10 m from Mathis 1990). The slope of the SED between 2.0 and 25 m, , is +0.7. If taken at face value this indicates Class I membership.
The energy contained in the infrared excess between 2 and 100 m can be estimated by integrating the flux densities between these limits. If it is assumed that = 3.0 mag and that the distance is 1 kpc, the resulting IR luminosity is , where that uncertainty reflects only the assumed 30% uncertainties in the IRAS 60 m and 100 m flux densities. An estimate of the additional excess beyond 100 m can be made by assuming that it follows a Planck distribution peaking at that wavelength (Cohen, 1973; Chavarría-K., 1981). This adds about 140 to the above value. As pointed out by the referee, such luminosities assume that the object radiates isotropically.
Note that the optical-region fluxes include not only the near-point-source MWC 778, but at longer wavelengths a larger fraction of IC 2144.
Consider what can be learned about MWC 778 by the color of that steeply rising section of the SED shortward of about 1 m. The solid curve in Figure 12, passing through the open circles as far as 0.366 m, is the Planck function for 15,000 K, corresponding to a mid-B-type star. That is quite incompatible with the absorption spectrum. The discrepancy is somewhat smaller if one considers instead the () color, thus avoiding the contribution of the strong emission lines in the blue and near-ultraviolet. The contributions of line emission to the V and IC magnitudes, obtained by summing the equivalent widths of all measureable lines across the V and IC passbands, are estimated as 0.03 mag and 0.05 mag, respectively, so the corrected and () are 12.83 and +1.48. Table 8 gives the main-sequence spectral types (Bessell & Brett, 1988) corresponding to this color if normal reddening is assumed, and correction is applied for several values of . Absolute magnitudes follow if is corrected for those ’s and distances of 0.7, 1.0, and 1.3 kpc.
But this suggests a mid-A spectral type for the star, still in conflict with the actual classification of F or G (although as explained, that type is very uncertain because of heavy interference by the overlying emission spectrum). Either of the following two assumptions could reduce this disagreement.
(1) The foregoing hinges on the assumption of normal reddening, i.e., that . Larger values of are often found in dense clouds, so consider the possibility that here has the not unreasonable value of 5.0. The consequent value of the extinction correction can be estimated from the relationships provided by Cardelli et al. (1989) from which can be obtained as a function of and . These, weighted by the filter transmission and integrated across the and passbands, result in ) values of 2.44 for = 3.1, and 2.96 for 5.0. The inferred spectral type for = 3.0 mag then moves from A5 V (Table 8) to F3.5 V, a better match for the actual classification.
(2) The discrepancy would be lessened also if is smaller than has been assumed, if (for example) = 2.0 instead of 3.0 mag, then the region shortward of 1 m would conform to a 9000 K Planck function (early A type) and the () color to type F9 V (Table 8).
Neither assumption can be ruled out at this time. But the correct explanation of this discrepancy between color and spectral type may turn out to be very simple: that an object with a bizarre emission-line spectrum like MWC 778 cannot be expected to have the colors and energy distribution of a normal ZAMS star.
9 Final Remarks
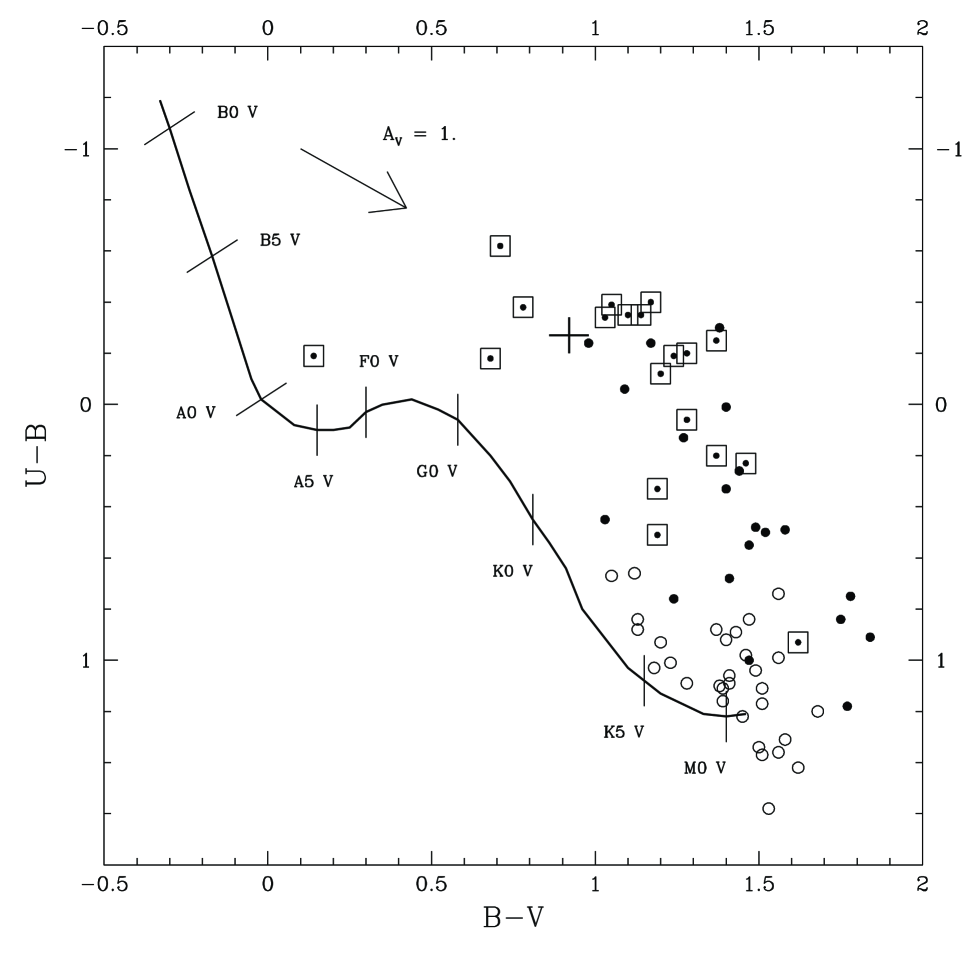
How is MWC 778 to be classified? Figure 13 shows the location of about 70 of the pre-main sequence stars of the Tau-Aur clouds in the (B-V),(U-B) plane, from the compilation of Kenyon & Hartmann (1995). Points in boxes are classical T Tauri Stars (CTTS) having (H) 60 Å (CTTS), solid points are CTTS having (H between 10 and 60 Å, and small open circles are weak-line T Tauri stars (WTTS; (H 10 Å). A large cross marks the location of MWC 778. Clearly, it falls among the CTTS, as would be expected from its large W(H), but it is earlier in type than most of the TTS in that area of Figure 13, and it is atypical also in the prominence of the Fe II spectrum and other forbidden lines as Ni II 7377, 7412 and Cr II 8000, and the weakness of the IR Ca II lines. Somewhat similar emission line patterns can be found among the stars observed by Hamann & Persson (1989) and Hamann (1994), which included LkH-101. Certainly, MWC 778 is of much higher luminosity than conventional TTS, as shown particularly by its SED.
If the MWC 778 point in Figure 13 is translated to the upper left along the reddening vector by mag, it approaches the ZAMS in the early B region, as would be expected from the fit to the dereddened SED shortward of 1 m described above.
On the basis of the evidence presented here, MWC 778 is an F- or G-type pre–main-sequence star several magnitudes above the ZAMS. It is not a T Tauri star, but might be considered a later-type analog of the HAeBe stars.
Our picture (§ 6.3) envisages disk structure concealed within the unresolved image of MWC 778. Perrin (2006) has suggested that there is a much larger disk also illuminated by MWC 778 that is outlined by the curved arc extending about 6 north of the star, and by its shorter extension to about 4 south. We have been referring to this structure as “the nebula.” Our discussion of its spectrum is based on a sample taken at the base of the northern arc about 3–5 west and northwest of the star (Fig. 3c). Perrin’s idea could be tested by high-resolution CO spectroscopy of the entire area.
We stress that the investigation of IC 2144, its contents, and its neighborhood has just begun, and that the values of distance and extinction that we have adopted are provisional. A closer examination of the absorption spectrum of MWC 778 is recommended. Very desirable would be a search for the faint H-emission stars that would be expected in and around IC 2144 if MWC 778 is in fact the most massive member of such a population. At longer wavelengths, high-resolution CO mapping of the nebula could be very worthwhile, for example because it is not obvious whether the ’reversed question mark’ seen against the bright background of IC 2144 (Figs. 2 and 3) represents a real feature or is simply the shadow of structure near MWC 778 thrown on that dust screen. An examination at longer IR wavelengths and in the submillimeter of MWC 778 is also desirable.
References
- Acke et al. (2005) Acke, B., van den Ancker, M. E., & Dullemond, C. P. 2005, A&A, 436, 209
- Allen (1974) Allen, D. 1974, MNRAS, 168, 1
- Bautista et al. (1995) Bautista, M. A., Depoy, D. L., Pradhan, A. K., Elias, J. H., Gregory, B., Phillips, M. M., & Suntzeff, N. B. 1995, AJ, 109, 729
- Bessell & Brett (1988) Bessell, M. S., & Brett, J. M. 1988, PASP, 100, 1134
- Blitz et al. (1982) Blitz, L., Fich, M., & Stark, A. A. 1982, ApJS, 49, 183
- Cardelli et al. (1989) Cardelli, J. A., Clayton, G. C., & Mathis, J. S. 1989, ApJ, 345, 256
- Chavarría-K. (1981) Chavarrìa-K., C. 1981, A&A, 101, 105
- Cohen (1973) Cohen, M. 1973, MNRAS, 164, 395
- Cushing et al. (2005) Cushing, M. C., Rayner, J. T., & Vacca, W. D. 2005, ApJ, 623, 1115
- Cushing et al. (2004) Cushing, M. C., Vacca, W. D., & Rayner, J. T. 2004, PASP, 116, 362
- García-Lario et al. (1997) Garcìa-Lario, P., Manchado, A., Pych, W., & Pottasch, S. R. 1997, A&AS, 126, 479
- Hamann (1994) Hamann, F. 1994, ApJS, 93, 485
- Hamann & Persson (1989) Hamann, F., & Persson, S. E. 1989, ApJS, 71, 931
- Herbig (1993) Herbig, G. H. 1993, ApJ, 407, 142
- Herbig & Bell (1988) Herbig, G. H., & Bell, K. R. 1988, Lick Obs. Bull. No. 1111
- Herbig et al. (2004) Herbig, G. H., Andrews, S. M., & Dahm, S. E. 2004, AJ, 128, 1233
- Hummer & Storey (1987) Hummer, D. G., & Storey, P. J. 1987, MNRAS, 224, 801
- Kenyon & Hartmann (1995) Kenyon, S. J., & Hartmann, L. 1995, ApJS, 101, 117
- Khanzadyan et al. (2002) Khanzadyan, T., Smith, M. D., Gredel, R., Stanke, T., & Davis, C. J. 2002, A&A, 383, 502
- Mathis (1990) Mathis, J. S. 1990, ARA&A, 28, 37
- Merrill & Burwell (1949) Merrill, P. W., & Burwell, C. G. 1949, ApJ, 110, 387
- Nussbaumer & Storey (1988) Nussbaumer, H., & Storey, P. J. 1988, A&A, 193, 327
- Perrin (2006) Perrin, M. 2006, Ph.D. thesis, Univ. of California, Berkeley
- Pradhan & Zhang (1993) Pradhan, A. K., & Zhang, H. L. 1993, ApJ, 409, L77
- Rayner et al. (2003) Rayner, J. T., Toomey, D. W., Onaka, P. M., Denault, A. J., Stahlberger, W. E., Vacca, W. D., Cushing, M. C., & Wang, S. 2003, PASP, 115, 362
- Rieke & Lebofsky (1985) Rieke, G. H., & Lebofsky, M. J. 1985, ApJ, 288, 618
- Rostopchina (1999) Rostopchina, A. N. 1999, Astron. Rep., 43, 113
- Sembach & Savage (1992) Sembach, K. R., & Savage, B. D. 1992, ApJS, 83, 147
- Suárez et al. (2006) Suárez, O., García-Lario, P., Manchado, A., Manteiga, M., Ulla, A., & Pottasch, S. R. 2006, A&A, 458, 173.
- Tokunaga et al. (2002) Tokunaga, A., Simons, D., & Vacca, W. D. 2002, PASP, 114, 180
- Vacca et al. (2003) Vacca, W. D., Cushing, M. C., & Rayner, J. T. 2003, PASP, 115, 389
- Vacca et al. (2004) Vacca, W. D., Cushing, M. C., & Rayner, J. T. 2004, PASP, 116, 352
- van der Plas et al. (2008) van der Plas, G., van den Ancker, M. E., Fedele, D., Acke, B., Dominik, C., Waters, L. B. F. M., & Bouwman, J. 2008, A&A, 485, 487
- Vieira et al. (2003) Vieira, S. L. A., Corradi, W. J. B., Alencar, S. H. P., Mendes, L. T. S., Torres, C. A. O., Quast, G. R., Guimar es, M. M., & da Silva, L. 2003, AJ, 126, 2971
- Wouterloot & Brand (1989) Wouterloot, J. G. A., & Brand, J. 1989, A&AS, 80, 149
- Xu et al. (1992) Xu , Y., McCray, R., Oliva, E., & Randich, S. 1992, ApJ, 386, 181
| Color | Source | Magnitude | FλaaThe flux densities (in Janskys) are from the MSX (Midcourse Space Experiment) and IRAS Point Source Catalogs. The IRAS values are not color corrected. | Color | Source | Magnitude | FλaaThe flux densities (in Janskys) are from the MSX (Midcourse Space Experiment) and IRAS Point Source Catalogs. The IRAS values are not color corrected. | |
|---|---|---|---|---|---|---|---|---|
| 1 | 13.45 | 3 | 6.3 | |||||
| 1 | 13.72 | [8.28] | MSX | 3.86 | ||||
| 1 | 12.80 | [8.6 | 3 | 2.9 | ||||
| 1 | 11.98 | [11.3] | 3 | 1.8 | ||||
| 1 | 11.30 | 12 m | IRAS | 6.40 | ||||
| 2 | 10.24 0.11 | [12.13] | MSX | 5.36 | ||||
| 4 | 10.14 | [14.65] | MSX | 6.01 | ||||
| 3 | 8.65 | [18] | 3 | 0.3 | ||||
| 2 | 8.96 0.03 | [21.3] | MSX | 36.61 | ||||
| 4 | 9.15 | 25 m | IRAS | 40.36 | ||||
| 3 | 7.84 | 60 m | IRAS | 97.49: | ||||
| 2 | 8.02 0.02 | 100 m | IRAS | 133.79: | ||||
| 4 | 8.08 |
| MWC 778 | B Stars | ||
|---|---|---|---|
| Wavelength | |||
| (Å) | (mÅ) | (km s-1) | (mÅ) |
| 5780.55 | 406. | +12. | |
| 5797.08 | 176. | +8. | 101. |
| 5849.81 | 60. | +13. | 42. |
| 6195.99 | 47. | +12. | 41. |
| 6379.22 | 76. | +14. | 58. |
| 6613.63 | 190. | +9. | 176. |
| 6699.28 | 22. | +11.: | 19. |
| aa Laboratory wavelength in air of strongest component. | bbObserved vacuum wavelength. | Flux | ccStatistical uncertainties. Absolute errors in both flux and equivalent width are expected to be %. | ccStatistical uncertainties. Absolute errors in both flux and equivalent width are expected to be %. | |||
|---|---|---|---|---|---|---|---|
| (m) | Identification | (m) | () | (Å) | (Å) | Note | |
| 0.822897 | Fe II () | 0.82318 | 6.44 | 0.34 | 2.30 | 0.12 | |
| 0.8288 | Fe II () | 0.82898 | 5.25 | 0.28 | 1.88 | 0.10 | |
| ? | 0.83052 | 3.78 | 0.32 | 1.35 | 0.11 | broad | |
| 0.834555 | H I (Pa23) | 0.83475 | 1.35 | 0.18 | 0.50 | 0.07 | |
| 0.835723 | H I (Pa22) + Fe II () | 0.83601 | 3.60 | 0.23 | 1.34 | 0.09 | |
| 0.837447 | H I (Pa21) | 0.83763 | 2.89 | 0.24 | 1.09 | 0.09 | |
| 0.839240 | H I (Pa20) | 0.83947 | 4.08 | 0.25 | 1.61 | 0.10 | |
| 0.841332 | H I (Pa19) | 0.84172 | 7.19 | 0.38 | 2.84 | 0.15 | |
| 0.84465 | O I () + H I (Pa18) | 0.84474 | 60.65 | 0.45 | 24.73 | 0.21 | |
| 0.846726 | H I (Pa17) | 0.84695 | 11.44 | 0.36 | 4.77 | 0.15 | |
| 0.850248 | H I (Pa16) + Fe II () | 0.85014 | 20.00 | 0.46 | 8.55 | 0.20 | blend |
| + Ca II ()? | |||||||
| 0.854539 | H I (Pa15) + Ca II ()? | 0.85469 | 15.49 | 0.34 | 6.77 | 0.15 | |
| 0.859839 | H I (Pa14) | 0.86006 | 15.24 | 0.31 | 6.73 | 0.14 | |
| 0.861696 | [Fe II] () | 0.86179 | 2.24 | 0.20 | 0.99 | 0.09 | |
| 0.866502 | H I (Pa13) + Ca II ()? | 0.86668 | 18.20 | 0.34 | 7.99 | 0.15 | |
| 0.868028 | N I () ? | 0.86838 | 3.44 | 0.25 | 1.51 | 0.11 | wing |
| 0.875047 | H I (Pa12) | 0.87530 | 18.63 | 0.35 | 8.16 | 0.15 | |
| 0.886279 | H I (Pa11) | 0.88654 | 22.33 | 0.38 | 9.73 | 0.17 | |
| 0.892665 | Fe II () | 0.89289 | 4.52 | 0.24 | 1.96 | 0.10 | |
| 0.901491 | H I (Pa10) | 0.90172 | 22.87 | 0.37 | 9.90 | 0.16 | |
| 0.907549 | Fe II () | 0.90777 | 4.65 | 0.25 | 2.00 | 0.11 | |
| 0.909483 | C I () | 0.90978 | 3.56 | 0.26 | 1.53 | 0.11 | |
| + Fe II () ? | |||||||
| 0.912292 | Fe II () | 0.91253 | 4.11 | 0.24 | 1.76 | 0.10 | blend |
| 0.913238 | Fe II () | 0.91343 | 3.81 | 0.23 | 1.63 | 0.10 | blend |
| 0.917805 | Fe II () | 0.91797 | 7.36 | 0.31 | 3.14 | 0.13 | |
| + Fe II () | |||||||
| 0.920313 | Fe II () | 0.92051 | 7.53 | 0.25 | 3.21 | 0.11 | wing |
| 0.922901 | H I (Pa9) + Mg II () | 0.92276 | 38.56 | 0.38 | 16.44 | 0.17 | blend/ |
| + [Fe II] ()? | broad | ||||||
| 0.924427 | Mg II () | 0.92473 | 8.74 | 0.21 | 3.75 | 0.09 | wing |
| 0.926599 | O I () | 0.92680 | 2.99 | 0.17 | 1.28 | 0.07 | |
| 0.9297 | Fe II () | 0.93011 | 3.04 | 0.20 | 1.30 | 0.09 | |
| + Fe II () ? | |||||||
| 0.93889 | Fe II () ? | 0.93920 | 5.73 | 0.22 | 2.46 | 0.09 | blend |
| N I () ? | |||||||
| 0.940573 | C I () | 0.94078 | 2.64 | 0.18 | 1.13 | 0.08 | |
| + Fe II () ? | |||||||
| 0.942843 | Fe II () | 0.94304 | 1.08 | 0.15 | 0.46 | 0.07 | |
| 0.949779 | Fe II () | 0.94999 | 2.27 | 0.17 | 0.97 | 0.07 | |
| 0.954598 | H I (Pa ) | 0.95485 | 32.72 | 0.25 | 14.04 | 0.11 | |
| 0.957258 | Fe II () | 0.95743 | 6.37 | 0.17 | 2.73 | 0.07 | |
| 0.961494 | Fe II () | 0.96183 | 2.31 | 0.17 | 0.99 | 0.07 | |
| 0.981210 | Fe II () | 0.98147 | 2.59 | 0.14 | 1.09 | 0.06 | |
| 0.985026 | [C I] () | 0.98521 | 1.76 | 0.15 | 0.73 | 0.06 | |
| ? | 0.98824 | 1.26 | 0.11 | 0.52 | 0.05 | ||
| 0.989481 | Fe II () | 0.98969 | 2.31 | 0.13 | 0.95 | 0.05 | |
| 0.991028 | Fe II () | 0.99128 | 1.78 | 0.12 | 0.73 | 0.05 | |
| 0.995628 | Fe II () | 0.99584 | 3.04 | 0.13 | 1.25 | 0.06 | |
| 0.999756 | Fe II () | 1.00001 | 29.78 | 0.17 | 12.19 | 0.07 | |
| 1.004937 | H I (Pa ) | 1.00521 | 43.45 | 0.21 | 17.83 | 0.09 | |
| 1.011248 | N I () ? | 1.01136 | 1.53 | 0.15 | 0.63 | 0.06 | |
| ? | 1.01327 | 1.07 | 0.14 | 0.44 | 0.06 | ||
| 1.017349 | Fe II () | 1.01763 | 8.43 | 0.20 | 3.49 | 0.08 | |
| 1.028673 | [S II] () | 1.02891 | 1.35 | 0.14 | 0.56 | 0.06 | |
| 1.032049 | [S II] () | 1.03232 | 1.71 | 0.14 | 0.71 | 0.06 | |
| 1.033641 | [S II] () | 1.03383 | 0.70 | 0.12 | 0.29 | 0.05 | |
| 1.0398 | [N I] () | 1.04009 | 1.37 | 0.19 | 0.57 | 0.08 | blend |
| 1.0407 | [N I] () | 1.04089 | 1.40 | 0.18 | 0.58 | 0.07 | blend |
| 1.043254 | [Fe II] () ? | 1.04375 | 3.37 | 0.15 | 1.40 | 0.06 | |
| 1.045969 | [Ni II] () ? | 1.04613 | 1.33 | 0.14 | 0.55 | 0.06 | |
| 1.049930 | Fe II () | 1.05024 | 26.60 | 0.21 | 11.00 | 0.09 | |
| 1.052512 | Fe II () | 1.05279 | 4.55 | 0.16 | 1.88 | 0.07 | |
| 1.054648 | Fe II () | 1.05484 | 2.15 | 0.14 | 0.89 | 0.06 | |
| 1.0686 | C I () | 1.06898 | 5.01 | 0.17 | 2.04 | 0.07 | broad |
| 1.071106 | Fe II () | 1.07131 | 1.76 | 0.15 | 0.72 | 0.06 | |
| 1.0830 | He I () | 1.08350 | 19.67 | 0.29 | 8.06 | 0.12 | |
| 1.086265 | Fe II () | 1.08660 | 23.47 | 0.26 | 9.63 | 0.11 | |
| 1.09130 | He I () ? | 1.09165 | 6.07 | 0.21 | 2.49 | 0.08 | wing |
| + Mg II ()? | |||||||
| 1.093810 | H I (Pa ) + Mg II ()? | 1.09416 | 71.26 | 0.31 | 29.31 | 0.13 | |
| 1.112557 | Fe II () | 1.11285 | 16.59 | 0.25 | 6.79 | 0.10 | |
| 1.1287 | O I () | 1.12898 | 31.88 | 0.28 | 13.03 | 0.11 | |
| 1.1754 | C I () | 1.17554 | 3.27 | 0.15 | 1.33 | 0.06 | |
| ? | 1.23289 | 0.59 | 0.10 | 0.24 | 0.04 | ||
| 1.23836 | Fe II () | 1.23877 | 0.67 | 0.11 | 0.27 | 0.04 | |
| 1.24303 | Fe II () | 1.24343 | 0.86 | 0.10 | 0.34 | 0.04 | |
| ? | 1.24703 | 2.71 | 0.14 | 1.08 | 0.06 | broad | |
| 1.256680 | [Fe II] () | 1.25713 | 9.57 | 0.13 | 3.79 | 0.05 | |
| ? | 1.26009 | 1.74 | 0.11 | 0.69 | 0.04 | ||
| 1.278776 | [Fe II] () | 1.27916 | 2.06 | 0.10 | 0.81 | 0.04 | wing |
| 1.281808 | H I (Pa ) | 1.28208 | 118.51 | 0.20 | 46.29 | 0.08 | |
| 1.294268 | [Fe II] () | 1.29465 | 1.45 | 0.11 | 0.56 | 0.04 | |
| 1.3164 | O I () | 1.31671 | 22.88 | 0.15 | 9.04 | 0.06 | |
| 1.320554 | [Fe II] () | 1.32089 | 2.25 | 0.11 | 0.89 | 0.04 | |
| 1.327776 | [Fe II] () | 1.32812 | 0.95 | 0.12 | 0.38 | 0.05 | |
| ? | 1.34361 | 0.83 | 0.12 | 0.33 | 0.05 | ||
| 1.493773 | H I (Br26) | 1.49400 | 0.86 | 0.22 | 0.34 | 0.09 | |
| 1.496734 | H I (Br25) | 1.49720 | 1.05 | 0.21 | 0.42 | 0.08 | |
| 1.500086 | H I (Br24) | 1.50051 | 1.56 | 0.24 | 0.62 | 0.10 | |
| 1.503904 | H I (Br 23) | 1.50420 | 1.14 | 0.21 | 0.46 | 0.08 | abs |
| 1.508278 | H I (Br22) | 1.50864 | 2.64 | 0.28 | 1.06 | 0.11 | |
| 1.513322 | H I (Br21) | 1.51368 | 3.15 | 0.26 | 1.27 | 0.10 | |
| 1.519184 | H I (Br20) | 1.51944 | 3.80 | 0.19 | 1.53 | 0.08 | |
| 1.526054 | H I (Br19) | 1.52626 | 4.14 | 0.18 | 1.68 | 0.07 | |
| 1.534179 | H I (Br18) + [Fe II] () | 1.53428 | 6.74 | 0.22 | 2.74 | 0.09 | |
| 1.543892 | H I (Br17) | 1.54426 | 5.84 | 0.20 | 2.37 | 0.08 | |
| 1.555645 | H I (Br16) | 1.55602 | 6.42 | 0.21 | 2.60 | 0.09 | |
| 1.570066 | H I (Br15) | 1.57052 | 7.77 | 0.23 | 3.16 | 0.09 | |
| ? | 1.57580 | 3.41 | 0.17 | 1.39 | 0.07 | ||
| 1.588054 | H I (Br14) | 1.58817 | 8.30 | 0.18 | 3.36 | 0.08 | |
| 1.599473 | [Fe II] () | 1.59995 | 1.64 | 0.14 | 0.66 | 0.06 | |
| 1.610931 | H I (Br13) | 1.61132 | 10.60 | 0.19 | 4.29 | 0.08 | |
| 1.640719 | H I (Br12) | 1.64103 | 10.06 | 0.17 | 4.04 | 0.07 | |
| 1.643550 | [Fe II] () | 1.64397 | 8.98 | 0.14 | 3.60 | 0.06 | |
| 1.680652 | H I (Br11) + [Fe II] () | 1.67992 | 20.66 | 0.26 | 8.28 | 0.10 | blend/ |
| + Fe II () | broad | ||||||
| 1.687320 | Fe II () | 1.68771 | 17.35 | 0.20 | 6.95 | 0.08 | |
| ? | 1.69859 | 1.10 | 0.16 | 0.44 | 0.07 | ||
| 1.736211 | H I (Br10) + Fe II () | 1.73618 | 13.94 | 0.22 | 5.61 | 0.09 | blend |
| 1.741401 | Fe II () | 1.74176 | 5.64 | 0.18 | 2.27 | 0.07 | |
| 1.744934 | [Fe II] () ? | 1.74562 | 1.04 | 0.13 | 0.42 | 0.05 | |
| 1.755168 | Fe II () ? | 1.75598 | 0.87 | 0.15 | 0.35 | 0.06 | |
| 1.944556 | H I (Br ) | 1.94487 | 15.61 | 0.46 | 6.38 | 0.19 | |
| 1.957204 | Fe II () | 1.95761 | 4.99 | 0.27 | 2.05 | 0.11 | |
| 1.974611 | Fe II () ? | 1.97513 | 5.13 | 0.28 | 2.13 | 0.12 | |
| ? | 1.98775 | 1.06 | 0.24 | 0.44 | 0.10 | ||
| ? | 2.00180 | 2.21 | 0.19 | 0.91 | 0.08 | ||
| 2.015123 | [Fe II] () ? | 2.01571 | 0.77 | 0.18 | 0.32 | 0.07 | |
| 2.046005 | [Fe II] () | 2.04647 | 0.56 | 0.10 | 0.24 | 0.04 | |
| 2.060025 | Fe II () | 2.06023 | 2.72 | 0.12 | 1.15 | 0.05 | |
| + He I () ? | |||||||
| 2.088810 | Fe II () ? | 2.08942 | 4.52 | 0.13 | 1.92 | 0.05 | |
| ? | 2.11798 | 0.27 | 0.09 | 0.11 | 0.04 | ||
| 2.121254 | H2 (1,0)S(1) | 2.12182 | 0.81 | 0.08 | 0.35 | 0.04 | |
| 2.165529 | H I (Br ) | 2.16590 | 24.44 | 0.19 | 10.57 | 0.08 | |
| ? | 2.22401 | 0.68 | 0.13 | 0.30 | 0.06 | ||
| ? | 2.24107 | 0.52 | 0.10 | 0.23 | 0.05 | ||
Note. — “blend” = obvious blend of multiple components; “broad” = conspicuously broader than other lines; “wing” = line is in the wing of a much stronger neighbor; “abs” = line appears to be sitting in an absorption trough; “?” = identification uncertain.
| Segment | 6300 | Continuum | Ratio |
|---|---|---|---|
| A | 2.71 | 0.64 | 4.23 |
| B | 4.58 | 1.00 | 4.58 |
| C | 3.01 | 0.85 | 3.54 |
| D | 1.41 | 0.53 | 2.66 |
| H | 6300 | ||||||||
|---|---|---|---|---|---|---|---|---|---|
| Source | (Å) | (km s-1) | (Å) | (km s-1) | (Å) | (km s-1) | (Å) | (km s-1) | |
| Star 2003 Dec | 164. | + 73.aa The main peak of the H emission line is at +73. km s-1, the shortward minor peak is at 115. km s-1, and the interpeak minimum is at 64. km s-1. | 0.72 | +13. | 0.70 | +30. | |||
| Star 2004 Nov | 154. | + 68.bb The main peak of the H emission line is at + 68. km s-1, the shortward minor peak is at 98. km s-1, and the interpeak minimum is at 59. km s-1. | 0.74 | +13. | 0.61 | +29. | |||
| Nebula at A | 136. | + 57. | 0.35 | + 1. | 0.66 | +13. | |||
| Nebula at B | 137. | + 50. | 0.27 | + 3. | 0.97 | +13. | |||
| Nebula at C | 116 | + 52. | 0.36 | + 2. | 0.90 | +13. | |||
| Nebula at D | 103. | + 54.: | 0.4: | + 4. | 0.4: | +12. | |||
| Nebula 3 NW of star | 154. | + 49. | 1.27 | +14. | |||||
| Wavelength | (star) | (nebula) | Wavelength | (star) | (nebula) | ||||
|---|---|---|---|---|---|---|---|---|---|
| Ion | (Å) | RMT | (Å) | (Å) | Ion | (Å) | RMT | (Å) | (Å) |
| Ni II | 6666.82 | 0.21 | 0.03 | Fe II | 5158.78 | 19F | 1.57 | 0.21 | |
| Fe II | 6456.39 | 74 | 1.3 | 1.12 | Fe II | 5111.63 | 19F | 0.14 | 0.02 |
| Fe II | 6416.92 | 74 | 0.22 | 0.25: | Fe II | 5018.43 | 42 | 4.1 | 3.55 |
| Fe II | 6317.99 | 1.62 | 0.88 | Fe II | 4973.39 | 20F | 0.22 | 0.02 | |
| Fe II | 6247.54 | 74 | 0.72 | 0.54 | Fe II | 4950.74 | 20F | 0.20 | 0.02 |
| Fe II | 5835.49 | 0.10 | 0.09: | Fe II | 4947.37 | 20F | 0.13: | 0.02 | |
| Fe II | 5746.97 | 34F | 0.20 | 0.02 | Fe II | 4923.93 | 42 | 3.1 | 3.4 |
| Fe II | 5534.83 | 0.37 | 0.25 | Fe II | 4905.34 | 20F | 0.38 | 0.1 | |
| Fe II | 5527.34 | 17F | 0.31 | 0.03 | Fe II | 4874.48 | 20F | 0.18 | 0.04: |
| Fe II | 5433.13 | 18F | 0.29: | 0.03 | Fe II | 4814.53 | 20F | 0.97 | 0.16 |
| Fe II | 5376.45 | 19F | 0.54 | 0.04: | Fe II | 4774.72 | 20F | 0.19 | 0.04 |
| Fe II | 5362.87 | 49 | 0.46 | 0.24 | Fe II | 4639.67 | 4F | 0.15 | 0.02 |
| Fe II | 5316.62 | 49 | 2.7: | 2.6: | Fe II | 4629.34 | 37 | 1.00 | 0.55 |
| Fe II | 5296.83 | 19F | 0.09 | 0.03 | Fe II | 4583.83 | 38 | 1.62 | 0.86 |
| Fe II | 5261.62 | 19F | 0.75 | 0.02 | Fe II | 4555.89 | 37 | 0.9: | 1.3 |
| Fe II | 5234.62 | 49 | 1.15 | 1.0 | Fe II | 4549.47 | 38 | 1.15 | 1.6 |
| Fe II | 5220.06 | 19F | 0.16 | 0.05 | Fe II | 4515.34 | 37 | 0.52 | 0.52 |
| Fe II | 5181.95 | 18F | 0.12 | 0.02 |
| 6717 | 6730 | |||||
|---|---|---|---|---|---|---|
| Source | (mÅ) | (km s-1) | (mÅ) | (km s-1) | log aa = 104 K is assumed. | |
| Star 2003 Dec | 52. | +16. | 118.:bb In the star, the emission line at 6730 Å is a blend of [S II] 6730.87 and [Fe II] 6729.856. The [Fe II] contribution was removed by assuming it had the same profile as [Fe II] 6809.226, of the same multiplet, as measured on the 2004 exposure. | +13. | 4.8: | |
| Star 2004 Nov | 47. | +13. | 106.:bb In the star, the emission line at 6730 Å is a blend of [S II] 6730.87 and [Fe II] 6729.856. The [Fe II] contribution was removed by assuming it had the same profile as [Fe II] 6809.226, of the same multiplet, as measured on the 2004 exposure. | +16. | 4.7: | |
| Nebula at A | 128. | +14.: | 145. | +10. | 3.0 | |
| Nebula at B | 185. | +11. | 240. | +11. | 3.2 | |
| Nebula at C | 330. | 0. | 388. | + 1. | 3.0 | |
| Nebula 3 NW of star | 145. | +11. | 188. | + 9. | 3.2 | |
| Sp. type | ||||
|---|---|---|---|---|
| having | if | |||
| distance (kpc) is | ||||
| (mag) | color | 0.7 | 1.0 | 1.3 |
| 2.0 | F9 V | +1.6 | +0.8 | +0.3 |
| 2.5 | F3 V | +1.1 | +0.3 | 0.2 |
| 3.0 | A5 V | +0.6 | 0.2 | 0.7 |