Predicting Transcription Factor Specificity with All-Atom Models
Abstract
The binding of a transcription factor (TF) to a DNA operator site can initiate or repress the expression of a gene. Computational prediction of sites recognized by a TF has traditionally relied upon knowledge of several cognate sites, rather than an ab initio approach. Here, we examine the possibility of using structure-based energy calculations that require no knowledge of bound sites but rather start with the structure of a protein-DNA complex. We study the PurR E. coli TF, and explore to which extent atomistic models of protein-DNA complexes can be used to distinguish between cognate and non-cognate DNA sites. Particular emphasis is placed on systematic evaluation of this approach by comparing its performance with bioinformatic methods, by testing it against random decoys and sites of homologous TFs. We also examine a set of experimental mutations in both DNA and the protein. Using our explicit estimates of energy, we show that the specificity for PurR is dominated by direct protein-DNA interactions, and weakly influenced by bending of DNA.
keywords:
protein-DNA interaction \septranscription-factor binding sites \sepgene regulation \sepmutant binding site prediction \sepPurR[cor]Corresponding author. and
1 Introduction
Binding of cognate sites of DNA is central to many essential biological processes. Most of DNA-binding proteins have the ability to recognize and tightly bind cognate DNA sequences (sites). To find sites bound by a particular DNA-binding protein, one needs to calculate the free energy of binding for the protein and possible DNA sites and then select sites that provide sufficiently low binding energy. A widely used approach to find sites for a DNA-binding protein is to assume a form of the energy function, infer its parameters, and to then calculate the energy for all sites in a genome. To infer parameters one needs to have a set of known sites bound by the protein. Given these known sites, the parameters are inferred using either a widely used Berg-von Hippel approximation [1], or by other recently proposed methods [2, 3, 4]. This constitutes a physical basis for many widely used bioinformatics techniques that rely on a particular form of the energy function known as a position-specific weight matrix (PWM).
All these methods require a priori knowledge of the sites (or at least longer sequences containing these sites) bound by the protein. This data is available for only a small number of DNA-binding proteins. For many DNA-binding proteins, however, their sequence of amino-acids is well known. Sufficiently high evolutionary conservation of DNA-binding domains, and the availability of crystal structures for many of them, makes it possible to construct 3D models for a broad range of DNA-binding proteins. Can such protein structures be used to predict sites recognized by a DNA-binding protein? The basic procedure for structure-based methods is to compute the binding energy of the protein-DNA complex. The structure of the complex for an arbitrary DNA sequence can be modeled by replacing (“mutating”) the DNA sequence in the protein structure containing its cognate site, followed by energy minimization and/or molecular dynamics to allow the protein-DNA complex to adjust to the new DNA sequence. After several minimization steps the interaction energy can be calculated using either standard molecular mechanics force fields like AMBER [5] or CHARMM [6] with an implicit solvent, or a knowledge-based force field optimized for the particular complex [7].
Several recent studies have significantly elaborated upon the above procedure. Lafontaine and Lavery, for example, pioneered a very efficient process termed ADAPT [8] in which they replace the DNA in the structure by a ‘multicopy’ or ‘average’ piece of DNA. The structure is only minimized once after which the energy of the complex is measured for all possible DNA sequences in place of the average piece. From this, only the energy of the unbound DNA must be subtracted. The unbound protein energy is the same for all DNA sequences and hence irrelevant for comparisons. This approach is so efficient that all possible sequences ( for bases) for short DNA operator sites can be evaluated. Their results successfully identify the experimental consensus sequence for a variety of DNA-binding proteins [9, 10], and the ordering of binding free energies for DNA point mutations in several complexes [9]. In this context, it was also noted that the actual binding energy computed via minimizations is incorrect and cannot be compared to experiments quantitatively.
Endres, Schulthess, and Wingreen allowed protein side chains to explore rotamer conformations in their study of Zif268 [11]. Interestingly, the agreement with experiments becomes worse when rotamers are considered, which points to a potential bias of the approach towards sequences similar to the one on which the underlying experimental structure is based. Morozov et al. [12] predict binding affinities using energy measurements as well, they keep their structures rigid or allow them to relax and compare the two approaches. However, instead of considering their binding energies to be approximately equal to free energies as we do, they fit their energies to a few experimentally known free energies. They assign different weights to the energies involved, e.g., the Lennard-Jones or the electrostatic energy, and optimize the weights so that the sum matches the free energy. They proceed to study several transcription factors and even find consensus sequence logos for two transcription factors whose structures they construct by homology modeling. In recent work, Donald et al. [7] focus on direct protein-DNA interactions. They study and compare a number of potentials and propose some that outperform the standard Amber potential. All these efforts represent pioneering work in the emerging field of structure-based predictions of transcription factor specificity.
Here we explore whether widely available molecular dynamics (MD) force fields can be used to calculate the binding free energy from all-atom models of the protein-DNA complex. In contrast to some of the previous studies, we (i) assess the power and limitations of the method in dealing with the roughly decoy sites of bacterial genomes (by computing binding energies for representative mutations and assembling an energy-based weight matrix (EBWM), which is then used for the task); (ii) explore whether energy-minimization methods utilizing MD force fields can predict protein-DNA binding when DNA sites, or the protein, are mutated.
For our study we focus on the purine repressor, PurR, from E. coli, a well-characterized transcription factor with more than 20 known sites in the genome. The purine repressor is a member of the sizable LacI family, which is often regarded as a model system for transcription regulation. The abundance of both experimental [13] and bioinformatics [14] data make this an ideal target for testing structure-based prediction techniques, and to study their assets and drawbacks.
We demonstrate that generic molecular dynamics tools predict favorable binding energies for known cognate sites. To quantify the power and limitations of this approach we investigated the following: (i) Can we recognize the cognate sites from a large set of decoys, and estimate the number of false positives? (ii) How does the performance in the above test compare with that of a motif obtained from the set of cognate sites by bioinformatic methods? By calculating binding energies we can also answer the following questions which are not addressable by bioinformatic means: (i) What is the relative importance to recognition of direct binding energies to indirect factors such as DNA bending? (ii) Can the computed results for of mutations in DNA, and more importantly in the protein, be compared to experiment?111Bioinformatics data can also be converted to compute for DNA, but not protein, mutations as in Refs. [1, 2, 3, 4].
To test the ability of the force field to discriminate between cognate sites and random decoys, we developed a procedure to speed up calculations and the screening of many sites. We find that a single cognate site can be discriminated from about 7000 random decoy sites. While such performance is impressive, it is insufficient to detect sites from the whole bacterial genome. In the comparisons of our results with experimental binding free energies for DNA and amino acid point mutations, we obtain the correct order of binding free energies of the mutants.
2 Materials and Methods
The change in free energy due to protein-DNA interactions can be decomposed as
| (1) |
Clearly, depends on both the particular DNA sequence and the protein. In order to simplify the problem from a computational point of view, it is often assumed that the differences in for two different DNA sequences are dominated by differences in enthalpy. Entropic contributions are usually ignored since the entropy losses upon binding for both the fragment of DNA and the protein are likely not to depend significantly on the DNA sequence; hence
| (2) |
Furthermore, if DNA sequences bound by the same protein are compared and is of interest, the term cancels out.
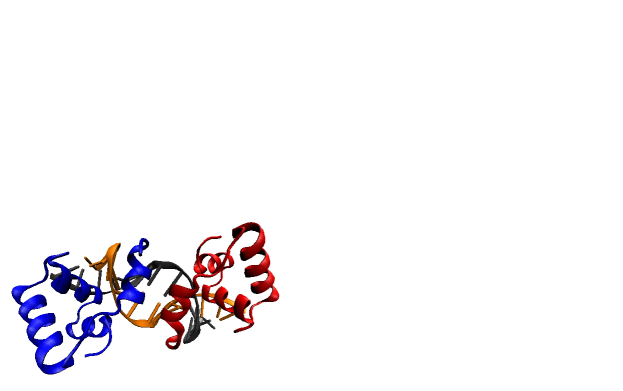
The energies of the molecules were measured after minimizing the energy of their structures using the AMBER software package, its force field, and an implicit water model. The reference structure in this study is 1qpz [15], a wild-type PurR structure bound to DNA. The sequence of the DNA is also the consensus sequence obtained in the bioinformatics study of Ref. [14] and we shall thus refer to it as the consensus sequence. The structure, depicted in Fig. 1, was reduced to its 60 amino acid headpiece, and the DNA was trimmed to the 16 base pair consensus sequence. The first amino acid is missing and was not inserted artificially. The reference for straight DNA was taken and trimmed from the first model of the non-cognate LacI-DNA binding complex 1osl [16]. DNA sequences were exchanged with the 3DNA computer application [17]. The experimental DNA backbone remained in place, only the base pairs were replaced. The free DNA molecule obtained in this manner deviates from a ‘perfect’ B-DNA molecule by about RMS. While the experimentally derived straight DNA molecule was preferred over one with average coordinates, this choice had no significant impact on our results. The standard deviation of the energy difference between the canonical B-DNA structures and ours is merely for the 50 random DNA sequences that were used (see below). Also, for example, the linear correlation coefficient of between bioinformatics scores and binding energies for the random sequences discussed below does not change at all. Protein mutants were generated with the Mutator 1.0 plugin built into VMD [18]. The software uses psfgen to build a new side chain from pre-defined parameters for the CHARMM force field; this structure is not relaxed further by VMD. But the mutated side chain assumes a low-energy conformation during energy minimization because -unlike the original residues- mutated residues were not constrained to remain close to the coordinates of the original structure (see below). For the study of DNA point mutations the respective structures 1qp0, 1qp4, 1bdh, 1qqb, 1qp7, 1qqa from Ref. [15] were used in addition to 1qmz. We applied psfgen to combine and prepare structures for minimization.
It should be noted that the conformational energy of the free unbound protein structure (Eqs. (2) and (6)) was not considered in most cases because we were only interested in differences between complexes. For example, (Eq. (6)) is simply the energy difference between the two bound protein structures. In our investigation of amino acid mutations we approximated in Eq. (2) with , i.e., the self-energy of the protein in the bound complex. Again, this approximation is reasonable as we were only interested in differences of the binding energy between mutant complexes.
For all computations we used the Amber 9 program with the parm99 force field [5], and the second implicit water model from Ref. [19]. No cut-off was applied. Hydrogen atoms and the nucleic bases, as well as substituted residues in our amino acid mutation study, were allowed to rearrange freely to eliminate steric clashes. The movement of the protein and the DNA backbone was restricted by springs with a spring constant of . 2500 steepest-descent and 2500 conjugate-gradient minimization steps were applied to each configuration before energies were calculated to ensure convergence. A typical minimization run for a protein-DNA complex took about four hours on a 3 Ghz Pentium 4 desktop computer.
While the relaxation of the structures is an essential element of our method, we cannot allow energy minimization to proceed unhindered. This is because (1) we do not fully trust the potentials, and (2) the finite temperature fluctuations (not included) may prevent the structure moving into certain energy wells. As mentioned in the Introduction, previous work has indicated that the more the complex is allowed to move away from the known experimental structure [11, 12], the less reliable are the energy-based methods in predicting binding specificity. The springs introduced in the previous paragraph limit the drift of the structure, but their strength is an additional parameter of the problem. In practice, for the spring constant we employ, the rmsd of the protein backbone changes by about from the native structure. Fortunately, we find that the relevant aspects of the binding, namely the relative preferences to different sequences, are independent of the choice of the spring constant as long as the structures’ integrity is preserved. This conclusion was reached after performing studies with spring constants of , and .
3 Results
3.1 Comparison with Bioinformatics Scores
In order to assess the quality of binding predictions based on the all-atom calculations we compared them with predictions made using a bioinformatic technique The PurR transcription factor has been studied extensively and is therefore particularly well-suited for this task. Mironov and co-workers [14] compiled a collection of 21 binding sites to which PurR is considered to bind in E. coli. Assuming independence of the influence of different base pairs on specificity, they set up a position-specific weight matrix (PWM) that we use to calculate bioinformatics scores for various DNA sequences. Given a sufficient number of known sites, PWM scores provide a good approximation of experimentally measured binding energies [20, 21, 22] and have sufficient specificity to detect binding sites in bacterial genomes [23].
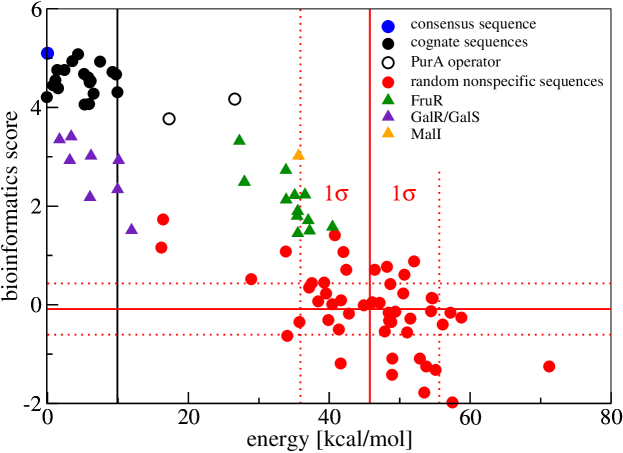
We challenged our structure-based approach, which uses only one known site that is a part of the crystal structure, to detect cognate sites among random ones using the binding energies after minimization. These energies were also compared to the PWM scores. In particular, we examined the consensus sequence, the binding sequences, random sequences, and several binding sites of closely related transcription factors FruR, GalR/GalS, and MalI. Sites of homologous transcription factors were chosen because they constitute particularly challenging sites that are similar to PurR cognate sites and share the same palindromic structure. As shown in Fig. 2, bioinformatics scores and binding energies correlate well with a linear correlation coefficient of for the random sequences and for all sequences displayed. The bioinformatics consensus sequence has the second lowest energy and random non-cognate sequences are generally well-separated from cognate sequences. While the separation between cognate sites and the random decoys is reassuring, it is important to find out whether the procedure is able to find cognate sites among other sites (decoys) on the bacterial genome.
Assuming a Gaussian distribution of the binding energies for random sites, we can estimate the number of decoys that have binding energies comparable to the cognate sites. The distance between the average of the random sequences (red line) and the third worst cognate site (black line) is . (We chose the third worst cognate site because the two next sequences are the PurA operator sites, see next paragraph.) This roughly amounts to one false positive hit in random sites. Note that 50 random sequences can only yield a rough estimate for this number. This number is quite encouraging although it should only be considered a rough estimate. For comparison, the corresponding PWM bioinformatics scores from Ref. [14] are separated by 4.55 which would amount to 1 false positive hit in sequences. (The K12 E. coli genome [24] consists of 4.64 Mbps).
The two cognate sequences with the highest energies are the two PurA operators (unfilled black circles). Indeed, the suggestion that the PurA operon may be regulated by PurR is controversial (see Refs. [14, 25, 26]). Although at the lower end of the spectrum, the bioinformatic scores for these sites are comparable with other cognate sites, while our computations give distinctly higher binding energies.
Testing the energy-based approach on operator sites regulated by other members of the LacI family is a particularly challenging task. Although the FruR and MalI binding sequences are energetically well separated from the PurR cognate sequences, GalR/GalS binding sequences are not. (The bioinformatics score appears to have less difficulty with these sites.)
Finally, we would like to point out that the absolute energy scale is incorrect, in line with the conclusions of Ref. [9]. Excluding PurA, the range of binding energies for cognate sequences is which is clearly too large. The underlying assumptions and approximations of the method are, however, quite considerable and quantitative agreement cannot really be expected.
3.2 Direct and Indirect Contributions to the Binding Energy, Sequence Logos
The binding free energies can be subdivided into two parts: Direct interactions between the transcription factor and DNA, and indirect contributions due to sequence-specific DNA bending. In recent work, Paillard and Lavery [9] noted that the level of each contribution varies significantly from complex to complex. Their method is based on a careful analysis of a subset of sequences with particularly low binding energies, after having computed the energies of all possible sequences. Here, we propose a simple method which can distinguish between contributions of bending and protein-DNA interactions on the basis of a rather limited set of measurements.
To understand the source of the sequence specificity of PurR, we partitioned its binding energy as follows:
| (3) |
where
| (4) |
| (5) |
and
| (6) |
We next computed direct and indirect contributions for both cognate and random sequences and compare the differences: On average, was lower by for the cognate sites compared to random ones, and lower by . Assuming that the force field reproduces the correct ratios of direct and indirect contributions, specificity towards PurR is predominantly determined by protein-DNA interactions. It is interesting to note that was slightly higher for cognate sites () indicating that the interactions were strong enough to bend the protein towards a slightly unfavorable position.
To study the contribution of individual base pairs to specificity, and to significantly speed up computations, we used energy minimization to calculate a position-specific energy matrix, analogous to PWM [14]. As specificity towards PurR is dominated by direct, pairwise interactions, we computed the change in due to each possible single mutation of the consensus sequence and set up an energy-based weight matrix EBWM (Table 1a). (While it is in principle possible to construct a statistical weight matrix based on the top 21 sites identified by energy minimization, this would effectively reproduce the experimental PWM of Ref. [14].) The interaction energy for an arbitrary DNA sequence can now be computed by adding the appropriate base pair energies. This requires only a limited number of computations at the cost of being less accurate.
Although computationally efficient, both EBWM and PWM methods are based on the assumption that the contributions of individual base pairs are independent from each other, neglecting many-body effects, such as due to solvation. EBWM calculated using also ignores sequence-dependent contributions of DNA deformation to the binding energy. Can we improve upon this by taking the bending energy into account?
The DNA bending energy cannot be easily decomposed into contributions of individual base pairs; the energetic contribution of a single base pair to DNA bending not only depends on its neighbors but on the whole sequence. This makes the exact treatment of the problem computationally challenging. Lavery and coworkers [8, 9, 10] address this issue by constructing an ’average structure’ into which they can substitute all possible sequences and create a sequence logo based on the sequences with the lowest energy. Endres et al. [11, 27] employ an efficient scheme to screen sequences and only compute those which look promising. Thus they afford to compute bending energies for each individual sequence.
We sought to improve the EBWM approximation by making a “zeroth order” estimate of the bending energy. The bending energy can also be subdivided into two parts: interactions between base pairs and the backbone, which are approximately independent of the other base pairs, and interactions between nucleic bases, which are not. Nevertheless, we tested if the results can be improved by including an additive bending term to . Such a treatment is tantamount to considering interactions of single base pairs in the “mean-field” environment of the consensus sequence. Similar to the case of , we computed the change in due to each possible singe base pair substitution in the consensus sequence and set up a second EBWM (Table 1b). Thus, for every position along the DNA sequence, the change in bending energy due to a point mutation is measured. Then, the total bending energy for an arbitrary sequence is approximated as the sum of the changes in bending energy at each position. This approximation only captures the interactions of the base pairs and the backbone and some mean-field portion of the interaction between base pairs, but leaves out base stacking energies which are explicitly not pairwise additive. More precisely, to find , as defined in Eq. (5), and are needed. The former is computed by excising the DNA from the energy minimized protein-DNA complex structure and measuring its energy without the surrounding protein. is, of course, the energy of the DNA in its free form. Subtracting the two energies yields the energy of deformation, .
| A | C | G | T |
|---|---|---|---|
| 0.0 | -0.5 | -0.7 | -0.7 |
| 1.3 | 0.0 | 0.4 | -0.6 |
| 4.7 | 14.3 | 0.0 | 8.4 |
| -1.0 | 0.0 | 2.3 | 1.2 |
| 0.0 | 2.1 | 3.7 | 3.4 |
| 0.0 | 3.5 | 3.4 | 3.8 |
| 0.0 | 2.0 | 0.6 | 2.1 |
| 6.2 | 0.0 | 0.1 | 5.2 |
| 5.3 | 0.1 | 0.0 | 6.0 |
| 2.2 | 0.6 | 2.1 | 0.0 |
| 3.9 | 3.4 | 3.6 | 0.0 |
| 3.4 | 3.8 | 2.1 | 0.0 |
| 0.9 | 2.3 | 0.0 | -0.9 |
| 8.4 | 0.0 | 14.4 | 4.6 |
| -0.6 | 0.6 | 0.0 | 1.4 |
| -0.7 | -0.6 | -0.6 | 0.0 |
| A | C | G | T |
|---|---|---|---|
| 0.0 | 0.3 | -0.6 | 0.2 |
| 1.9 | 0.0 | 0.0 | 0.4 |
| 7.6 | 19.6 | 0.0 | 15.1 |
| 2.3 | 0.0 | 2.4 | 0.1 |
| 0.0 | 1.6 | 2.2 | 4.2 |
| 0.0 | 4.4 | 4.5 | 5.7 |
| 0.0 | 0.5 | 2.8 | 0.4 |
| 2.3 | 0.0 | -0.6 | 3.3 |
| 3.8 | -0.8 | 0.0 | 1.4 |
| 0.4 | 2.7 | 0.3 | 0.0 |
| 8.4 | 4.8 | 6.7 | 0.0 |
| 3.3 | 2.4 | 0.3 | 0.0 |
| -0.2 | 2.1 | 0.0 | 2.2 |
| 14.9 | 0.0 | 19.3 | 7.8 |
| -0.1 | 0.2 | 0.0 | 1.8 |
| -0.2 | -0.5 | -0.2 | 0.0 |
In an effort to gauge the usefulness of the two matrices, we computed the energy difference between the worst cognate sequence and all the sequences encountered in scanning the E. coli genome excluding the PurA operator sites. We repeated this to find the energy difference between the worst cognate sequence and the 50 nonspecific random sequences discussed above. If only protein-DNA interactions are taken into account, the separation between the lowest and the average of all sequences is 2.74 (3.2 based on the 50 nonspecific sequences). If the additive bending correction is included the distance is also 2.74 (3.38 based on the 50 nonspecific sequences). The 50 nonspecific random sequences are too few to allow reliable conclusions; clearly, the genome scan is more significant. These results indicate that a simplified EBWM approach which only considers additive interactions is not sufficient to provide accurate discrimination of sites. Similarly, we expect the that experimentally obtained PWM based on of single base pair mutants of the consensus sequences [14] to suffer from a similar lack of discrimination power.
To visualize the contribution of individual base pairs to the PurR motif, and hence to the specificity of recognition, we converted the information contained in the EBWM into a sequence logo (Figure 3). This is done by using Boltzmann weights to represent the frequency of occurrence of each base pair at each position. Room temperature was used in the Boltzmann factors, that is, . Comparison with the bioinformatics logo from Ref. [14] (Fig. 3a) indicates that the structure-based method is able to reproduce the specificity of most of the positions in the PurR motif. In particular, base pairs at positions 3 (G), 5 (A), 6 (A), 11 (T), 12 (T), and 14 (C) are identified correctly, but the method cannot distinguish between the consensus CpG versus GpC in positions 8 and 9. Base pairs 8 and 9 play an important role in the binding of DNA because PurR bends DNA by intercalating a lysine side chain between these two base pairs. [28] Either CpG is selected in nature for reasons that cannot be explained by binding energy considerations or the force field cannot capture a subtle difference in binding between CpG and GpC in the center of the binding sequence. Nevertheless, it is surprising that although the computed energy differences are too big compared to the experimental energy differences, the sequence logo is recreated rather accurately.
The Boltzmann weights of each base pair at any position along the DNA represent a probability distribution for the four base pairs at that position. Two different probability distributions and can be compared using the relative entropy measure (Kullback-Leibler divergence [29]), . Here, is the probability distribution of the base pairs at some position in the DNA derived from the bioinformatics weblogo and is the probability distribution for the base pairs at the same position derived from the Boltzmann weight, which is computed with our method. The more dissimilar two probability distributions are, the larger is their relative entropy. Excluding the two end base pairs and the two middle base pairs with the problematic CpG ambiguity, the distance between the probability distribution based on and the bioinformatics probability distribution is, on average, . Excluding the same base pairs, the distance between the probability distribution based on and the one based on bioinformatics is , which reflects a clear improvement.
In summary, we have shown that: (i) the contribution of indirect readout due to DNA bending is significant; (ii) this contribution cannot be easily accounted for by a site-specific approximation; (iii) the EBWM provides a fast way of estimating the binding energy but suffers from a significant loss of statistical power; (iv) a structure-based energy calculation is able to capture most of the PurR motif, but fails to identify the central base pairs correctly. This suggests a hybrid strategy of first using EBWMs to scan for potential binding sites, and then following up by a more computationally intensive energy minimization for these candidates.
3.3 Investigation of DNA and Protein Mutants
In this section we compare the binding energies derived from the structure-based approach with the experimental free energies of binding for a number of DNA and amino acid point mutations. [15, 30] In particular, we investigated the following sequences bound to the protein wild type and K55A mutant:
|
In addition, we studied protein mutants L54M, L54S, L54T, and L54V bound to the consensus sequence. The results are summarized in Table 2.
|
Binding to wild-type PurR
|
||
|---|---|---|
| DNA Sequence | (experiment) | |
| 0 | 0.0 | |
| 0.16 | 0.8 | |
| 2.02 | 1.6 | |
| 6.78 | 3.2 | |
|
Binding to the K55A mutant
|
||
| DNA Sequence | (experiment) | |
| -7.53 | -0.06 | |
| -4.47 | -0.46 | |
| 0 | 0 | |
| 1.13 | 0.5 | |
|
PurR mutants bound to the consensus sequence
|
||
| Mutant | (experiment) | |
| WT | 0 | 0 |
| L54M | 5.79 | 0.38 |
| L54S | 16 | larger, not measured |
| L54T | 10.05 | ,, |
| L54V | 6.15 | ,, |
| K55A | 12.55 | 3.48 |
Although the overall energy scale is incorrect, we are able to reproduce (with one exception) the correct order of experimental binding free energies for all DNA and amino acid mutants. Qualitatively similar results were obtained in Ref. [9], which, however, only considered mutations of the DNA sequence. The sampling of amino acid mutants is particularly relevant because it allows us to predict whether simple modifications of transcription factors can lead to higher or lower binding affinity.
4 Discussion
It is clearly desirable to understand protein-DNA binding on a molecular level, and all-atom energy calculations based on minimizing experimental structures are a promising step towards this goal. In this work we studied the feasibility of predicting the affinity of a transcription factor to different sequences, by using off-the-shelf and widely used interaction potentials. Our main goal was to test whether computation of energies using such a potential allows discrimination of cognate sites from random decoys. Using the example of the PurR transcription factor as a model system, and starting from the structure this protein bound to a specific DNA sequence, we tested our method in the following ways:
-
•
examined its ability to deliver lower binding energies to cognate sites as compared to random decoys;
-
•
estimated the number of random sites that have binding energies comparable to cognate sites, thereby assessing the potential of this method to detect sites in long genomic sequences;
-
•
compared the performance of this structure-based method with the bioinformatic PWM technique that requires a priori knowledge of several cognate sites;
-
•
examined PurR motifs obtained using structure-based calculations, and compared them with the motif inferred from the cognate sites;
-
•
calculated the change in the binding energy due to mutations in the protein and DNA and compared with experimentally measured .
We further investigated the contribution of the sequence-dependent DNA bending and tested whether computations can be accelerated using an EBWM approach. This systematic and diverse testing makes our study complimentary to other recent works [7, 8, 9, 10, 11, 12, 31].
Overall, the changes in energy of the minimized structures correlate well with corresponding bioinformatics scores and are accurate enough to discriminate between binding and random sequences. Unfortunately, they are not sufficiently discriminating to enable systematic scanning of entire genomes. The method can, however, distinguish between weak and strong binding sites and, to a lesser extent, between operator sites of related factors.
To highlight the contributions of individual base pairs, we compared a motif logo obtained using structure-based calculations with the logo for cognate sites. While most of the positions reflect the cognate motif correctly, the two central base pairs are predicted incorrectly with atomistic force fields- indicating no difference between G and C in these positions. This difficulty is likely due to a complicated binding mechanism through lysine intercalation used by PurR to bind the central base pairs. It is possible that sequence-dependent bendability of DNA makes CpG a preferred base pair in the center of a sharply bent PurR site. Understanding the molecular mechanism of recognition of the central base pairs requires further studies using molecular dynamics. A method that can resolve this discrepancy is likely to provide a significant improvement to structure-based predictions for PurR and other transcription factors that bend DNA.
Our analysis provides a glimpse into the promise of structure- and interaction-based methods. Relatively crude computations are able to predict the correct order of binding energies. This is particularly useful for the study of amino acid mutants which cannot be investigated with standard bioinformatics methods. There are several reasons for the limited success of our approach. First, the force fields employed are likely not accurate enough to deliver precision of the binding energy at the level of a few , as required to discriminate cognate sites, especially when an implicit water model is used. (The ParmBSC0 force field, for example, could be used in the future because of its improved treatment of non-canonical backbone conformations compared to PARM99. [32]) Second, our procedure crudely approximates the differences in the binding free energy by ignoring entropy contributions and by limiting the flexibility of the protein- DNA complex through the use of fast energy minimization, thus not allowing for major rearrangements of the structure. Furthermore, the restraints on the protein and the DNA, which keep them from deviating too far from the native experimental structure, could be increasing the energy scales in the system, thus exaggerating the energy differences. The energies of the restraining springs are not included in the calculations, but the springs may keep the structure from relaxing to the equilibrium coordinates that the force field favor. The (qualified) success of this simple approach suggests that further optimization of the force field [7] and conformational sampling (e.g. similar to those of [11]) may lead to significant improvements. Resolution of these issues is necessary to gain a better quantitative understanding of protein-DNA binding.
Structure-based methods are more laborious than bioinformatics but less costly and elaborate than experiments. Although accuracy is still somewhat lacking in current implementations, the results are promising and still leave considerable room for improvements. Promising applications which already appear feasible include the study of sequence dependent motion of proteins along DNA, and investigations of simple amino acid point mutations in conjunction with experiments.
5 Acknowledgment
This work was supported by the National Science Foundation Grant DMR-08-03315 and by the Deutsche Forschungsgemeinschaft grant VI237/1. LM acknowledges generous support by NEC fund and by the National Center for Biomedical Computing i2b2. PV would like to acknowledge the John von Neumann Institute for Computing in Jülich for providing computational resources.
References
- [1] von Hippel, P. H. and Berg, O. G. (1986) On the specificity of DNA-protein interactions. Proc. Natl. Acad. Sci. USA, 83, 1608–1612.
- [2] Djordjevic, M., Sengupta, A. M., and Shraiman, B. I. (2003) A biophysical approach to transcription factor binding site discovery. Genome Res., 13, 2381–90.
- [3] Kinney, J. B., Tkacik, G., and Callan Jr., C. G. (2007) Precise physical models of protein-DNA interaction from high-throughput data. Proc Natl Acad Sci U.S.A., 104, 501–6.
- [4] Foat, B. C., Morozov, A. V., and Bussemaker, H. J. (2006) Statistical mechanical modeling of genome-wide transcription factor occupancy data by MatrixREDUCE. Bioinformatics, 22, e141 – e149.
- [5] Wang, J. M., Cieplak, P., and Kollman, P. A. (2000) How well does a restrained electrostatic potential (resp) model perform in calculating conformational energies of organic and biological molecules?. J. Comput. Chem., 21, 1049–1074.
- [6] MacKerell Jr., A. D., Banavali, N., and Foloppe, N. (2001) Development and current status of the charmm force field for nucleic acids. Biopolymers, 56, 257–265.
- [7] Donald, J. E., Chen, W. W., and Shakhnovich, E. I. (2007) Energetics of protein-DNA interactions. Nucleic Acids Res., 35, 1039–47.
- [8] Lafontaine, I. and Lavery, R. (2001) ADAPT: A molecular mechanics approach for studying the structural properties of long DNA sequences. Biopolymers, 56, 292–310.
- [9] Paillard, G. and Lavery, R. (2004) Analyzing protein-DNA recognition mechanisms. Structure, 12, 113–122.
- [10] Paillard, G., Deremble, C., and Lavery, R. (2004) Looking into DNA recognition: Zinc finger binding specificity. Nucleic Acids Res., 32, 6673–6682.
- [11] Endres, R. G., Schulthess, T. C., and Wingreen, N. S. (2004) Toward an atomistic model for predicting transcription-factor binding sites. Proteins, 57, 262–268.
- [12] Morozov, A. V., Havranek, J. J., Baker, D., and Siggia, E. D. (2005) Protein-DNA binding specificity predictions with structural models. Nucleic Acids Res, 33, 5781–5798.
- [13] Ingraham, J. L. and Neidhardt, F. C., (eds.) (1987) Escherichia coli and Salmonella Typhimurium: Cellular and Molecular Biology, ASM Press, Washington, D.C.
- [14] Mironov, A. A., Koonin, E. V., Roytberg, M. A., and Gelfand, M. S. (1999) Computer analysis of transcription regulatory patterns in completely sequenced bacterial genomes. Nucleic Acids Res., 27, 2981–2989.
- [15] Glasfeld, A., Koehler, A. N., Schumacher, M. A., and Brennan, R. G. (1999) The role of lysine 55 in determining the specificity of the purine repressor for its operators through minor groove interactions. J. Mol. Biol., 291, 347–361.
- [16] Kalodimos, C. G., Biris, N., Bonvin, A. M. J. J., Guennuegues, M. M. L. M., Boelens, R., and Kaptein, R. (2004) Structure and flexibility adaptation in nonspecific and specific protein-DNA complexes. Science, 305, 386–389.
- [17] Lu, X.-J. and Olson, W. K. (2003) 3DNA: a software package for the analysis, rebuilding and visualization of three-dimensional nucleic acid structures. Nucleic Acids Res., 31, 5108–5121.
- [18] Humphrey, W., Dalke, A., and Schulten, K. (1996) VMD – Visual Molecular Dynamics. Journal of Molecular Graphics, 14, 33–38.
- [19] Onufriev, A., Bashford, D., and Case, D. A. (2004) Exploring protein native states and large-scale conformational changes with a modified generalized born model. Proteins, 55, 383–394.
- [20] Maerkl, S. J. and Quake, S. R. (2007) A systems approach to measuring the binding energy landscapes of transcription factors. Science, 315, 233–237.
- [21] Benos, P. V., Bulyk, M. L., and Stormo, G. D. (2002) Additivity in protein-DNA interactions: how good an approximation is it?. Nucleic Acids Res., 30, 4442–51.
- [22] Man, T. K., Yang, J. S., and Stormo, G. D. (2004) Quantitative modeling of DNA-protein interactions: effects of amino acid substitutions on binding specificity of the mnt repressor. Nucleic Acids Res., 32, 4026–4032.
- [23] Kazakov, A. E., Cipriano, M. J., Novichkov, P. S., Minovitsky, S., Vinogradov, D. V., Arkin, A., Mironov, A. A., Gelfand, M. S., and Dubchak, I. (2007) RegTransBase - a database of regulatory sequences and interactions in a wide range of prokaryotic genomes. Nucleic Acids Res., 35(Database issue), D407–12.
- [24] Blattner, F. R., Plunkett III, G., Bloch, C. A., Perna, N. T., Burland, V., Riley, M., Collado-Vides, J., Glasner, J. D., Rode, C. K., Mayhew, G. F., Gregor, J., Davis, N. W., Kirkpatrick, H. A., Goeden, M. A., Rose, D. J., Mau, B., and Shao, Y. (1997) The complete genome sequence of Escherichia coli K-12. Science, 277, 1453–1474.
- [25] Meng, L. M., Kilstrup, M., and Nygaard, P. (1990) Autoregulation of PurR repressor synthesis and involvement of purR in the regulation of purB, purC, purL, purMN and guaBA expression in Escherichia coli. Eur J Biochem, 187, 373–379.
- [26] He, B. and Zalkin, H. (1994) Regulation of Escherichia coli purA by purine repressor, one component of a dual control mechanism. J. Bacteriol., 176, 1009–1013.
- [27] Endres, R. G. and Wingreen, N. S. (2006) Weight matrices for protein-DNA binding sites from a single co-crystal structure. Phys. Rev. E, 73, 061921.
- [28] Schumacher, M. A., Choi, K. Y., Zalkin, H., and Brennan, R. G. (1994) Crystal structure of LacI member, PurR, bound to DNA: Minor groove binding by helices. Science, 266, 763–770.
- [29] Kullback, S. and Leibler, R. A. (1951) On information and sufficiency. Annals of Mathematical Statistics, 22, 79–86.
- [30] Arvidson, D. N., Lu, F., Faber, C., Zalkin, H., and Brennan, R. G. (1998) The structure of PurR mutant L54M shows an alternative route to DNA kinking. Nature Struct. Biol., 5, 436–441.
- [31] Liu, L. A. and Bader, J. S. (2007) Ab initio prediction of transcription factor binding sites. Pac Symp Biocomput., 12, 484–95.
- [32] Pérez, A., Marchán, I., Svozil, D., Sponer, J., Cheatham III, T. E., Laughton, C. A., and Orozco, M. (2007) Refinement of the AMBER force field for nucleic acids: Improving the description of conformers. Biophysical Journal, 92, 3817–3829.