Self-consistent analysis of electron-phonon coupling parameters of graphene
Abstract
We present a self-consistent analysis of the photoemission spectral function of graphene monolayers grown epitaxially on SiC(0001). New information derived from spectral intensity anomalies (in addition to linewidths and peak positions) confirms that sizeable kinks in the electronic dispersion at the Dirac energy and near the Fermi level arise from many-body interactions, not single-particle effects such as substrate bonding or extra bands. The relative electron-phonon scattering rate from phonons at different energy scales evolves with doping. The electron-phonon coupling strength is extracted and found to be much larger ( times) than predicted.
pacs:
73.21.-b,71.38.-k,73.22.-f, 79.60.-i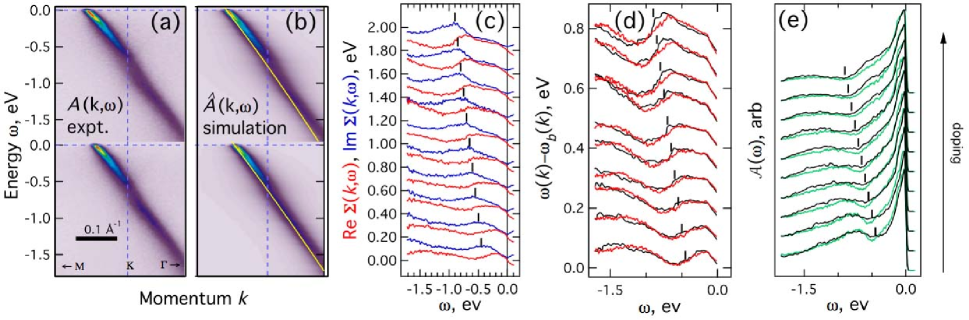
Many-body interactions in epitaxial graphene are interesting since graphene has been proposed for numerous device applications including high power electronics and novel device schemes Berger et al. (2006); Geim and Novoselov (2007). Full characterization of the electron scattering lifetime under a variety of conditions is therefore central to understanding the properties of such devices. Moreover, graphene is an excellent system for investigating theories of many-body interactions in two dimensions. First, it is straightforward to prepare high quality films, with intrinsic photoemission linewidths among the sharpest available for any material Forbeaux et al. (1998); Bostwick et al. (2007a). Second, a large change in the carrier density of the order of can be achieved through applied voltage in a gated deviceNovoselov et al. (2005); Zhang et al. (2005), or equivalently through chemical dopingOhta et al. (2006), suggesting a tunability of many-body effects for novel devices.
We have previously shown that the electron scattering lifetime of holes in -doped graphene is dominated by a combination of ordinary Fermi liquid electron-hole pair (e-h) excitations, electron-phonon (e-ph) coupling, and electron-plasmon (e-pl) coupling Bostwick et al. (2007a). Theoretical work has qualitatively confirmed the e-h and e-pl interpretation. Both Hwang et al. Hwang and Sarma (2008) and Polini et al. Polini et al. (2008) have shown that the electron-plasmon interaction leads to an enhancement of the scattering rate, and a “-band mismatch”, where the lower and upper bands are displaced from each other when projected through their crossing point at the Dirac energy . These effects are similar to those seen in experiment, but are not predicted in single-particle theories, whereas they naturally arise from many-body interactions. Similarly, the dispersion of the bands near is heavily modified, a fact which is ascribed conventionally to e-ph coupling since the effects occur on a meV energy scale, corresponding to the phonon bandwidth of graphenePark et al. (2007); Tse and Sarma (2007); Calandra and Mauri (2007).
Although the evidence for e-ph and e-pl coupling is strong, the existence of the e-pl coupling and the quantitative estimate of the e-ph coupling strength derived from the data remain controversial. First, as an alternate model to the e-pl coupling, the bonding of graphene to the substrate induces a gap at Zhou et al. (2007); Kim et al. (2008). Alternative causes for a dispersion anomaly are the presence of defects or quantum size effects for islanded films Rotenberg et al. (2008); Zhou et al. (2008).
Second, a simple estimate of the coupling strengthBostwick et al. (2007b) gave times stronger than detailed calculationsCalandra and Mauri (2005, 2006); Park et al. (2007); Tse and Sarma (2007). This suggests a stronger role than predictedCalandra and Mauri (2005); Kim et al. (2006) for -band e-ph coupling in superconductivity of graphite intercalation compounds (GICs) like CaC6. But the linear-band estimation method Bostwick et al. (2007b) was shown to overstate the couplingPark et al. (2008), and furthermore finite energy and momentum resolution was cited to explain at least part of the discrepancy Calandra and Mauri (2007).
Here we provide a self-consistent analysis of the experimental spectral function which makes no a priori assumptions about the bare bands, but assumes only non-violation of causality, approximate particle-hole symmetry, and a weak momentum- (k-) dependence of the self energy. Self-consistency between model and data is demonstrated by a comparison of the scattering rates, dispersion energies, and the absolute spectral intensity – the latter having been not usually considered. From our analysis of the low doping regime (), we find that: (i) key spectral features arise from many-body interactions, (ii) previous estimates of large e-ph constant are confirmed, and (iii) the relative e-ph coupling strength to multiple phonon modes is shown to be strongly doping-dependent. These results are a challenge to the present understanding of the carrier lifetimes in graphene.
The photoemission single particle spectral function is
| (1) |
where is the quasiparticle energy, is the bare (unrenormalized) band, and is the complex quasiparticle self-energy, whose real and imaginary components are related by Hilbert trasformation to satisfy causality. We seek to determine with no knowledge of the bare band or the spectral function, and subject to uncertainty due to experimental broadening. Once is determined, the e-ph coupling constant is given by
| (2) |
In the usual analysisDamascelli et al. (2003); Kaminski and Fretwell (2005), each momentum distribution curve (MDC) =const is fitted to a Lorentzian and is thereby parametrized into three functions: the renormalized band dispersion , the Lorentzian width , and , the amplitude along . Provided the bare band is linear, is simply proportional to and the self-energy is easily found. However, if is non-linear the problem is more difficult because of the non-trivial relationship between and .
To solve the general problem, we apply an optimization approach similar to Kordyuk et al. Kordyuk et al. (2005): From initial guesses for and , we calculate the simulated spectral function and by MDC analysis parametrize it into three functions , , . The self energy and bare band are iteratively refined in order to minimize the difference subject to the constraint =. Agreement between simulated and experimental is left as a final check of the model. To reduce the number of free parameters, we use a quadratic bare band.
The experiments were performed on in situ grown samples at beamline 7.0 of the Advanced Light Source. Samples were prepared by epitaxial growth on SiC(0001) and doped with K atoms as described elsewhere Ohta et al. (2006); Bostwick et al. (2007a). The instrumental broadenings were 25 meV and 0.01 Å-1, and the photon energy was 94 eV. The sample temperature was 20 K.
Fig. 1(a,b) shows two typical experimental spectral functions for different -dopings of graphene, in comparison to simulated spectral functions . The latter were calculated using the optimized bare bands and shown in Fig. 1(b,c). We assumed particle-hole symmetry, i.e. that is a strictly even function with respect to , implying . The intensity was scaled by a function linear with to account for the non-uniform sensitivity of the electron detector. Comparison of the quantity (-) derived from MDC fits of and (Fig. 1(d)) shows excellent agreement, demonstrating self-consistency of our derived , and confirming that deviations in the band dispersion indeed are fully described by quasiparticle scattering, and not details of the initial-state band structure. In particular, the energy gap at Zhou et al. (2007); Kim et al. (2008), if any, must be much smaller than the band renormalization by many-body interactions.
We stress that in our analysis the simulated and experimental spectral functions are treated on an equal footing with respect to temperature smearing at and experimental broadening, both of which are included in our simulated . Therefore these uncertainties are in principle deconvolved out of our derived self-energies. Furthermore, we find that the calculated and experimental in excellent agreement (Fig. 1e), despite not being included in our optimization. This is a stringent test of the analysis, because as we now show, is highly sensitive to many-body interactions, perhaps more so than the MDC width and peak positions, a fact we can exploit to determine new information about e-ph coupling.
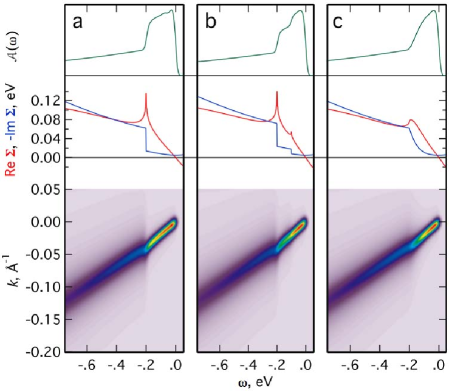
Fig. 2(a) shows simulated spectral functions for a band interacting with a single Einstein optical mode at =200 meV using realistic experimental parameters, including a power-law scattering rate to simulate electron-electron interactions. The MDC amplitude function shows a relatively flat top down to . Suppose we add additional weak scatterers at lower energy scales (Fig. 2(b,c)); how is the MDC analysis affected? Casual inspection of the images shows that scarcely any effect on the apparent dispersion or scattering rates can be observed with realistic broadening and limited statistics. However, the MDC amplitudes are strongly affected, with an easily visible shift of spectral weight from towards . This shows that can access information about weak or even sub-resolution features in the self-energy.
We believe that the evolution of such ‘hidden’ features with doping are necessary to explain the evolution of near . Fig. 3 shows the measured as a function of doping. While all spectra show a break in slope around 200 meV, there is clearly an evolution from a merely prominent shoulder beginning around 200 meV to a flat top below with increased doping. The simulations in Fig. 2 suggest that this shoulder is the dominant mode at all dopings, but its strength increases relative to the lower energy modes with doping. Such a relative evolution of the e-ph coupling with different phonon modes has not been predicted by theory.
We close by discussing how the self-energy and experimentally derived e-ph coupling constant compares to recent calculations. The globally optimized self-energies in Fig. 1 do not fit perfectly well near , since the quadratic bare band does not fit the data perfectly over all energies. To achieve a more accurate near , we have analyzed the data in a smaller energy region, shown in Fig. 4(a) for a sample with eV.

The simulated and the the derived self-energy and bare band are shown in Fig. 4(b, d). Good agreement between measured and simulated , , and are demonstrated in Fig. 4(e-g). For comparison, in Fig. 4(c) we show the spectral function calculated from the predicted e-ph from Ref. Park et al. (2007). Both the experimental and the predicted were modeled with a .028 eV offset to to take care of the background defect scattering rate. Although in excellent qualitative agreement, the theoretical self-energies are much smaller than those measured (see comparison in Fig. 4(d)), and hence the kink, scattering rates, and the abrupt increase in the spectral amplitude are not well-reproduced (Fig. 4(e-g)). This conclusion is not affected by experimental broadening as proposed in Calandra and Mauri (2007) because the same discrepancy appears in both the optimized self-energies (from which the broadening is essentially deconvolved, see Fig. 4(d)) as well as from the apparent self-energy derived from both experiment and broadened theory (Fig. 4(e-f)). Furthermore the disagreement in is practically unaffected by our experimental broadening.
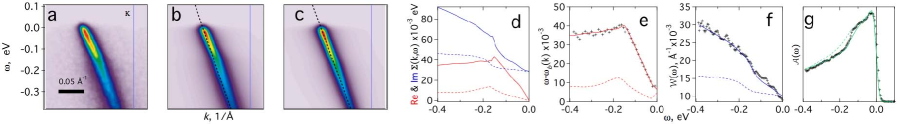
The discrepancy in ranges from a factor of 3.5 to 5 times larger than predictions for e-ph couplingCalandra and Mauri (2007); Park et al. (2007); Tse and Sarma (2007), the lower estimate found by scaling the predicted real and imaginary parts of to match the experimental functions, and the upper estimate by applying Eq. 2 to the two functions in Fig. 4(d) not (a). If some of the scattering is attributed to electron-electron coupling near (which rises as ) Polini et al. (2008) then this would act to reduce the derived e-ph coupling constant, however, the e-e contribution to is predicted to be very weak (around .004 eV at meV) not (b), and it cannot explain the sharp kink at the phonon energy scale Polini et al. (2008); Hwang and Sarma (2008).
Why is the apparent e-ph coupling so large? First, it could be due to coupling to some other mode (e.g. magnon) at similar energy scale, although such a mode has not been observed or even predicted. It cannot be due to coupling to substrate phonons, because the SiC phonon modes are at lower energies than the observed kink. Furthermore there is a carbon-rich, graphene-like buffer layer between graphene and SiC Emtsev et al. (2008), whose coupling to the graphene electrons would also have to be anomalously high to explain the results.
The presence of our dopant K atoms cannot explain the large coupling: first, because of the apparent strong coupling even in our as-grown films, and second, because K vibrations are at too low an energy to explain the kink (although they might contribute in principle to the lower-energy modes suggested in our self-energy in Fig. 4(d)). Also, the very minute amount of K atoms ( per graphene unit cell at our highest doping) makes its presence unlikely to cause the effect we see. Lastly, there is a small rippling of graphene on SiC Varchon et al. (2008). Although a local curvature can enhance the e-ph coupling Crespi (1999), the curvature in our films is too small to have a significant effect.
Our findings lead to three possibilities, first, that for graphene is anomalously strong, second, that there is anomalously strong scattering from something other than phonons (such as defects, or e-e scattering) on a similar energy scale, or third, there is a mutual interplay of interactions that leads to an enhanced scattering rate overall. Noting that the peak near in due to plasmon scattering is broadened and shifted towards in our experiment relative to calculations Polini et al. (2008); Hwang and Sarma (2008), such an interplay is conceivable.
We acknowledge C. W. Park, F. Guistino, S. G. Louie, M. L. Cohen, M. Polini, A. H. Macdonald, T. Deveraux, M. Calandra and F. Mauri for discussions. This work and the ALS are supported by the Director, Office of Science, Office of Basic Energy Sciences, Materials Sciences Division, of the U.S. DOE under Contract No. DE-AC03-76SF00098 at LBNL. J.M., T.O., and K.H. were supported by the Max Planck Society. TS and KE acknowledge support by the DFG through SE1087/5-1 and by the Erlangen Cluster of Excellence ”Engineering of Advanced Materials”. (http://www.eam.uni-erlangen.de).
References
- Geim and Novoselov (2007) A. K. Geim and K. S. Novoselov, Nat Mater 6, 183 (2007).
- Berger et al. (2006) C. Berger, Z. Song, X. Li, X. Wu, N. Brown, C. Naud, D. Mayou, T. Li, J. Hass, A. Marchenkov, et al., Science 312, 1191 (2006).
- Forbeaux et al. (1998) I. Forbeaux, J. M. Themlin, and J. M. Debever, Phys. Rev. B 58, 16396 (1998).
- Bostwick et al. (2007a) A. Bostwick, T. Ohta, T. Seyller, K. Horn, and E. Rotenberg, Nat Phys 3, 36 (2007a).
- Novoselov et al. (2005) K. S. Novoselov, E. McCann, S. V. Morosov, V. Fal’ko, M. I. Katsnelson, U. Zeitler, D. Jiang, F. Schedin, and A. K. Geim, Nature 438, 192 (2005).
- Zhang et al. (2005) Y. Zhang, Y. W. Tan, H. L. Stormer, and P. Kim, Nature 438, 201 (2005).
- Ohta et al. (2006) T. Ohta, B. Bostwick, T. Seyller, K. Horn, and E. Rotenberg, Science 313, 951 (2006).
- Hwang and Sarma (2008) E. H. Hwang and S. DasSarma, Phys. Rev. B 77, 081412(R) (2008).
- Polini et al. (2008) M. Polini, R. Asgari, G. Borghi, Y. Barlas, T. Pereg-Barnea, and A. H. MacDonald, Phys. Rev. B 77, 081411(R) (2008).
- Tse and Sarma (2007) W.-K. Tse and S. DasSarma, Phys. Rev. Lett. 99, 236802 (2007).
- Park et al. (2007) C.-H. Park, F. Giustino, M. L. Cohen, and S. G. Louie, Phys. Rev. Lett. 99, 086804 (2007).
- Calandra and Mauri (2007) M. Calandra and F. Mauri, Phys. Rev. B 76, 205411 (2007).
- Zhou et al. (2007) S. Y. Zhou, G. H. Gweon, A. V. Fedorov, P. N. First, W. A. de Heer, D. H. Lee, F. Guinea, A. H. Castro Neto, and A. Lanzara, Nat. Mater. 6, 770 (2007).
- Kim et al. (2008) S. Kim, J. Ihm, H. J. Choi, and Y.-W. Son, Phys. Rev. Lett. 100, 176802 (2008).
- Rotenberg et al. (2008) E. Rotenberg, A. Bostwick, T. Ohta, J. L. McChesney, T. Seyller, and K. Horn, Nat. Mater. 7, 258 (2008).
- Zhou et al. (2008) S. Y. Zhou, D. A. Siegel, A. V. Federov, F. El Gabaly, A. K. Schmid, A. H. Castro Neto, D. H. Lee, and A. Lanzara, Nat. Mater. (2008).
- Bostwick et al. (2007b) A. Bostwick, T. Ohta, J. L. McChesney, T. Seyller, K. Horn, and E. Rotenberg, Solid State Communications 143, 63 (2007b).
- Calandra and Mauri (2005) M. Calandra and F. Mauri, Phys. Rev. Lett. 95, 237002 (2005).
- Calandra and Mauri (2006) M. Calandra and F. Mauri, physica status solidi (b) 243, 3458 (2006).
- Kim et al. (2006) J. S. Kim, L. Boeri, R. K. Kremer, and F. S. Razavi, Phys. Rev. B 74, 214513 (2006).
- Park et al. (2008) C.-H. Park, F. Giustino, J. L. McChesney, A. Bostwick, T. Ohta, E. Rotenberg, M. L. Cohen, and S. G. Louie, Phys. Rev. B 77, 113410 (2008).
- Damascelli et al. (2003) A. Damascelli, Z. Hussain, and Z. X. Shen, Review of Modern Physics 75, 473 (2003).
- Kaminski and Fretwell (2005) A. Kaminski and H. M. Fretwell, New Journal of Physics 7, 98 (2005), 1367-2630.
- Kordyuk et al. (2005) A. A. Kordyuk, S. V. Borisenko, A. Koitzsch, J. Fink, M. Knupfer, and H. Berger, Phys. Rev. B 71, 214513 (2005).
- not (a) Calculation over a 100 meV binding energy range near .
- not (b) The quasiparticle peak at =0.2 eV corresponds to , and normalized momentum . The predicted Im is read from Fig. 4 of Ref. [9], or Im eV.
- Emtsev et al. (2008) K. V. Emtsev, F. Speck, T. Seyller, L. Ley, and J. D. Riley, Phys. Rev. B 77, 155303 (2008).
- Varchon et al. (2008) F. Varchon, P. Mallet, J. Y. Veuillen, and L. Magaud, Phys. Rev. B 77, 235412 (2008).
- Crespi (1999) V. H. Crespi, Physical Review B 60, 100 (1999).