New X-ray observations of the old nova CP Puppis and of the more recent nova V351 Pup
Abstract
We present X-ray observations of the field containing Nova Puppis 1942 (CP Pup) and Nova Puppis 1991 (V351 Pup), done with ASCA in 1998, and with XMM-Newton in 2005. The X-ray and UV luminosity of CP Pup seem to have remained approximately constant since the last X-ray observations of the 1980’ies, while the optical luminosity has decreased. The X-ray properties of this nova are explained by a high mass white dwarf accreting at low rate, in agreement with the nova theory given the large amplitude and other characteristics of the 1942 outburst. Assuming a distance of 1600 pc, the X-ray luminosity of CP Pup is L2.2 erg s-1 in the 0.15-10 keV range covered with EPIC, compatible with a magnetic system. The RGS grating spectrum shows a few prominent emission lines, and it is fitted with a cooling flow with mass accretion rate M⊙ yr-1. We detected also the O VII complex at 21.6-21.8 Å that does not arise in the cooling flow. Most likely this feature originates in a wind or in the nova shell. The RGS and EPIC spectra are fitted only with thermal models with a very high shock temperature, T60 keV, indicating a white dwarf with M1.1 M⊙. The X-ray flux is modulated with the spectroscopic period of 1.47 hours detected in the optical. Since CP Pup is not an eclipsing system, this is better understood if magnetic accretion occurs: we discuss this possibility and its implications in detail. V351 Pup (N Pup 1991) was detected with XMM-Newton, but not with ASCA. It is a faint, non-super-soft X-ray source with luminosity L erg s-1, a factor of 50 less than measured with ROSAT in 1993.
1 Introduction
In this article we describe ASCA and XMM-Newton observations of two novae in the same field in the Puppis region, Nova Puppis 1942 (CP Pup) and Nova Puppis 1991 (V351 Pup). Classical novae are Cataclysmic Variables (CV), that is close, interacting binaries containing a white dwarf (WD) that accretes matter from a companion, which is usually still on the main sequence or slightly evolved. In novae, at the bottom of the accreted envelope hydrogen burning is ignited in a thin shell, first the p-p and later the CNO cycle. The process becomes explosive because of the degeneracy conditions of the material, compressed on the small surface of the WD. A thermonuclear flash follows, and an optically thick wind that ejects most or all the accreted material (see Starrfield et al. 2000 for a review). The more massive the WD is, the smaller its surface, and the sooner the pressure sufficient to initiate the thermonuclear runaway is reached. The nova theory makes very definite predictions on the correlation of the binary system parameters and the properties of the outburst. The main parameters that determine its properties and recurrence time are the mass accretion rate and the white dwarf mass m(WD) (note that all novae are recurrent phenomena even if only very few, the “recurrent novae” are repeated over a human lifetime). The abundances and the thermal state of the WD at the onset of accretion are also important. In a series of papers (especially Kovetz & Prialnik 1994, Prialnik & Kovetz 1995, Yaron et al. 2004, Epelstein et al. 2007) clear correlations between these parameters and the outburst characteristics are found. Thus, having a remarkable and detectable manifestation in their outburst, novae allow us to test the evolutionary models that apply to all CV and to related systems, included the “single degenerate” progenitors of type Ia supernovae.
X-ray observations are a powerful tool to study the following phenomena in novae: a) Violent, energetic mechanisms in the shell shortly after the outburst (e.g. Nelson et al. 2008), or even a long time later (Balman 2006); b) The WD atmospheric temperature, abundances and effective gravity, after the ejecta clear up sufficiently to allow detection of the X-ray supersoft, luminous central source (e.g. Ness et al. 2003, Nelson et al. 2008); c) The accretion process in quiescence. The shocked material in the disk, or in a magnetically funneled accretion stream, emits X-rays (e.g. Mukai & Orio 2005). In order to study accretion, we proposed X-ray observations of the two objects we describe in this paper, as a test of the nova theory which is largely based on the modalities of accretion.
1.1 CP Pup: a puzzling nova
CP Puppis appeared as a truly astonishing object in 1942, leaving the astronomers of that time wondering for a while whether it was a Galactic supernova. The outburst is described in the Payne-Gaposhkin’s book “Classical Novae”. In 1942 it rose from fainter than 17th magnitude to V=-0.2, raising to maximum during at least 3 days after the discovery. The time for a decay by 3 magnitudes (t3) was one of the shortest ever measured for a nova, only 6.5 days. The velocities measured from the full width at half maximum of the initial absorption lines, and of the emission lines that appeared soon thereafter, reached at most 1200 km s-1, which is lower than measured for other luminous novae. The ejected shell was resolved for the first time 14 years after the outburst (see Williams 1982 and references therein), indicating a distance of about 1.6 kpc and a maximum absolute luminosity MV=-10.5, a factor of 400 above the Eddington luminosity of a 1 M⊙ star (LEdd). Downes & Dürbeck (2000) discussed the possible errors in determining the distance of a shell that is not expanding uniformly, but is made of blobs with different velocity. These authors placed CP Pup at a lower distance of 1140 pc, and Cohen & Rosenthal (1983) even at only 850 pc. A distance compatible with a peak luminosity below 100 LEdd is in any case very unlikely. Another unusual characteristic of CP Pup were the Fe [II] lines that still appeared in the spectrum simultaneously with high excitation lines, including even coronal lines. The energetics initially reminded of a supernova. If we were witnessing such an event today, probably we would initially suspect an accretion induced collapse of a white dwarf, or merging compact objects. Despite the peculiarities outlined above, the optical spectrum was typical for a classical nova, and as such CP Pup is classified.
The distance obtained from the maximum magnitude versus rate of decline relationship (MMRD) is much larger than the range of values derived from the nebular parallax. For this and several other reasons CP Pup has long been suspected to host a magnetic WD. Because of the apparent disk-like structure, it may be an “intermediate polar” (hereafter IP) rather than a “polar” (e.g. a diskless system, see discussion in Balman et al. 1995 and references therein). It is doubtful whether the MMRD holds for magnetic novae (see for instance the description of DQ Her by Payne Gaposhkin, 1964). Orio et al. (1992) suggested that magnetic rotator effects may cause the ejection of the accreted envelope more quickly and efficiently than in other novae. In fact the outburst amplitude of V1500 Cyg, a polar, was also very large, about 16 mag, and the outburst of the IP GK Per had an amplitude of 14 mag despite the high luminosity at quiescence (due to an unusual subgiant secondary). The unambiguous classification of also CP Pup as a magnetic system would be further evidence of the role of the magnetic field in nova outbursts.
Several unusual characteristics of the quiescent CP Pup point in the direction of an IP nature. The outburst of 1942 can best be explained with a high mass white dwarf (e.g., Prialnik and Kovetz 1995, see discussion below). However, assuming that the radial velocities variations of the emission lines in the quiescent optical spectrum indicate the orbital motion of the compact object, and that the width of the lines is due to the Keplerian velocity of the disk, an embarrassingly low mass of the white dwarf is obtained, M0.2 M⊙. The data are rather complex, and we will summarise them as follows. At quiescence, two photometric periods have been measured, 0.061-0.062 days, and 0.06834 days (Bianchini 1985a and b, Warner 1985, O’Donoghue et al. 1985, White et al. 1993). From the radial velocity of the He II line at 4686 Å and the Balmer lines, White et al. (1993) measured a spectroscopic period of 0.06129 days. In the most recent work, Bianchini et al. (2008, in preparation, and hereafter B08) detect a mean spectroscopic period of 0.0612643 days (1.47 hours), coincident within the errors with the period reported by White et al. (1993), and other aliases of this period. In 1987 a photometric period of CP Pup was measured to be 11% longer than the spectroscopic period (White et al. 1993). However in 1993 Patterson & Warner (1998) found instead two other photometric periods, of which the first was equal to the spectroscopic one and the second was unstable, but generally longer than the spectroscopic period by only 2%. The last authors interpret this as a “superhump” (due to disk precession), which is often detected in non-magnetic cataclysmic variables (CV). However, another possible interpretation is that the longer photometric period is due to the rotation of the WD that has become asynchronous after the nova outburst, like the polar Nova V1500 Cyg after the 1975 outburst (Diaz & Steiner 1991). Balman et al. (1995) reported an X-ray flux modulation with the spectroscopic period. This is suggestive of a magnetic system, since X-ray orbital modulations are not observed in non-magnetic CV with inclination less than 60o (Baskill et al. 2005). The evidence however was not conclusive, because the orbital period of CP Pup is uncomfortably close to the rotation period of 94 minutes of the ROSAT spacecraft.
The spectroscopic period of 1.47 hours is interpreted as the orbital period in the literature, which we also adopt as our baseline interpretation (we will review this assumption later, and present an alternative interpretation). In this baseline scenario, it is one of the two shortest orbital periods of all novae. Most of the known orbital periods of classical novae are longer than 3 hours, i.e. above the period gap. CP Pup is only matched by GQ Mus (Nova Mus 1983) with 1.42 hours, and there are only 5 other novae with orbital periods below 3 hours (Diaz & Bruch 1997).
The lack of eclipses places a constraint on the inclination, 65o. With the measured radial velocities and line widths, there simply is no way to place a massive white dwarf in a non-eclipsing system with such a short orbital period. O’Donoghue et al. (1989) conclude that the WD mass should be M0.2 M⊙. Moreover, if the modulation of the infrared flux with a period close to the spectroscopic one is due to an ellipsoidal variation (Szkody & Feinswog 1988), the upper limit on the inclination is i35o. This implies that a Roche lobe filling secondary secondary has mass 0.2 M⊙, and that the upper limit for the WD is less than a tenth of a solar mass! This is a clear inconsistency: in the first place, this WD mass is much lower than the minimum WD mass in the Galaxy and it is difficult to explain such an amount of mass loss from the WD. Moreover, H-burning would not even start on the surface of such a low mass WD, thus, a classical nova eruption could not occur. This puzzle may originate, first of all, in an incorrect interpretation of the IR modulation. At a distance of 1 kpc, a 0.2 M⊙ secondary star (M5V, MV=14.7, MK=8.5) would have a distance modulus m-M=10, yielding a K18.5 magnitude of the secondary. Szkody and Feinswog measured K=13.4 for CP Pup, a value completely inconsistent with the assumed short orbital period secondary and one which cannot be reconciled as ellipsoidal variations. Only if CP Pup was 95 pc away, the assumed 0.2 M⊙ secondary star could then account for the observed IR modulations. A different physical mechanism that may cause the IR light curve modulation is beamed cyclotron radiation. Although up to now the cyclotron humps in IR have only been observed for the higher magnetic field systems, the polars, this phenomenon is not yet ruled out in IP’s. The cyclotron hump does produce an IR modulation like the one observed in CP Pup. One example is AR UMa (Howell et al. 2001), where the visual and infrared double-humped light curves are caused by beamed cyclotron radiation, although initially at least the visual modulations were initially ascribed to ellipsoidal variations. Another example is HU Aqr, another polar, where the IR light curve is explained partially by cyclotron emission and the light curve is very complex to model (Howell et al. 2002).
The secondary star spectrum is not detected in optical or infrared, therefore the secondary is thought to be a main sequence star, because subgiants or giants have clear spectral signatures at distances of order of 1 kpc. If the measured spectroscopic period is orbital and CP Pup is not a triple or multiple system, the most likely reason for the absurd result of the disk accretor model is simply that the accretion is funneled by a magnetic field and does not occur through the disk. The saddled line profiles show that a disk exists, however if the innermost part of the accretion disk is disrupted by the magnetic field of an IP, the radial velocity is not measured close to the WD, but at the Alfvèn radius.
Finally, we do not rule out that the radial velocities measurements are inaccurate because the emission lines are contaminated by multiple components. The optical spectrum does show very complex velocity profiles, with multiple components in the emission lines (B08); some of these components may be produced in a hot spot on the WD or in an accretion stream rather than in the disk. B08 describe these possibilities in detail, but they conclude that assuming that CP Puppis is an IP and that the 1.47 hours period is orbital does not completely resolve the issue. Analysing new spectroscopic and photometric data taken over several years, B08 find that the structure of the emission lines is very complex and the velocity of the inner disk was not accurately determined, alleviating somewhat the “mass function problem”, but at the same time making the study of the system extremely difficult.
When we proposed observing CP Pup with XMM-Newton, one of our aims was to resolve the mass problem, possibly revealing the spin period of a magnetic WD. One of the characteristics signatures of IP systems is in fact that the X-ray flux is usually modulated with the rotation period of the WD, which does not rotate synchronously with the orbital period like in “polar” systems. Typical spin periods of IP are of the order of tens of minutes. A new X-ray observation of CP Pup also had a broader scope than learning the details of a single system. Because of the selection effect due to the outburst amplitude, classical novae are observed at larger distances than other CV, and they are rather faint at quiescence. Up to now, only one classical nova, V603 Aql, has yielded a grating spectrum in X-rays (Mukai & Orio 2005). X-ray grating spectra are a fundamental tool in order to study how accretion occurs. Therefore, another important aim we had was to broaden the statistics, obtaining another term of comparison to learn how accretion occurs in novae. CP Pup is the third brightest classical nova in X-rays at quiescence, after V603 Aql and GK Per.
1.2 V351 Pup: a cooling nebula?
V351 Pup was discovered in outburst in 1991 December 27 (Camilleri 1992). It was a moderately fast classical nova, with t2 and t3 of 16 and 40 days, respectively and ejection velocity 2000 km s-1 on average (Shore et al. 1992, Sonneborn et al. 1992). It was also a neon nova (Pachoulakis & Saizar 1995).
An X-ray flux in the 0.2-2.4 keV range F erg cm-2 s-1 was measured with ROSAT 16 months after the outburst (Orio et al. 1996). The spectrum was quite hard in the ROSAT range and Orio et al. (1996) suggested that the X-ray emission could originate either in the cooling nova shell, or be due to renewed accretion. In Orio et al. (2001) we already announced and discussed that the nova was not detected with ASCA, with a strict upper limit of 10-13 erg cm2 s-1 in the 0.7-10 keV energy range. We concluded in that paper that the first interpretation is definitely the most likely, because the shell cools and disappears as X-ray source, while accretion is expected to continue. We present here a new detection of V351Pup with XMM-Newton, but the data are far poorer in quality than the CP Pup ones, so we will discuss this object in less detail.
2 The new X-ray observations of CP Pup
In the first rows of Table 1 (before the double line dividing the Table in two parts) we give details concerning the X-ray observations of CP Pup done before 1998. The new observations are below the double line. The first of these observations was serendipitously made with the ASCA GIS (Gas Imaging Spectrometers, see Tanaka et al. 1994) on 1998/11/6, during a 50 ksec long exposure of V351 Pup. CP Puppis was in the GIS field of view. The second new observation, of much better quality, was a pointing of CP Pup with XMM-Newton on 2005/6/4, with an exposure time slightly longer than 50 ksec. V351 Pup was at the very edge of the field of view of the EPIC-pn and MOS-1. The XMM-Newton data are exceptionally good for a relatively faint CV like CP Pup. A grating spectrum, albeit with low S/N, has been observed with the RGS. CP Pup is only the second quiescent nova for which a grating X-ray spectrum exists at quiescence, although the S/N is not as high as it was for V603 Aql (Mukai & Orio 2005).
2.1 The ASCA observation
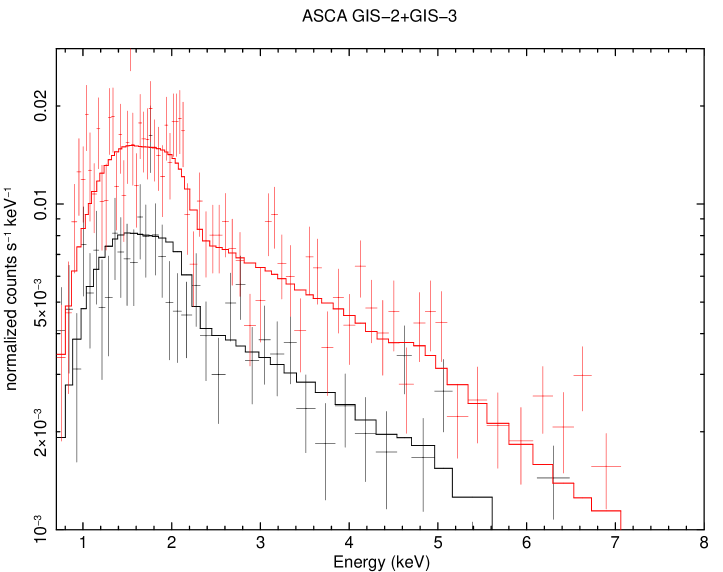
Since CP Pup was 15 arcminutes off-axis, it was observed only with the ASCA GIS detectors, but not with the SIS. The data reduction was performed with FTOOLS, the spectra were fitted with XSPEC (Arnaud 1996). The spectra are shown in Fig. 1. The quality of the data is poor, but it allows a useful comparison with the previous Einstein and ROSAT observations (see first part of Table 1). Table 1 gives the count rates and the unabsorbed flux derived assuming the best-fit single components thermal models of Balman et al. (1995) for the ROSAT data. The best fit with three temperature components to both GIS detectors (with reduced =1) indicates a 0.7-10 keV unabsorbed flux 6.2 erg s-1. In the 0.7-2.4 keV band the flux is 2 erg s-1, within the 3 errors of the fits to the ROSAT data. However, with all models the fit temperature is unbound, because the best fit is obtained with the plasma temperature, or the highest temperature component, equal to the upper limit allowed by the model. The 2 error in the flux indicated in the Table is also limited at this value. The ASCA flux is in agreement with the unabsorbed flux measured in the XMM-Newton observations described below. We note that three-temperature APEC model that best fits the the XMM-Newton EPIC spectra (see Table 1 and Section 2.2), yields approximately the same parameters for ASCA and XMM-Newton, including the unabsorbed flux. The latter has about the same value in the multiple temperature fit and with the simple one-component models used for the initial comparison with ROSAT (which is also a good fit given the quality of the data).
2.2 XMM-Newton: The spectra
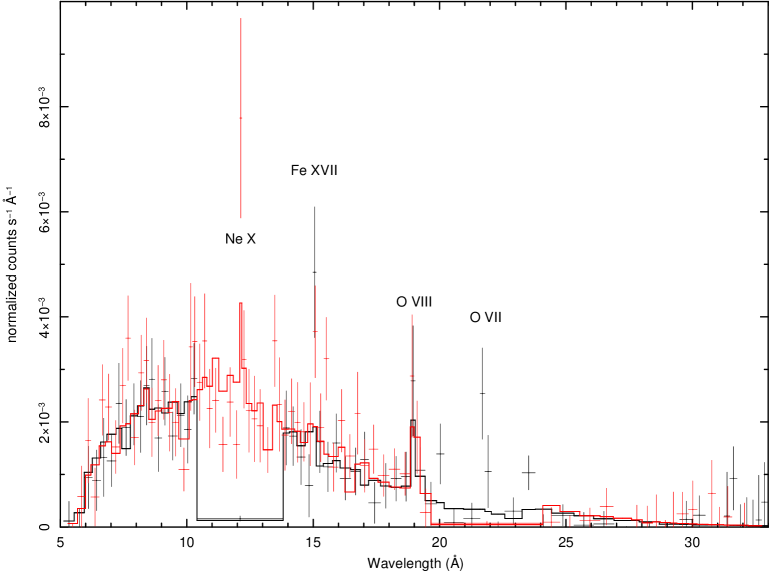
Table 1 gives also the basic results of the XMM-Newton observation of CP Pup. The data were extracted using XMM-SAS version 6.5 including only single and double events (PATTERN4), and the conservative screening criterion FLAG=0. The spectra were fitted with XSPEC. The RGS spectra are shown in Fig. 2, and at first glance appear strikingly similar to the Chandra grating spectra of V603 Aql (Mukai & Orio 2005). We identify a few emission lines beyond reasonable doubts, even if the S/N is too poor to measure line width and possible shifts. The prominent emission lines are marked in Fig. 2: Ne X 12.13, Fe XXV 15.01, O VIII 18.97 and the O VII complex at 21.5-22 Å. Lines of Si, possibly Si XIV 6.18, Si XIII 6.65, and Mg XII 8.42, all observed in the V603 Aql spectrum (Mukai & Orio 2005) may also be present but are not clearly resolved. The RGS-1 and RGS-2 count rate differ because of the different missing chips. The RGS-2 includes the 10.5-14 Å region where the continuum is high and there is the strongest line, Ne X at 12.13 Å, so the count rate is higher than for the RGS-1. The detection of emission lines is very important, because it allows us to test whether the spectrum can be fitted with a more realistic model than a thermal plasma with one or more temperature components, a “cooling flow” model. We used the MKCFLOW model in XSPEC, a steady state, continuously cooling multi-temperature plasma (see Mushotzky & Szymkowiak 1988, and Mukai et al. 2003). This model includes less free parameters than multi temperature thermal bremsstrahlung models in XSPEC, because it uses the emission lines strengths and ratios. The parameters are the lowest and highest temperature, the global metal abundance, the redshift, and the mass accretion rate through the cooling flow. We specify a distance of 1600 pc using the redshift parameter, which the MKCFLOW model interprets as the cosmological redshift and hence an indicator of the distance. MKCFLOW fits well the spectra of different types of CV, and especially those of non-magnetic accretors (Mukai et al. 2003). This model is particularly interesting to us also because, assuming that all accreting matter cools via optically thin thermal X-ray emission, the mass accretion rate trough the cooling flow represents the mass transfer rate onto the WD, a fundamental parameter in the nova thermonuclear runaway models. MKCFLOW yields the best fit to the RGS data. It fits the RGS better than the model used for the EPIC data, the multi-temperature APEC model in XSPEC (see description below). In Fig. 2 we how the fit to the RGS data with the MKCFLOW model and a single absorber, and the fit parameters are given in Table 1. This fit is formally acceptable, with =1, and abundances twice solar, even if the emission lines still seem more prominent than in the model, especially Ne X at 12.13 Å, Ne IX at 13.5 Å, O VIII at 18.97 Å and the He-like O VII complex at 21.5-22 Å. The latter is typical of those magnetic systems whose X-ray spectrum cannot be fitted with the cooling flow model, but it has been observed also in a non magnetic CV, the dwarf nova WX Hydri in which it has been attributed to a wind (Perna et al. 2003). Although with our S/N we do not measure a broadening of the O VII line like Perna et al. (2003) did, we note that we cannot reproduce the observed ratio of O VIII line at 18.97 Å and O VII by varying the temperatures and O abundance. We suggest that also for CP Pup O VII is most likely originated in a wind, or in the circumstellar shell of the ejecta. It certainly does not appear to originate in the accreted material. The other lines mentioned above, especially Ne X are all very prominent also in the V603 Aql spectrum (Mukai & Orio 2005). For V603 Aql, Mukai & Orio hypothesized that an overabundance of Ne in the material accreted from the secondary explains the high flux of the Ne lines. Since CP Pup had a long-lasting extended shell that was repeatedly observed in optical images (e.g. Williams et al. 1982), we do not rule out that the X-ray flux and the emission lines may be partially produced also in the ejecta. The nebula of Nova GK Per emits X-rays even more than a century after the outburst (Balman 2005). DQ Her and RR Pic also showed some extended X-ray emission (Mukai et al. 2003, Balman & Küpcü-Yoldas, 2004). However, the contribution of the shell to the X-ray flux in these novae does not exceed 20%, so we can reasonably assume that at least 80% of the X-ray emission is due to the point source.
In the different thermal models in XSPEC N(H) does not exceed 2 cm-2, the upper limit to the column density to CP Pup indicated also by Balman et al. (1995). The best fit value we obtained for the normalization parameter is = 9.4 M⊙ yr-1, but it depends on the distance. For d=1600 pc, the 3 upper limit is M⊙ yr-1, and conservatively we will assume this as upper limit to the mass transfer rate this nova. However even at the lowest estimated distance, 850 pc, the 3 upper limit is only M⊙ yr-1, the same value obtained for V603 Aql (Mukai & Orio 2005). Thus, the possible range of values is thought to be rather on the low side for a classical nova. The other interesting result we obtain is the high maximum temperature, which is not constrained (80 keV is the maximum value allowed in MCKFLOW), consistently with the spectral fits to the broad band spectra (see also below). One important reason is that that the Ne X H-like line at 12.13 Å is much stronger than the Ne IX He-like triplet around 13.5 Å. H-like lines are emitted over a wider range of temperature than He-like line, and are stronger in a multi-temperature plasma with a wide range of temperatures.
Although values as low as 10 keV are within the 2 error bars because the temperature is not well constrained by the RGS spectra, the high temperature is confirmed by fitting the broad band spectra of the EPIC instruments and ASCA with either MCKFLOW or a multi-temperature APEC model in XSPEC (see Table 1). The APEC code in XSPEC calculates the emission spectrum from a collisionally ionized diffuse gas, using as parameters the plasma temperature in keV, abundances of several elements (C, N, O, Ne, Mg, Al, Si, S, Ar, Ca, Fe, Ni), the redshift, and the electron and proton density. More information can be found at http://hea-www.harvard.edu/APEC/. The best fit is obtained with a three-temperature APEC model for the EPIC spectra for the individual instruments or for all the detectors together, with or without RGS. It is not surprising that APEC fits the broad band spectra better, because MKCFLOW does not yield a very meaningful fit where emission lines are not resolved. The EPIC spectra on the other hand cover the much larger energy range 0.15-10 keV, so the maximum temperature (i.e., the shock temperature) is better constrained, yet the best fit is still obtained with a component at the maximum allowed value, 64 keV. We find that the three EPIC spectra together can only be fitted assuming a temperature component T50 keV, a 3 lower limit. In a fit to the EPIC broad band spectra with MKCFLOW, not included in Table 1 because it is worse than the APEC fit (the reduced value is 1.3), the minimum temperature is also in agreement with the RGS result, and the values are even lower, =3 10-12 M⊙ year-1 and = 3.7 10-12 M⊙ year-1 respectively for the EPIC pn and MOS data, = 6.9 10-12 M⊙ year-1 for the ASCA data. There is only an upper limit for the visual luminosity before the outburst, V17 (Payne Gaposhkin 1964), and CP Pup is currently at much higher optical luminosity than before the outburst, as we discuss in Section 3.1, so it seems very unlikely that this low value is explained with the “hibernation” model (Shara et al. 1986). The fact that this nova has not completely returned to the quiescent visual luminosity after so many years probably indicates that shortly before the eruption was even less high than now, after 65 years.
We remark again that ASCA flux of 1998 (see Table 1) is in agreement with the XMM-Newton results for all thermal models. The ROSAT and Einstein flux was not well constrained, but it was within the 3 limits assuming most models. The flux could not be well determined in those short observations with narrow bandpass (especially ROSAT) that only sampled the low tail of the X-ray spectrum. Variations in N(H) or small changes in the minimum temperature of the cooled plasma may also produce a discrepancy.
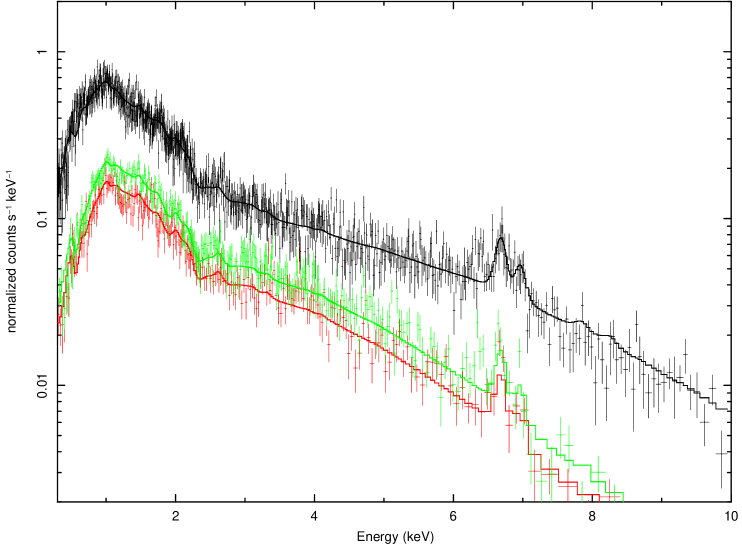
We note that the iron K complex is detected in the EPIC spectrum (see Fig. 3). The H-like line and the He-like complex (as a whole) are resolved and like for other CV, a fluorescent line at 6.4 keV is also present, that is not produced in the thermal plasma model. It originates in “cold” iron, in any ionization state, and is due to scattering of X-rays (see discussion by Hellier & Mukai, 2004). In the EPIC-pn spectrum this line seems to be broad and we note that it shows a hint of a large red wing (perhaps extending as much as 200 eV to the red), suggestive of the “Compton down-shifted” shoulder like the one detected in GK Per (Hellier & Mukai 2004). The H-like line appears to be quite less prominent than the He-like complex, like for Ne in the RGS range. The best fit to the EPIC spectra is obtained with an APEC thermal model with three temperature components. Adding a new component does not improve the fit. The minimum value obtained for the temperature in the RGS MKCFLOW fit is 0.8 keV, and the coolest temperature component is at 0.9 keV in the fits to the EPIC instruments. The intermediate component temperature in the APEC model fits to the EPIC data, like for the ASCA data, is around 5-6 keV for the different instruments.
The most significant parameters obtained from the spectral fits are and the highest temperature is T 50 keV for all models fitted to the spectra of all detectors. This temperature represents the best estimate of the shock temperature. Following Wu et al. (2003, and references therein), in a magnetic CV the shock temperature in keV is related to MWD by a simple relationship:
| (1) |
where is the mean molecular weight. For 0.5, if there is no significant expansion of the accreted envelope (that is, the WD radius is not extremely bloated, which however would cool the envelope layers and disrupt the continuity of H burning) the post-shock temperature exceeds 60 keV only for M 1.1 M⊙, a lower limit for the WD mass. The lower limit to the WD mass is even higher if CP Pup is not a magnetic accretor. For the case of a disk accretor in which half of the shock energy is dissipated in radiation, Luna & Sokoloski (2007, and see references therein) show that the maximum temperature exceeds 50 keV if M 1.3 M⊙, assuming no significant variation in radius during quiescent hydrogen burning.
3 Timing analysis for CP Pup
We do not observe for CP Pup the type of irregular aperiodic variability on minutes time scales that was observed for V603 Aql, but there is a prominent peak in the Fourier spectrum of the EPIC-pn and EPIC-MOS light curves, corresponding to three periods that are very close the spectroscopic one: 0.0602587 days for the pn, and 0.0616597 days for MOS 1, 0.0620440 days for MOS 2. The 1 uncertainties in the determination of these periods are about 7 minutes, so not only are these three periods well within each other’s statistical errors, but they are also in agreement with the spectroscopic period determined by B08, 0.0612643 days. We also split the EPIC pn light curve in three energy ranges, 0.2-0.8 keV, 0.8-2 keV, and 2-10 keV. The most prominent peak corresponds to periods of 0.0601676 d, 0.0612797 d, and 0.0594426 d, in each of the three bands respectively. These three periods are all consistent within the statistical error in the determination. Fig. 5 shows the EPIC-pn light curve in the 0.2-10 keV range folded with the period of B08. In Fig. 6 we show instead the light curves of the three energy bands indicated above, folded with the best X-ray period obtained in the whole wavelength range. It is evident that the largest modulation is in the 0.8-2 keV range. Using the ephemeris of B08, T0= JD 2450157.6405 and the above period, there seems to be a small phase shift between optical-spectroscopic and X-ray period (see Fig.5). The maximum individual value in the X-ray light curve is measured at spectroscopic phase =0.1, however the fit with a sine function, with an amplitude modulation of (24.80.1)% with respect to the average value, indicates a maximum at phase 0.01800.0006. The curve shown in Fig. 5 is a fit with a reduced =1, but it may not be meaningful, since there is an error of 0.017 s in the determination of the spectroscopic period, which may add up to even 20% of the period in 10 years. The spectroscopic phase 0.0 is defined as the epoch of red-to-blue crossing of the emission line radial velocity curve. In the baseline interpretation, the spectroscopic period is the orbital period and phase 0.0 corresponds to the inferior conjunction of the secondary. High inclination non-magnetic CVs have an X-ray minimum around phase 0.0 (eclipse) or around phase 0.75 (dips). Orbital modulations of X-ray flux have also been observed in many IPs at similar phases (e.g., Parker et al. 2006).
We used discrete Fourier transformation techniques for a period search. Due to the periods of very high cosmic background that we had to exclude (approximately a total 35% of the exposure time), we also used the CLEAN algorithm (Roberts et al. 1987) to eliminate spectral peaks originating from the temporal distribution of the data. The CLEANed power spectrum does not show any other significant peaks, so we rule out modulations of the X-ray flux on time scales of tens of minutes, characteristic of the rotation periods of many IP’s. We conclude that we could not prove the magnetic nature of CP Pup by detecting the WD spin period in X-rays.
To better examine the spectral variations during the orbital period, we plotted the count rate ratio in the 0.2-0.8 keV, most effected by absorption, over the count rate in the 2-10 keV band, least effected by absorption, and folded this ratio with the spectroscopic period. We do find a modulation of this softness ratio, but the fit with sinusoidal functions in this case would not be good (attempts to do it yield a large ). The curve seems to be asymmetric around the maximum measured value, that falls again at spectroscopic phase 0.1. Like for many magnetic CV, this asymmetry may be real and due to how accretion occurs. This modulation of the softness ratio is consistent with absorption modulating the X-ray flux, but the situation may be rather complex with several different emitting regions. We extracted the the RGS spectra only at X-ray phases 0.10-0.25 and 0.75-1, and then we repeated the exercise for X-ray phase 0.25-0.75, to study the “bright” and “faint” half of the period, and we found no difference in the emission lines strength in the RGS spectra, even if the count rate is lower in the faint time. Thus the explanation in terms of varying absorption along the line of sight may be too simplistic.
| Instrument | Year | Bandpass | Count rate | Model | N(H) (1021 | T | Flux (10-12 |
| (keV) | (cts s-1) | cm | (keV) | erg s-1) | |||
| Einstein IPC | 1980 | 0.2-4 | 0.0600.006 | TB | 1(F) | 4 | 3.0 |
| ROSAT PSPC | 1990 | 0.2-2.4 | 0.0610.021 | ||||
| (survey) | |||||||
| ROSAT PSPC | 1992 | 0.1-2.4 | 0.0670.004 | TB | 2 | 3 | 3.0 |
| 0.1-2.4 | RS | 2 | 1 | 0.9 | |||
| ASCA GIS-2 | 1998 | 0.7-10 | 0.02030.0009 | RS | 1(F) | 64 | 6.1 |
| 0.7-2.4 | RS | 1(F) | 64 | 2.0 | |||
| ASCA GIS-3 | 1998 | 0.7-10 | 0.04120.0012 | RS | 1(F) | 64 | 6.1 |
| ASCA GIS-2/3 | 1998 | 0.7-10 | TB | 1(F) | 199 | 6.41.2 | |
| 0.7-2.4 | TB | 1(F) | 199 | 2.0 | |||
| ASCA GIS-2/3 | 1998 | 0.7-10 | 3T | 2.3 | 64 | 6.72.0 | |
| 0.7-2.4 | 3T | 2.3 | 64 | 2.01.9 | |||
| RGS-1 | 2005 | 0.33-2.5 | 0.01950.0015 | MKCF | 1.92 | 78 | 2.30.2 |
| RGS-2 | 2005 | 0.33-2.5 | 0.02490.0016 | MKCF | 1.92 | 78 | 2.30.2 |
| RGS-1/2 | 2005 | 0.33-2.5 | 3T | 1.6(F) | 77 | 1.40.2 | |
| EPIC-pn | 2005 | 0.15-10 | 1.30900.0074 | 3T | 1.43 | 64 | 6.80.7 |
| 0.15-2.4 | 3T | 1.43 | 64 | 2.40.1 | |||
| MOS-1 | 2005 | 0.3-10 | 0.37820.0036 | 3T | 1.73 | 64 | 7.30.8 |
| MOS-2 | 2005 | 0.3-10 | 0.42510.0035 | 3T | 1.73 | 64 | 7.30.8 |
| MOS | 2005 | 0.3-2.4 | 3T | 1.73 | 64 | 2.40.2 | |
| All EPIC | 2005 | 0.3-10 | 3T | 1.53 | 64 | 6.90.7 | |
| 0.3-2.4 | 3T | 1.53 | 64 | 2.40.3 | |||
| All XMM | 2005 | 0.33-2.5 | 3T | 1.34 | 64 | 2.20.3 |
| Filter | Initial time | JD | Exposure (s) | Magnitude | ||
|---|---|---|---|---|---|---|
| U | 15:09:50 | 2453526.1318287 | 1008 | 14.1330.005 | 0.94 | 0.19 |
| U | 16:14:59 | 2453526.1770718 | 1000 | 14.0900.005 | 0.68 | 0.19 |
| U | 17:20:08 | 2453526.2223148 | 1001 | 14.0840.005 | 0.42 | 0.19 |
| B | 18:25:17 | 2453526.2675579 | 1001 | 15.4140.007 | 0.16 | 0.19 |
| B | 19:30:27 | 2453526.3128125 | 1001 | 15.3890.007 | 0.89 | 0.19 |
| UVW1 | 21:35:35 | 2453526.3997106 | 2001 | 14.1540.006 | 0.31 | 0.38 |
| UVW1 | 22:27:25 | 2453526.4357060 | 4999 | 14.1230.004 | 0.90 | 0.94 |
| UVW1 | 1:09:13 | 2453526.5480671 | 2001 | 14.1370.006 | 0.60 | 0.38 |
| UVM2 | 2:31:03 | 2453526.6048958 | 3124 | 14.6020.013 | 0.66 | 0.59 |
| UVM2 | 4:11:37 | 2453526.6747338 | 2000 | 14.5720.016 | 0.67 | 0.38 |
3.1 CP Pup: Optical Monitor measurements and comparison with IUE
Photometry was done during the X-ray exposures with the Optical Monitor and the B, U, UVW1 and UVM2 filters. The exposures were all longer than 1000 seconds, which is a significant fraction of the 5290 s spectroscopic and putative orbital period, so no variability was detected in any of the filters in two or three successive exposures. The results are reported in Table 2. In the optical range, there are few terms of comparison, but we note that the USNO magnitudes in 1978 were B=14.1 and R=13.7, and Fig. 3 of White et al. (1993) shows that in 1987, CP Pup had an average value of B14.8, with a total amplitude of the photometric modulation of about 0.43 magnitudes. The magnitude B=15.4 in Table 2 is significantly higher, and implies that CP Pup is slowly returning to pre-outburst luminosity. Photometric monitoring is strongly encouraged to understand the long term evolution of this nova.
While the B magnitude shows a significant decrease, the UV flux seems to have remained approximately constant in recent years. CP Pup was observed with IUE. Exposures with the SWP (Short Wavelength Prime Camera) and with the LWP (Long Wavelength Prime Camera) were taken on 1986 February 26 and a SWP exposure was done on 1992 May 27. In order to compare the flux, we have to refer to the measurements with the LWP, which partially overlaps with the OM filters. The LWP flux in the range of the UVW1 filter is (1.01 erg cm2 s-1 Å-1 (averaged on an exposure of 5100 s, a time comparable with the spectroscopic period). The OM magnitudes in Table 2 for the UVW1 OM filter (2450-3200 Å, effective wavelength=2910 Å) correspond to a flux 8.50 Å-1 erg cm2 s-1 Å-1 and the UVM2 flux (2000-2600 Å, effective wavelength=2310 Å) is 6.45 erg cm2 s-1 Å-1 . The OM exposures were about 1000 s long, covering a significant portion of the spectroscopic phase. We conclude that there is no evidence of flux change in the common wavelength range covered by IUE-LWP and by the UV filters of the OM between 1986 and 2005. We will make a few other comments about the IUE archival spectra, that we examined in detail. Matching SWP and LWP spectra of 1986 to evaluate the absorption is not possible because the data are very noisy in the 2200 Å region. The two SWP exposures of different epochs are comparable in length (18000 s in 1986 and 18900 s in 1992) but in 1992 the SWP spectrum showed approximately a decrease by 30%, so there may be variability on long time scales. Although the SWP spectra had poor S/N, emission lines of N V, O I, C III, Si IV, C IV, He II, N IV and possibly O V at 1372 Å were definitely detected. Other IP, and all magnetic CV in general, show the same emission lines (Howell et al. 1999), but a reliable characterization of the spectra, with the poor S/N obtained, is not possible.
4 Discussion of the CP Pup results
We find that the X-ray spectrum of CP Pup indicates a very high maximum temperature (unbound by the models), consistent with a very high mass WD. Equation (1) yields M M⊙ for an IP. Under “standard” assumptions for accretion only through a disk, we derive M M⊙. We also find that the WD must be accreting at relatively low rate compared to the estimates for other novae, M⊙ yr-1. Since we do not observe a hot central source, the secondary is not irradiated and it is reasonable to assume that is still, or has returned to, the pre-outburst level. The value we derive for is in agreement with the models of Prialnik & Kovetz (1994) and Kovetz & Prialnik (1995) for a fast nova on a high mass WD. The nova parameter space was explored by this group in the two papers above and in Yaron et al. (2005). According to these authors t2 and t3 are inversely proportional to the WD mass, and a large amplitude nova with moderately high ejection velocity occurs on a massive WD only if M⊙ yr-1, which is believed to be lower than of most novae. CP Pup fits this predictions very well. In Epelstein et al. (2007) the authors make another prediction, namely that a massive WD becomes increasingly much hotter with the number of nova outbursts it experiences. A luminous and fast eruption is only possible at the beginning of the outbursts’ cycle. If this is true, CP Pup must be at the beginning of the nova cycle, and the next outburst (which however will occur in more than 105 years due to the low ) will already be less luminous. In any case, the large WD mass coupled with low probably explains why the ejecta velocity was not as high as in some other large amplitude, luminous novae. In this respect our X-ray observations nicely confirm the nova theory.
We measured an X-ray flux modulation of about 50% amplitude with the optical spectroscopic period, generally thought to be the orbital period . We note that also the optical and IR modulations have approximately the same amplitude. This similar behavior in very different energy bands cannot be easily explained with the superhump model, neither with ellipsoidal variations.
If the inclination of CP Puppis is less than 35o, as inferred with the ellipsoidal variation interpretation of the light curve (see Section 2), no orbital modulations are expected for a disk accretor. Thus, our baseline interpretation, that the 1.47 hour spectroscopic period is the orbital period, encounters a series of difficulties. If CP Pup is non-magnetic, then the emission line radial velocity curves suggest an unrealistically low-mass white dwarf, and we have no explanation for the X-ray ”orbital” modulation. If CP Pup is an IP, the X-ray ”orbital” modulation is less of a problem, since X-ray orbital modulations are much more common in IPs, with multiple origins being discussed (Parker et al. 2006). However, in this case, the complete lack of the spin period (at P1.47 hr) is a severe problem.
We therefore propose an alternative scenario, in which the 1.47 hour spectroscopic period is the spin period of the magnetic white dwarf, and the true orbital period has never been detected in the observations to date. In this case, we have indeed detected the WD spin in X-rays, and more optical observations are needed instead to discover the true orbital period of CP Pup. Without invoking superhumps, the difference in spectroscopic and photometric periods of CP Pup is naturally explained if the modulations of the flux and of the spectral lines are caused by variations in the accretion disk, as it is periodically illuminated by the hot polar caps of an IP while the WD rotates. One possible model is the one by Chanan et al. (1978) proposed by Penning (1985) to explain the radial velocity periods of four different IPs. Another example of spectral line variations in a rotating WD is the EX Hya, another IP (Belle et al. 2005). The optical emission lines in these systems vary periodically because of the illumination effect, so that the phasing of the X-ray flux with the optical spectroscopic period is quite close. This interpretation avoids the mass problem for CP Pup, and explains why the attempt to determine the mass of the WD from the mass function, assuming that the spectroscopic period is the orbital one, gives an unreasonable result.
The question is of course why the true orbital period has remained undetected and in which range it should be searched. The system has a sizable disk, because the optical emission lines often show the saddled profile. In an IP, the disk is disrupted at the Alfvèn radius. If the spin period is about an hour and a half, the orbital period is expected to be at least 10 times larger. We also note that, if the photometric period is the beat of the orbital and spin period, the orbital period turns out to be 16.17 hours. However, CP Pup has an undetected secondary. With an orbital period larger than 10 hours, the secondary is evolved and is always detected in CV at d2 kpc. The non-detection of the secondary in the optical spectrum therefore puts another serious constraint on the length of the orbital period. It seems difficult to admit that it is sufficiently longer than a night-time span to have not been detected yet in 3-4 nights runs.
Could the orbital period instead be short and yet have gone undetected in optical? It seems that this may be true only if CP Pup is an EX Hya-like system, that is an IP with spin period that is shorter by only less than 40% than the orbital one (Norton et al. 2004, 2008). Instead of a real accretion disk, in these systems there is a “ring-like” structure, rotating at non-Keplerian velocity. The possibility that disk of CP Pup is a thin ring of this kind is indeed intriguing. The profile of the optical emission lines of CP Pup is not very definite and simple to interpret (B08). The emission lines of the proto-type system EX Hya (Belle et al. 2005) appear to have a saddled profile like expected in “traditional” disks, and observed for the optical emission lines in the CP Pup optical spectrum. In a EX Hya type system, orbital and spin period can be even very close in length. This may be the case of CP Pup. For the time being, this is only a speculative suggestion, but it certainly deserves renewed optical monitoring to be explored.
5 Nova Puppis 1991
The ASCA upper limit to the X-ray flux of this nova is 10-13 erg cm-2 s-1 in the 0.3-10 keV range, much below the value F erg cm-2 s-1 observed with ROSAT in 1993 April. We detected V351 Pup in 2005 serendipitously with XMM-Newton, at the edge of the EPIC detectors. The MOS1 count rate is 0.00150.0004 cts s-1. The source is even more peripheral in the pn observation, and is not fully observed, so the count rate is only 0.00320.0010 cts s-1. The flux measured with the MOS is 6 erg cm-2 s-1 in the 0.2-10 keV range. Assuming a Raymond-Smith model of thermal plasma emission with the value of the column density 2 1021 cm-2 measured by Orio et al. (1996), the unabsorbed flux is F erg cm-2 s-1. a factor of 50 less than in 1993 April. The X-ray luminosity does not exceed 3 1031 erg s-1 in the XMM-Newton observation. The most likely interpretation is that the X-ray flux was due to the ejecta back in 1993, which by 2005 had cooled. The X-ray emission observed in 2005 is most likely due to accretion, although the poor quality of the data does not allow any definite conclusion.
6 Conclusions
CP Puppis is only the second classical nova for which an X-ray grating spectrum could be obtained at quiescence. Even if with low S/N, this spectrum shows strong emission lines which probably mainly arise in a cooling flow, either in the thermal plasma of disk or of accretion columns of a magnetic WD. There is at least one emission complex (O VII at 21.6-21.8 Å), that most likely arises instead in a wind from the system, or in a circumstellar nebula. CP Pup had a very large outburst amplitude, a short t3, and only moderately high ejection velocity. Examining a number of theoretical papers quoted above, we find that these characteristics are explained by the upper limit to the mass accretion rate M⊙ year-1, and by the lower limit for the WD mass, M(WD)1.1 M⊙, obtained by fitting the X-ray spectra. The X-ray observation of this nova at quiescence therefore confirm the nova theory, offering a rare possibility to probe it in detail. The models of WD thermonuclear burning and runaways are also at the base of type Ia SN studies, and testing them is important for all aspects of modern astrophysics, including cosmology.
The puzzle of the WD mass of CP Puppis is not solved yet. With our observations, we could not demonstrate univocally that the WD is magnetic and the disk is disrupted far from the WD, however the high Lx is typical for an IP. The only point we found against the magnetic nature is relevant only if the detected X-ray modulation is orbital: the X-ray orbital modulation of CP Pup is larger at intermediate energy (0.8-2 keV), although in known IP’s the amplitude of orbital modulations generally decreases with energy (e.g. Hellier et al. 1993, Parker et al. 2006). On the other hand, the mere existence of an X-ray flux modulation with the optical-spectroscopic period argues in favor of an IP, no matter how it is interpreted. If it is orbital, it would not be detected in a non-eclipsing disk accretor. If it is rotational, detection of the WD spin is indeed expected for an IP. The high WD mass is also proof that the non-magnetic, disk accretor model does not work for CP Pup. It cannot be ruled out that all the observed periodicities at different wavelengths, including our X-ray modulation, are related to the WD rotation and the true orbital period has never been detected. This suggestion, for the time being, is only a working hypothesis that will need to be supported by further observations, especially by long optical photometric campaigns.
Finally, we also detected V351 Pup 14 years after the outburst, at least 50 times less luminous than 12 years earlier. This seems to indicate that the much larger hard X-ray luminosity at that time was due to the ejected shell, which had already cooled in 2005. Nova shells are known to be conspicuous X-ray sources after the outburst (see for instance the shell emission of RS Oph, Nelson et al. 2008) and in most novae they seem to cool very rapidly (Orio et al. 2001). An upper limit for the cooling time of the V351 Pup shell is 6 and a half years, the time elapsed between the ROSAT and ASCA observation.
References
- (1) Balman, S. 2005, ApJ,627, 933
- (2) Balman, S., & Küpcü-Yoldas, A. 2004, in Magnetic Cataclysmic Variables, editors S. Vrielmann ad M. Cropper, ASP Conf. Proc. 315, 172
- (3) Balman, S., Orio, M., & Ögelman, H. 1995, ApJ, 449, L47
- Be (05) Belle, K.E., et al. 2005, AJ, 129, 1985
- (5) Baskill, D.S., Wheatley, P.J, & Osborne, J.P. 2005, MRAS, 357, 626
- (6) Bianchini, A., Friedjung, M. & Sabbadin, F. 1985a, IBVS 2650
- (7) Bianchini, A., Friedjung, M. & Sabbadin, F. 1985b,
- B (08) Bianchini, A., et al. 2008, preprint in Recent results on Cataclysmic Variables, ESA SP-236, 77, Noordwijk
- (9) Chanan, G.A., Nelson, J.E., & Margon, B. 1978, ApJ, 226, 963
- (10) Cohen, J.G., & Rosenthal,A.J. 1983, ApJ, 268,689
- (11) Diaz, M.P., Bruch, A. 1997, A&A, 322, 807
- Diaz (91) Diaz, M.P., & Steiner, J.E. 1991, 103, 964
- (13) Downes, R.A., Dürbeck, H.W. 2000, AJ, 120, 2007
- (14) Epelstein, N., Yaron, O., Kovetz, A., Prialnik, D. 2007, MNRAS, 374, 1449
- (15) Hellier, C., Garlick, M.A., Mason, K.O. 1993, MNRAS, 260, 299
- (16) Hellier, C., & Mukai, K. 2001, MNRAS, 352, 1037
- (17) Howell, S., Cash, J., Mason, K.O., & Herzog, A.B. 1999, AJ, 115, 1014
- (18) Howell, S., Ciardi, D.R., Sirk, M.M. & Schwope, A.D. 2002, AJ, 123, 420
- (19) Howell, S., Gelino, D.M., & Harrison, T.E. 2001, AJ, 121, 482
- (20) Kellogg, E., Baldwin, J.R., & Koch, D. 1975, ApJ, 199, 299
- (21) Kovetz, A. & Prialnik, D. 1994, ApJ, 424, 319
- Livio (88) Livio, M., Shankar A., & Truran, J. 1988. ApJ, 330, 264
- (23) Luna, J.G.M., & Sokoloski, J.L. 2007, ApJ, 671, 741
- (24) Mukai, K., Still, M., & Ringwald, F. 2003, ApJ
- (25) Mukai, K., & Orio, M. 2005, ApJ, 622, 602
- (26) Mushotzki, R., & Szmkowiak, 1988, in Cooling Flows in Clusters and Galaxies, A. Fabian ed., Kluwer, 53
- (27) Nelson, T., Orio, M., Cassinelli, J., Still, M., & Mucciarelli, P. 2008, ApJ, 673, 1067
- (28) Ness, J.U., et al. 2003, 594, L127
- (29) Norton, A.J., Butters, O.W., Parker, T.L., & Wynn, G.A. 2008, ApJ, 672, 524
- (30) Norton, A.J., Wynn, G.A., & Somerscales, R.. 2004, ApJ, 614, 349
- (31) O’Donoghue, D., Warner, B., Wargau, W., & Grauer, A.D. 1989, MNRAS, 240, 41
- (32) Orio, M., Ögelman, H. & Trussoni, E. 1992, A&A, 257, 548
- Or (96) Orio, M., Balman, S., Della Valle, M., Gallagher, J. & Ögelman, H. 1996, ApJ, 466, 410
- (34) Parker, T.L. 2006, PhD Thesis at the Open University
- (35) Payne Gaposhkin, C. 1964, The Galactic Novae, Dover Publications: New York
- Pat (1998) Patterson, J., & Warner, B. 1998, PASP, 110, 1026
- P (85) Penning, W.R. 1985, ApJ, 289, 300
- P (03) Perna, R., McDowell, J., Menou, K., Raymond, J., & Medvedev, M.V. 2003, ApJ, 598, 545
- PK (95) Prialnik, D., & Kovetz, A. 1995, ApJ, 445, 789
- (40) Raymond, J.C., & Smith, R.W. 1977, ApJS, 35, 419
- (41) Roberts, D.H., Lehar, J. & Drehler, J.W. 1987, AJ, 93, 968
- (42) Shara, M., Livio M., Moffat, A.F.J., Orio, M. 1987, ApJ, 311, 163
- (43) Shore, S., et al. 1992, IAU Circ. 5523
- (44) Starrfield, S., Truran, J.W., & Sparks, W.M. 2000, NewAR 44, 81
- SzF (1988) Szkody, P., & Feinswog, L. 1988, ApJ, 334, 422
- (46) Tanaka, Y., Inoue, H., & Holt S.S. 1994, PASJ, 46, L37
- Tov (01) Tovmassian, G.H., et al. 2001, A&A, 379, 199
- (48) Warner, B., 1985, MNRAS, 17, 1P
- (49) White, J.C., Honeycutt, R.K., & Horne, K. 1993, ApJ, 412, 278
- (50) Williams, R.E., 1982, ApJ, 261, 170
- (51) Wu, K., Cropper, M., & Ramsay, G. 2003, ChJAS, 3, 235
- (52) Yaron, O., Prialnik, D., Shara, M.M., Kovetz, A. 2005, ApJ, 623, 398


.

