75282
E. Angelakis
Monitoring the radio spectra of selected blazars in the Fermi-GST era
Abstract
The analysis of the spectral energy distribution variability at frequencies from radio to TeV is a powerful tool in the investigation of the dynamics, the physics and the structure evolution occurring in the most exotic flavour of active galaxies, the blazars. In particular, the presence of Fermi-GST is providing a unique opportunity for such studies delivering -ray data of unprecedented quality. Here we introduce a monitoring program that has been running at the Effelsberg 100 m telescope since January 2007, underpinning a broad multi-frequency collaboration of facilities that cover the band from radio to infrared. Sixty one selected blazars are observed monthly between 2.64 GHz and 43 GHz. The calibration accuracy is better than a few percent as it is demonstrated with some preliminary examples.
keywords:
Galaxies: active – Galaxies: nuclei – Radio continuum: galaxies – BL Lacertae objects: general1 Introduction
| Target sources | ||
|---|---|---|
| PKS 0003066 | TXS 0814425 | OE 355 |
| PKS 0215015 | 1E 0317.018 | OJ 248 |
| PKS 0235164 | H 1426428 | OJ 287 |
| PKS 0238084 | 1ES 1959650 | OP 313 |
| PKS 0336019 | 1ES 2344514 | 3C 84 |
| PKS 0420014 | 1ES 1544820 | 3C 111 |
| PKS 0528134 | 1ES 0502675 | 3C 120 |
| PKS 0735178 | 0059581 | 3C 273 |
| PKS 0748126 | 0219428 | 3C 279 |
| PKS 1038064 | 1128592 | 3C 345 |
| PKS 1127145 | Mkn 180 | 3C 371 |
| PKS 1406076 | Mkn 421 | 3C 446 |
| PKS 1510089 | Mkn 501 | 3C 454.3 |
| PKS 1730130 | 4C 21.35 | CTA 102 |
| PKS 2155152 | 4C 28.07 | Cyg A |
| PKS 2155304 | 4C 31.63 | BL LAC |
| PKS 234516 | 4C 38.41 | WCom |
| S5 083671 | 4C 56.27 | M87 |
| S5 180378 | 4C 47.08 | OS 319 |
| S5 071671 | TON 0599 | |
| S4 095465 | NRAO 150 | |
Being among the most dramatic manifestations of the activity induced in the nuclei of active galaxies, blazars comprise a unique probe of the exotic physics at play in such systems. Their phenomenology is dominated by extreme characteristics such as high degree of linear polarisation, intense variability – both in total power and polarisation – at all wavebands, apparent motions of features in their radio structure, which are often highly superluminal and brightness temperatures exceeding the Compton limit (see e.g. Urry, 1999). This violent behaviour is attributed to relativistic jets oriented very close (to ) to the line-of-sight (see e.g. Urry & Padovani, 1995). Their spectral energy distribution (SED) is characterised by the presence of two peaks. The lower energy one, spreading from radio to far ultraviolet and soft X-rays, is believed to be due to relativistic electrons emitting via the synchrotron mechanism. The high energy part, reaching up to TeV energies is believed to be produced by synchrotron self-Compton or external Compton scattering.
Despite the overall understanding, many details remain unclear and are subject to models attempting their clarification. For instance, several ideas have been put forth to explain the origin of their variability. Two of them are like the shock-in-jet model (e.g. Marscher & Gear, 1985; Aller et al., 1985; Marscher, 1996) and the relativistic plasma shells (e.g. Spada et al., 2001; Guetta et al., 2004). Alternatively, it has been suggested that light-house effect could be causing variability in cases of rotating helical jets or the helical trajectories of plasma elements (e.g. Begelman et al., 1980; Camenzind & Krockenberger, 1992).
A powerful tool in the investigation of these details and for understanding the dynamics, the physics and the structure of the radiating regions is the analysis of the variability of their SEDs at frequency ranges as broad as possible (from radio to TeV). Such an approach can shed light on linear scales inaccessible even to interferometric techniques and most importantly discriminate between different variability scenarios. Particularly, the presence of Fermi-GST is providing a unique opportunity for these studies providing the -ray data of unprecedented quality.
To benefit fully from the newly flying Fermi-GST telescope, a broad collaboration of facilities that aim at understanding the blazar phenomenon via the broad-band SED variability monitoring has been initiated by Fuhrmann et al. (2007). A sample of 61 selected sources are monitored monthly and in tight coordination with other facilities covering the cm, mm, optical and infrared bands (Fuhrmann et al. in prep.). Here we present a very brief introduction of the activities in the centimetric band with the 100 m Effelsberg telescope and show some preliminary examples.
2 The 100 m telescope monitoring program
Observationally, the goal of the currently discussed project is the monthly radio spectrum monitoring for a sample of the 61 sources shown in table 1 with the Effelsberg 100 m telescope. The broad collaboration involves also mainly the 30 m IRAM telescope and the 40 m Owens Valley telescope (Fuhrmann et al., 2007). The former is covering the band between roughly 86 GHz and 270 GHz whereas the latter is focusing on 15 GHz alone to monitor a few hundred sources per day and acquire information about their variability index. The time difference between the Effelsberg and IRAM observations is of order of one to maximum a few days. The monitoring program at Effelsberg has been running continuously since January 2007 providing a remarkable flow of data.
3 The sample
The sources in table 1 have been selected from the “high-priority blazars” list of the Fermi-GST AGN team. There is a remarkable overlap with other studies such as 2 cm-VLBA survey/MOJAVE program (Kellermann et al., 1998; Zensus et al., 2002; Kellermann et al., 2004), the Boston 43 GHz VLBI survey (Jorstad et al., 2001), the IRAM 30-m telescope polarisation monitoring program, the OVRO monitoring program at 15 GHz and other multi-frequency campaigns.
4 Observations and data reduction
For our monitoring program the receivers at 2.64 GHz, 4.85 GHz, 8.35 GHz, 10.45 GHz, 14.60 GHz, 23.05 GHz, 32.00 GHz and 42.00 GHz have been employed. Almost all of them (except for 32.00 GHz) deliver polarisation information, which provides another useful tool in the exploration of blazar physics.
The measurements are conducted with the newly installed adaptive secondary reflector characterised by low surface RMS that induces higher sensitivity (up to 50 % increase at 42.00 GHz). The so-called “cross-scan” observing technique has been applied. The advantage of this method is mainly the fact that it allows the direct detection of cases of confusion as well as the correction for pointing offset errors. The individual spectra are measured quasi-simultaneously within min to guarantee that they are free of source variability of time-scales longer than that.
Considerable effort is put in applying some necessary post-observational corrections to the raw data. Namely, (a) pointing offset correction, (b) gain correction, (c) opacity correction and (d) sensitivity correction (see Angelakis et al., 2008). The sensitivity correction is done with reference to standard calibrators (e.g. table 2). There, the average flux densities are given along with the modulation index, , over a number of measurements (). The modulation index serves as a measure of the source variability. Hence, this table is a demonstration of the system repeatability and the achievable precision on the assumption that the calibrators are intrinsically non-variable.
| 3C 286 | NGC 7027 | |||||
|---|---|---|---|---|---|---|
| 2.64 | 10.7 | 0.7 | 3.7 | 1.1 | ||
| 4.85 | 7.5 | 0.6 | 5.5 | 0.2 | ||
| 8.35 | 5.2 | 0.7 | 5.9 | 0.6 | ||
| 10.45 | 4.5 | 1.8 | 5.9 | 2.3 | ||
| 14.60 | 3.5 | 1.9 | 5.8 | 1.5 | ||
| 23.05 | 2.5 | 2.8 | 5.3 | 2.6 | 6.6 | 5.7 |
| 32.00 | 1.9 | 2.8 | 5.2 | 2.3 | 5.6 | 5.5 |
| 42.00 | 1.4 | 2.1 | 5.0 | 5.0 | 7.0 | 5.4 |
5 Spectra
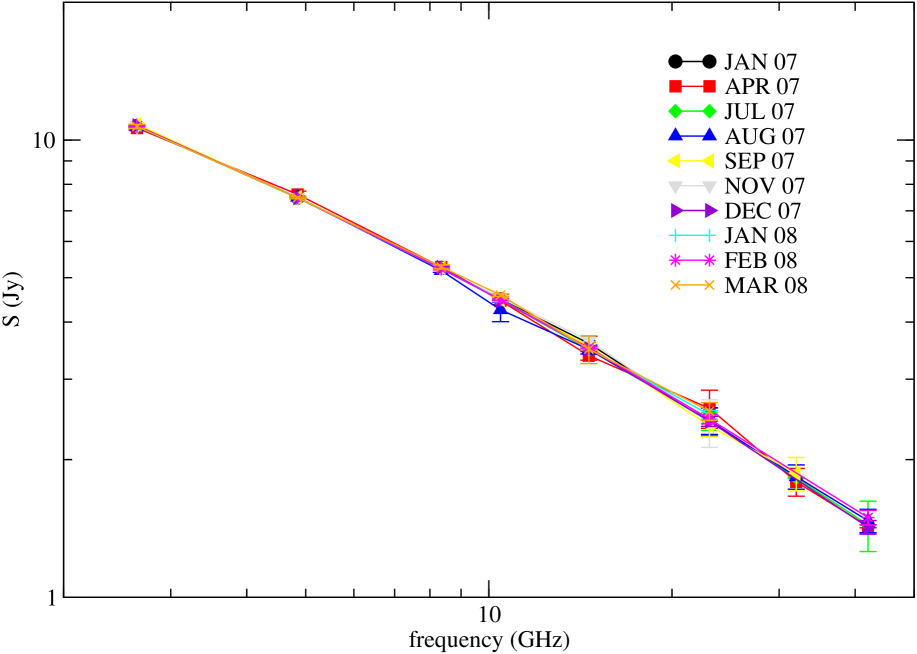
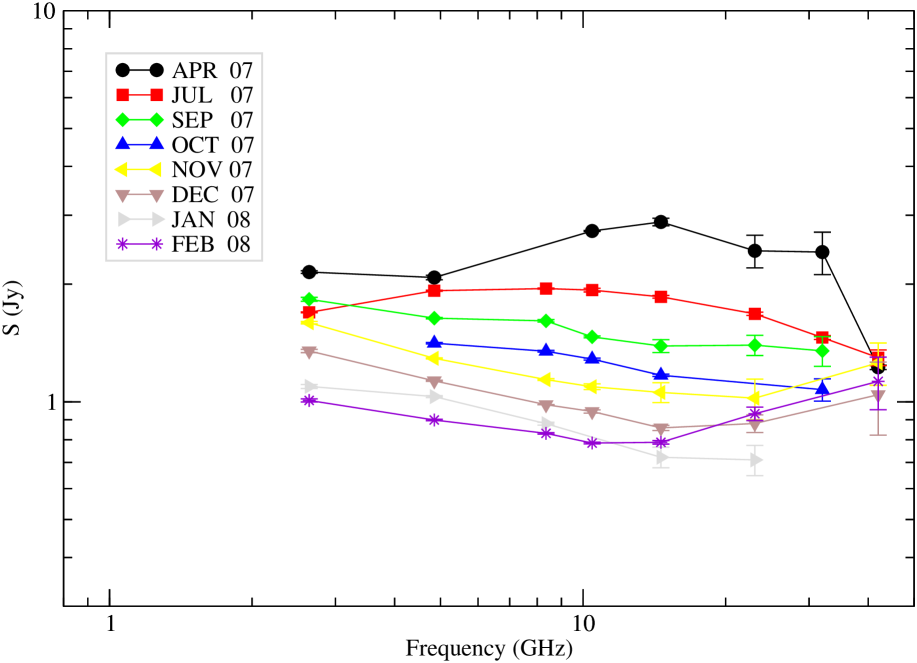
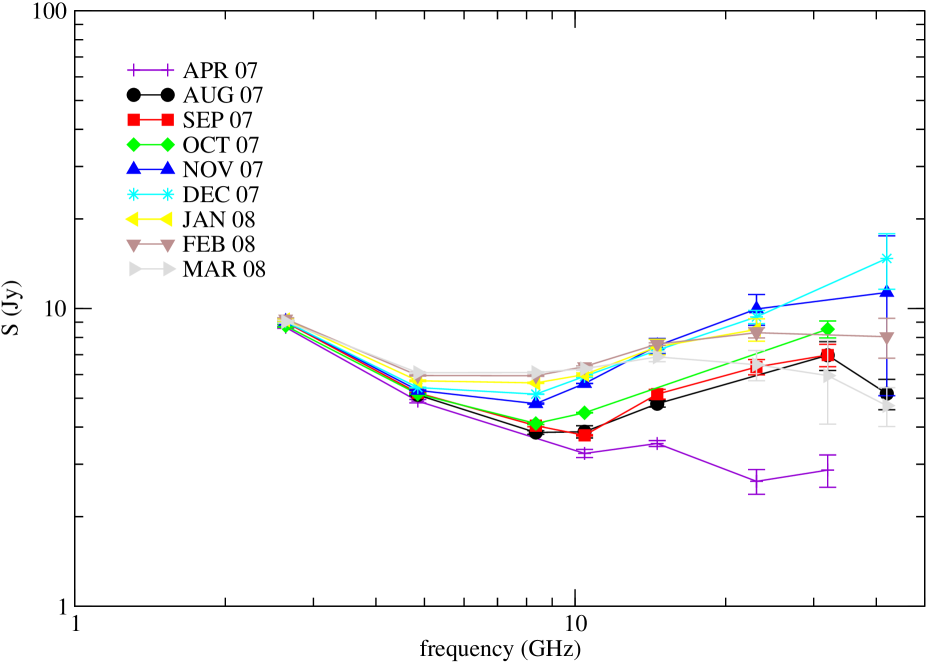
In figure 1 are collected two preliminary examples of spectra measured with Effelsberg. The comparison of these spectra with that of 3C 286 in figure 1(a) illustrates the significance of the observed variability. Remarkably, intense variability appears already in the cm band. Its correlation with that in other bands or possible changes in the structure of interferometric imaging is under examination. It is important to mention that the admittedly larger uncertainties at the higher frequencies is solely due to atmospheric variations.
6 Discussion
Provided that the calibrators are presumably not intrinsically variable, figure 1(a) serves as an excellent means of estimating the system repeatability. In table 2 the calibration precision is of the order of a few percent. Factors that induce such variations are primarily tropospheric variations, opacity effects, confusion and system instabilities. At higher frequencies (23.05 GHz and above), the atmospheric opacity becomes particularly important.
The plots in figure 1 show how intensive and fast the variability of the spectrum may be. This very fact urges for dense frequency coverage especially of the millimetre regime from where the evolution of a flaring event in the radio band is expected to start. The evolution of the spectrum over time is among the first-priority studies. That requires tight coordination of the different participating stations as has been managed so far. The activity seen in the centimetre band is noteworthy. Whether this activity is correlated with that at other bands and especially that at high energies, or with changes in the structure is one of the first questions to be addressed. The behaviour of the polarisation when such an event occurs is also among the most important issues to be investigated.
Acknowledgements.
Based on observations with the 100 m telescope of the MPIfR (Max-Planck-Institut für Radioastronomie).References
- Aller et al. (1985) Aller, H. D., Aller, M. F., & Hughes, P. A. 1985, ApJ, 298, 296
- Angelakis et al. (2008) Angelakis, E., Kadler, M., Lewis, K., Sambruna, R. M., Eracleous, M., & Zensus, J. A. 2008, these proceedings
- Begelman et al. (1980) Begelman, M. C., Blandford, R. D., & Rees, M. J. 1980, Nature, 287, 307
- Camenzind & Krockenberger (1992) Camenzind, M. & Krockenberger, M. 1992, A&A, 255, 59
- Fuhrmann et al. (2007) Fuhrmann, L., Zensus, J. A., Krichbaum, T. P., Angelakis, E., & Readhead, A. C. S. 2007, in American Institute of Physics Conference Series, Vol. 921, ed. S. Ritz, P. Michelson, & C. A. Meegan, 249–251
- Guetta et al. (2004) Guetta, D., Ghisellini, G., Lazzati, D., & Celotti, A. 2004, A&A, 421, 877
- Jorstad et al. (2001) Jorstad, S. G., Marscher, A. P., Mattox, J. R., et al. 2001, ApJS, 134, 181
- Kellermann et al. (2004) Kellermann, K. I., Lister, M. L., Homan, D. C., et al. 2004, ApJ, 609, 539
- Kellermann et al. (1998) Kellermann, K. I., Vermeulen, R. C., Zensus, J. A., & Cohen, M. H. 1998, AJ, 115, 1295
- Marscher (1996) Marscher, A. P. 1996, in ASP Conference Series, Vol. 100, ed. P. E. Hardee, A. H. Bridle, & J. A. Zensus, 45–+
- Marscher & Gear (1985) Marscher, A. P. & Gear, W. K. 1985, ApJ, 298, 114
- Spada et al. (2001) Spada, M., Ghisellini, G., Lazzati, D., & Celotti, A. 2001, MNRAS, 325, 1559
- Urry (1999) Urry, C. M. 1999, Astroparticle Physics, 11, 159
- Urry & Padovani (1995) Urry, C. M. & Padovani, P. 1995, PASP, 107, 803
- Zensus et al. (2002) Zensus, J. A., Ros, E., Kellermann, K. I., et al. 2002, AJ, 124, 662