Dark matter scaling relations and the assembly epoch of Coma early-type galaxies
Abstract
Axisymmetric, orbit-based dynamical models are used to derive dark matter scaling relations for Coma early-type galaxies. From faint to bright galaxies halo core-radii and asymptotic circular velocities increase. Compared to spirals of the same brightness, the majority of Coma early-types – those with old stellar populations – have similar halo core-radii but more than 2 times larger asymptotic halo velocities. The average dark matter density inside decreases with increasing luminosity and is times larger than in disk galaxies of the same -band luminosity. Compared at the same stellar mass, dark matter densities in ellipticals are times higher than in spirals. Different baryon concentrations in ellipticals and spirals cannot explain the higher dark matter density in ellipticals. Instead, the assembly redshift (1+z) of Coma early-type halos is likely about two times larger than of comparably bright spirals. Assuming that local spirals typically assemble at a redshift of one, the majority of bright Coma early-type galaxy halos must have formed around . For about half of our Coma galaxies the assembly redshifts match with constraints derived from stellar populations. We find dark matter densities and estimated assembly redshifts of our observed Coma galaxies in reasonable agreement with recent semi-analytic galaxy formation models.
Subject headings:
galaxies: elliptical and lenticular, cD — galaxies: formation — galaxies: halos — galaxies: kinematics and dynamics — (cosmology:) dark matter1. Introduction
Present-day elliptical galaxies are known to host mostly old stellar populations (Trager et al. 2000, Terlevich & Forbes 2002, Thomas et al. 2005a). Whether their stars have formed in situ or whether ellipticals assembled their present-day morphology only over time (for example by mergers) is less clear. An important clue on the assembly redshift of a galaxy is provided by its dark matter density. For example, in the simple spherical collapse model (Gunn & Gott, 1972) the average density of virialized halos is proportional to the mean density of the universe at the formation epoch: halos which form earlier become denser. Similarly, in cosmological -body simulations, the concentration (and, thus, the inner density) is found to be higher in halos that have assembled earlier (e.g. Navarro, Frenk & White 1996, Wechsler et al. 2002). In addition to this connection between formation epoch and halo density, the final halo mass distribution also depends on the interplay between dark matter and baryons during the actual galaxy formation process (e.g. Blumenthal et al. 1986, Binney, Gerhard & Silk 2001). Then, the properties of galaxy halos provide valuable information about when and how a galaxy has assembled its baryons.
Despite its cosmological relevance, the radial distribution of dark (and luminous) mass in early-type galaxies is not well known: because of the lack of cold gas as a dynamical tracer, masses are difficult to determine. Stellar dynamical models require the exploration of a galaxy’s orbital structure and have only recently become available for axisymmetric or more general systems (Cretton et al. 1999, Gebhardt et al. 2000, Thomas et al. 2004, Valluri et al. 2004, Cappellari et al. 2006, De Lorenzi et al. 2007, Chanamé et al. 2008, van den Bosch et al. 2008). Scaling relations for the inner dark matter distribution in early-types have by now only been reported for round and non-rotating galaxies (Kronawitter et al. 2000, Gerhard et al. 2001) and spirals (Persic, Salucci & Stel 1996a, b and Kormendy & Freeman 2004). The aim of the present paper is to provide empirical scaling relations for generic cluster early-types (flattened, with different degrees of rotation). In particular, this paper is focussed on the inner dark matter density and its implications on the assembly redshift of elliptical galaxy halos.
The paper is organized as follows. In Sec. 2, we review the galaxy sample and its modelling. Dark matter scaling relations are presented in Sec. 3. Sec. 4 is dedicated to the dark matter density. The effect of baryons on the dark matter density is discussed in Sec. 5, while Sec. 6 deals with the halo assembly redshift. In Sec. 7 our results are compared to semi-analytic galaxy formation models. A summary is given in Sec. 8. In the following, we assume that the Coma cluster is at a distance of .
2. Galaxy sample, models and basic definitions
The dark halo parameters discussed in this paper are derived from the axisymmetric, orbit-based dynamical models of bright Coma galaxies presented in Thomas et al. (2007a). The original sample comprises two cD galaxies, nine ordinary giant ellipticals and six lenticular/intermediate type galaxies with luminosities between and . The spectroscopic and photometric observations are discussed in Jørgensen, Franx & Kjærgard (1996), Mehlert et al. (2000), Wegner et al. (2002) and Corsini et al. (2008). Our implementation of Schwarzschild’s (1979) orbit superposition technique for axisymmetric potentials is described in Thomas et al. (2004, 2005b). For a detailed discussion of all the galaxy models the reader is referred to Thomas et al. (2007a).
Three of the 17 galaxies from Thomas et al. (2007a) are excluded from the analysis below. Firstly, we do not consider the two central cD galaxies (GMP2921 and GMP3329; GMP numbers from Godwin, Metcalfe & Peach 1983), because their dark matter profiles may be affected by the cluster halo. Secondly, we omit the E/S0 galaxy GMP1990, whose mass-to-light ratio is constant out to . The galaxy either has no dark matter within this radius, or its dark matter density follows closer the stellar light profile than in any other Coma galaxy. In either case, the mass structure of this object is distinct from the rest of the sample galaxies. In addition to the remaining 14 galaxies we consider two further Coma galaxies for which we collected data recently (GMP3414, GMP4822). The models of these galaxies are summarized in App. A.
Similar dynamical models as used here have been applied to the inner regions of ellipticals, where it has been assumed that mass follows light (e.g. Gebhardt et al. 2003, Cappellari et al. 2006). In contrast, our models explicitly include a dark matter component (cf. Thomas et al. 2007a). We probed for two parametric profiles. Firstly, logarithmic halos
| (1) |
which posses a constant-density core of size and have an asymptotically constant circular velocity . The central density of these halos reads
| (2) |
Secondly, NFW-profiles
| (3) |
which are found in cosmological -body simulations (Navarro, Frenk & White, 1996). The majority of Coma galaxies are better fit with logarithmic halos, but the significance over NFW halo profiles is marginal. Even if the best fit is obtained with an NFW-halo, then the inner regions are still dominated by stellar mass (cf. Thomas et al. 2007a). In this sense, our models maximize the (inner) stellar mass.
In Sec. 3 we will only discuss results based on logarithmic halo fits (i.e. we use the halo parameters from columns 5 and 6 in Tab. 2 of Thomas et al. 2007a and columns 3 and 4 in Tab. 4 of App. A, respectively). While these are not necessarily the more realistic profiles, they minimize systematics in the comparison with published scaling relations for spirals that were performed using cored profiles similar to our logarithmic halos. The NFW fits are used in Sec. 5.
The -band luminosities of Coma galaxies used in this paper are taken from Hyperleda. We adopt a standard uncertainty of to account for zero-point uncertainties, systematic errors in the sky subtraction, seeing convolution, profile extrapolation and others. Effective radii are taken from Jørgensen, Franx & Kjærgard (1995) and Mehlert et al. (2000). Here we estimate the errors to be . This is slightly higher than the uncertainties given in Jørgensen, Franx & Kjærgard (1995), but accounts for possible systematic errors (Saglia et al., 1997). Stellar masses were computed from our best-fit stellar mass-to-light ratios and -band luminosities of Mehlert et al. (2000). In case the best fit is obtained with a logarithmic halo, is taken from column 4 of Tab. 2 in Thomas et al. (2007a). In case of an NFW fit, comes from column 8 of the same table. The best-fit stellar mass-to-light ratios of GMP3414 and GMP4822 are given in column 1 of Tab. 4 (cf. App. A).
| galaxy | ||||
|---|---|---|---|---|
| (1) | (2) | (3) | (4) | (5) |
| 0144 | ||||
| 0282 | ||||
| 0756 | ||||
| 1176 | ||||
| 1750 | ||||
| 2417 | ||||
| 2440 | ||||
| 3414 | ||||
| 3510 | ||||
| 3792 | ||||
| 3958 | ||||
| 4822 | ||||
| 4928 | ||||
| 5279 | ||||
| 5568 | ||||
| 5975 |
Note. — (1) Galaxy id from Godwin, Metcalfe & Peach (1983); (2) galaxy -band luminosity ; (3) stellar mass in solar units; (4,5) logarithmic-halo core-radius and circular velocity .
3. Dark matter scaling relations
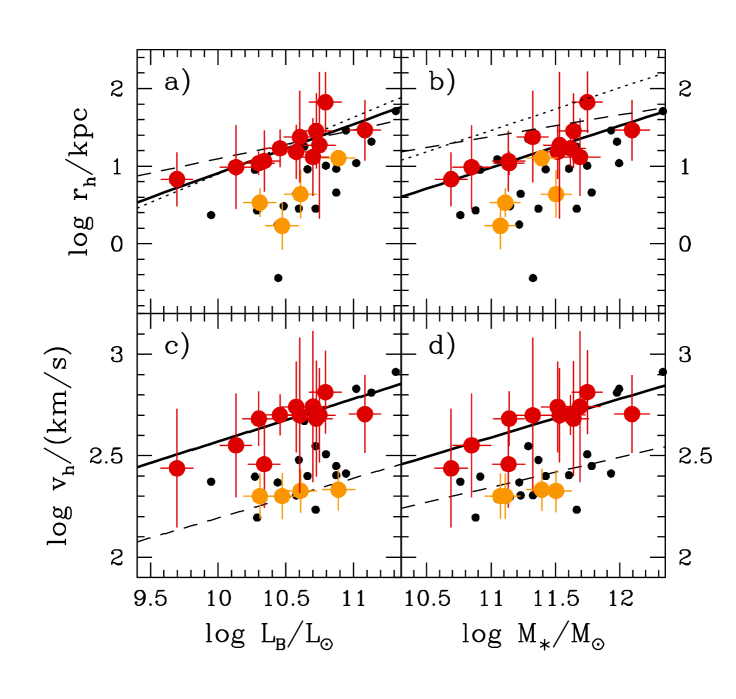
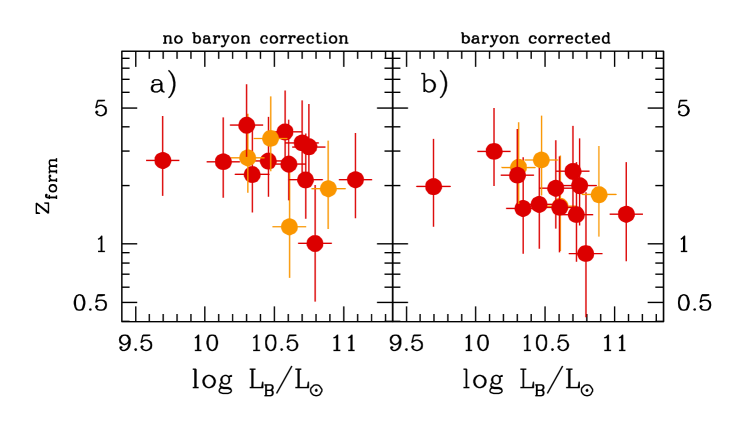
Fig. 1 shows the scalings of dark halo core-radii and halo asymptotic circular velocities with -band luminosity and stellar mass (the corresponding galaxy parameters with errors are listed in Tab. 1). Both, halo core-sizes and halo circular velocities tend to increase with luminosity and mass. The case for a correlation between and is weak, if the sample as a whole is considered (cf. column 8 of Tab. 2). However, four galaxies (GMP0144, GMP0756, GMP1176 and GMP5975) separate from the rest of the sample galaxies in having both noticeably smaller and . These galaxies are shown in light color in Fig. 1. As a general trend, halo parameters tend to scale more tightly with luminosity and mass when these galaxies are omitted. The solid lines in Fig. 1 show corresponding log-linear fits111Fits for this paper are performed with the routine fitexy of Press et al. (1992).. For comparison, in Tab. 2 we give both, fits to all Coma galaxies as well as fits to the subsample without the four galaxies offset in Fig. 1. The difference between these four galaxies and the rest of the sample is further discussed below.
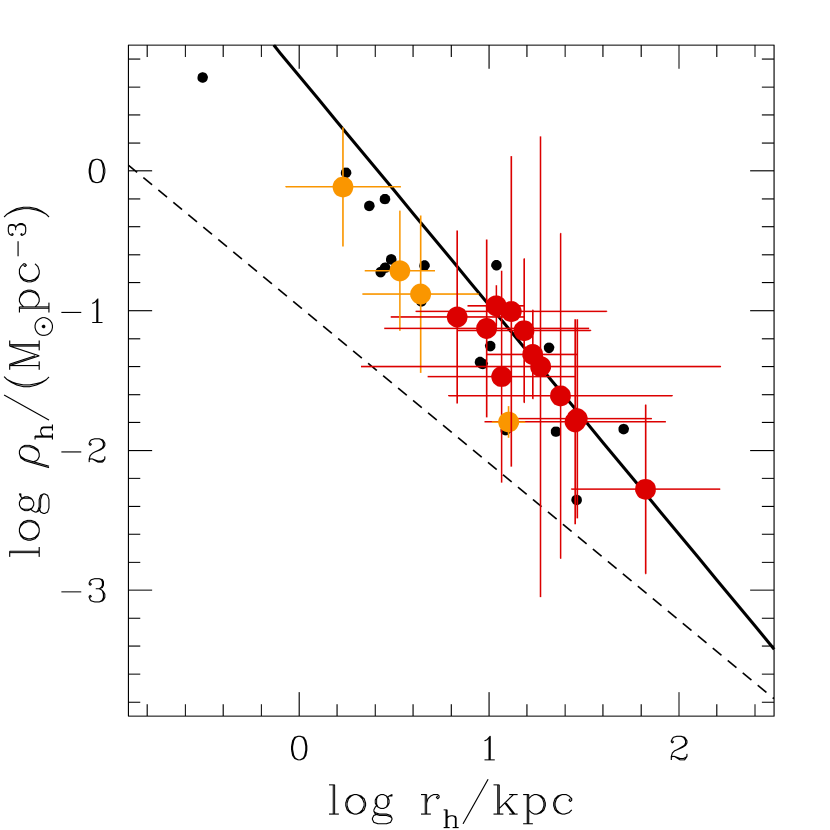
The logarithmic halos of equation (1) have two free parameters. Any and pair of , or characterizes a specific halo. Fig. 2 shows a plot of versus . Both halo parameters are clearly correlated. A linear relation fits the points with a minimum (per degree of freedom; cf. Tab. 2). This rather low value partly derives from a degeneracy between the halo parameters in the dynamical modeling (e.g. Gerhard et al. 1998, Thomas et al. 2004) which correlates the errors in both quantities. In Tab. 2, such a correlation between the errors is not taken into account and the might be thus underestimated. A much larger than unity would indicate some intrinsic scatter in Fig. 2, whereas the low quoted in Tab. 2 formally rules out any intrinsic scatter. Note that dark matter halos in cosmological -body simulations can be approximated by a two-parameter family of halo models, where the parameters are correlated qualitatively in a similar way as revealed by Fig. 2 (e.g. Navarro, Frenk & White 1996, Wechsler et al. 2002), but with some intrinsic scatter.
The four galaxies offset in Fig. 1 are also slightly offset in Fig. 2. However, given the large uncertainties, this is not significant and Fig. 2 is consistent with the halos of the four galaxies belonging to the same one-parameter family as established by the remaining Coma galaxies. This implies that the four galaxies primarily differ in the amount of stellar light (and stellar mass, respectively) that is associated to a given halo. Noteworthy, the four galaxies have stellar ages (Mehlert et al., 2003), while all other Coma galaxies are significantly older (mostly ). A mere stellar population effect, however, is unlikely to explain the offset of the four galaxies. In this case differences to other Coma galaxies should vanish when galaxies are compared at the same stellar mass, which is not consistent with Fig. 1b/d. It should be noted, though, that the stellar masses used here are taken from the dynamical models. A detailed comparison with mass-to-light ratios from stellar population synthesis models is planed for a future publication (Thomas et al., in preparation).
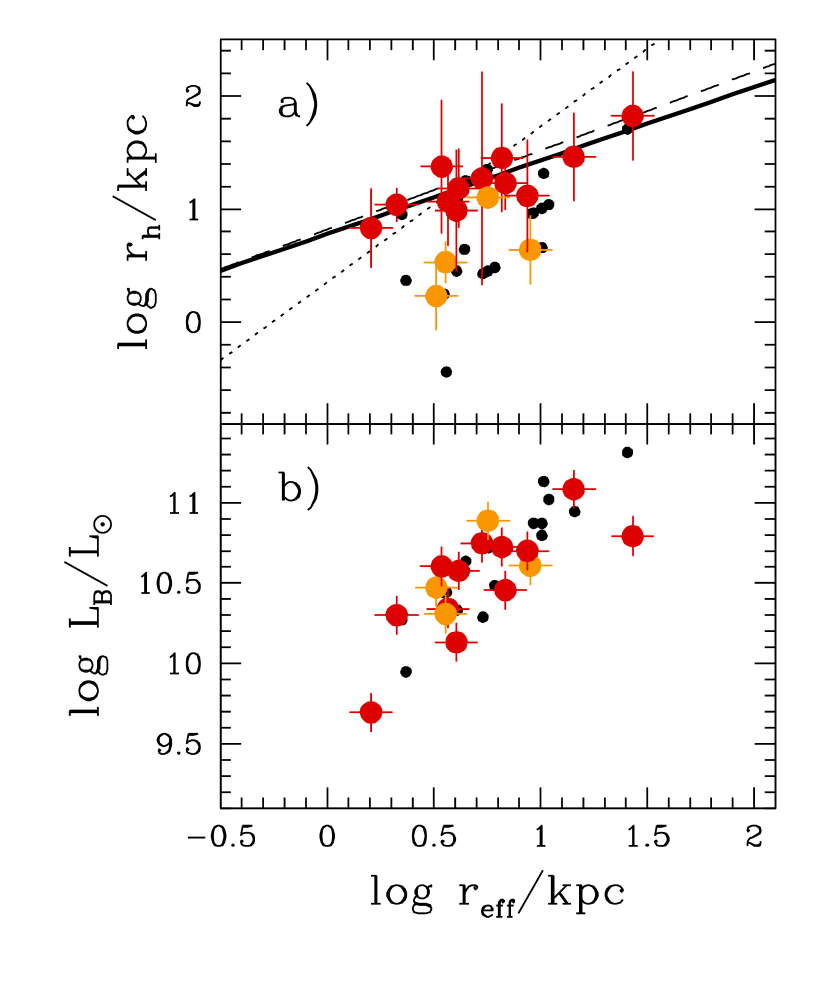
In Fig. 3a we plot against . Larger core-radii are found in more extended galaxies. Three of the four galaxies with young cores are again offset. These three galaxies have similar than other Coma galaxies of the same luminosity (cf. Fig. 3b). This makes a higher baryon concentration unlikely to be the cause of their small halo core-radii. An exceptional case is GMP0756: it has a small core-radius, a ratio which is typical for Coma galaxies with old stellar populations and a relatively small . The scalings of and with luminosity in Coma galaxies with old stellar populations imply a roughly constant ratio . Moreover, disk galaxies of the same luminosity show a similar ratio.
The fact that all four galaxies offset in Figs. 1 and 3 appear at projected cluster-centric distances and have young stellar populations suggests that they may have entered the Coma cluster only recently. We will come back to this point in the next Sec. 3.1.
3.1. Comparison with round and non-rotating early-types
Kronawitter et al. (2000) and Gerhard et al. (2001) studied dark matter halos of 21 nearly round (E0-E2) and non-rotating galaxies (K2000 in the following). K2000 galaxies have similar luminosities and half-light radii as ours, but the K2000 sample contains a mixture of field ellipticals and galaxies in the Virgo and Fornax clusters. The dynamical models of Kronawitter et al. (2000) differ in some respects from the ones described in Sec. 2 and this will be further discussed below. However, in their mass decomposition Kronawitter et al. (2000) assumed the same halo profile as in equation (1), such that we can directly compare their halo parameters to ours (cf. small black dots in Figs. 1 - 3).
We find halo parameters of both samples in the same range, but Coma galaxies of the same have on average larger halo core-radii than K2000 galaxies. However, the halos of the K2000 galaxies themselves are not different from the ones around Coma early-types, as both belong to the same one-parameter family (cf. Fig. 2). The main difference is that K2000 galaxies are brighter (and have higher stellar mass) than Coma early-types with a similar halo. Can this be an artifact related to differences in the dynamical models?
Many of the K2000 models are based on -band photometry, while we used -band images for the Coma galaxies. Elliptical galaxies become bluer towards the outer parts and -band light profiles are slightly shallower than -band profiles. Likewise, mass profiles of galaxies are generally shallower than their light profiles, such that there might be less need for dark matter in -band models than in -band models. Kronawitter et al. (2000) checked for this by modelling one galaxy (NGC3379) in both bands and found comparable results. The photometric data is therefore unlikely to cause the differences between the two samples.
K2000 galaxies were modelled assuming spherical symmetry. Not all apparently round galaxies need to be intrinsically spherical. Neglecting the flattening along the line-of-sight can result in an underestimation of a galaxy’s mass (e.g. Thomas et al. 2007b). Based on the average intrinsic flattening of ellipticals in the luminosity interval of interest here, Kronawitter et al. (2000) estimated that the assumption of spherical symmetry should affect mass-to-light ratios only at the 10 percent level. We expect the effect on to be correspondingly small. In addition, it is not obvious why spherical symmetry should enforce systematically small , such that the different symmetry assumptions are also unlikely to explain the more extended cores and higher circular velocities in Coma galaxy halos.
Since the shape of a galaxy is related to its evolutionary history, the round and non-rotating K2000 galaxies could be intrinsically different from the mostly flattened and rotating Coma galaxies. Structural differences could also be related to the fact that K2000 galaxies are located in a variety of environments, with less galaxies in high density regions like Coma. For example, stellar population models indicate that field ellipticals are on average younger and have more extended star formation histories than cluster galaxies (Thomas et al., 2005a). But a mere difference in the stellar populations can not explain the difference between K2000 and Coma galaxies, as in this case the scalings with should be similar in both samples. This is ruled out by Fig. 1b/d.
Noteworthy, most of the K2000 galaxies in Figs. 1 - 3 appear similar to the four Coma galaxies with distinctly small and . As it has been discussed above, these galaxies may have entered the Coma cluster only recently and – in this respect – are more representative for a field galaxy population rather than being genuine old cluster galaxies. A consistent explanation for both, the offset between young and old Coma galaxies on the one side and the difference between old Coma galaxies and K2000 galaxies on the other would then be that field galaxies have lower and lower than cluster galaxies of the same stellar mass. Because there are more field galaxies in the K2000 sample than in Coma, Coma galaxy halos would be expected to have on average larger cores and to be more massive (consistent with Fig. 1). A larger comparison sample of field elliptical halos is required to conclude finally upon this point.
3.2. Comparison with spiral galaxies
Two independent derivations of dark matter scaling relations for spiral galaxies are included in Figs. 1 - 3 through the dotted and dashed lines. Dotted lines show scaling relations from Persic, Salucci & Stel (1996a, b). They are based on maximum-disk rotation-curve decompositions with the halo density from equation (1). Persic, Salucci & Stel (1996a, b) give halo core-radii scaled by the optical disk radius. To reconstruct the underlying relationship between and , we follow Gerhard et al. (2001) and assume exponential disks with
| (4) |
(the empirical fit in Gerhard et al. 2001 has been transformed to our distance scale).
Dashed lines in Figs. 1 - 3 fit the combined sample of 55 rotation curve decompositions of Kormendy & Freeman (2004). These authors discuss various halo profiles, but we here only consider non-singular isothermal dark matter halos. Though these are most similar to equation (1), isothermal cores and circular velocities are not exactly identical as in logarithmic halos. To account for the difference, we fitted a logarithmic halo to a non-singular isothermal density profile (cf. Tab. 4.1 of Binney & Tremaine 1987). The fit was restricted to the region with kinematic data (typically inside two core-radii). We found that the logarithmic halo fit yields a 3 percent larger core-radius and a 10 percent smaller circular velocity . The central halo density is reproduced to 0.001 dex (not surprising given that the cores of the two profiles were matched). Thus, under the assumption that fits performed with the two profiles indeed match inside two core-radii, a correction of the derived halo parameters is not needed. Scaling relations from Kormendy & Freeman (2004) are shown in Figs. 1 - 2 without any correction.
Persic, Salucci & Stel (1996a, b) and Kormendy & Freeman (2004) discuss the scaling of disk galaxy halos with -band luminosity. In order to compare early-types and spirals also at the same stellar masses, we used
| (5) |
for the stellar mass-to-light ratios of disks. Equation (5) is derived from the Tully-Fisher and stellar-mass Tully-Fisher relations of Bell & De Jong (2001).
Both in luminosity and in stellar mass, spirals and ellipticals follow similar global trends. However, while old Coma early-types have halo core-radii of similar size as spirals with the same -band luminosity, the asymptotic halo circular velocities are times higher than in corresponding spirals. In contrast, early-types with young central stellar populations have about 4 times smaller core-radii than spirals, but similar asymptotic halo velocities. When galaxies are compared at the same stellar mass, then differences between ellipticals and spirals become larger (60 percent smaller and times higher in old Coma early-types compared to spirals; 90 percent smaller and 20 percent smaller in Coma galaxies with young central stellar populations). In addition, the halos of early-types and spirals do not belong to the same one-parameter family (cf. Fig. 2). At a given dark matter densities in ellipticals are about dex higher than in spirals.
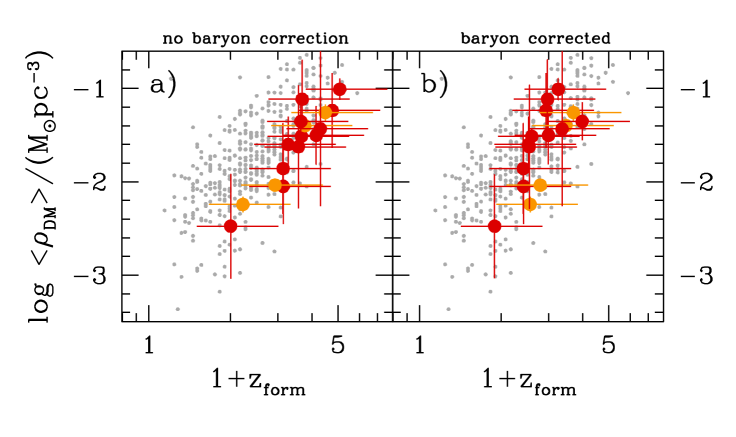
4. The dark matter density
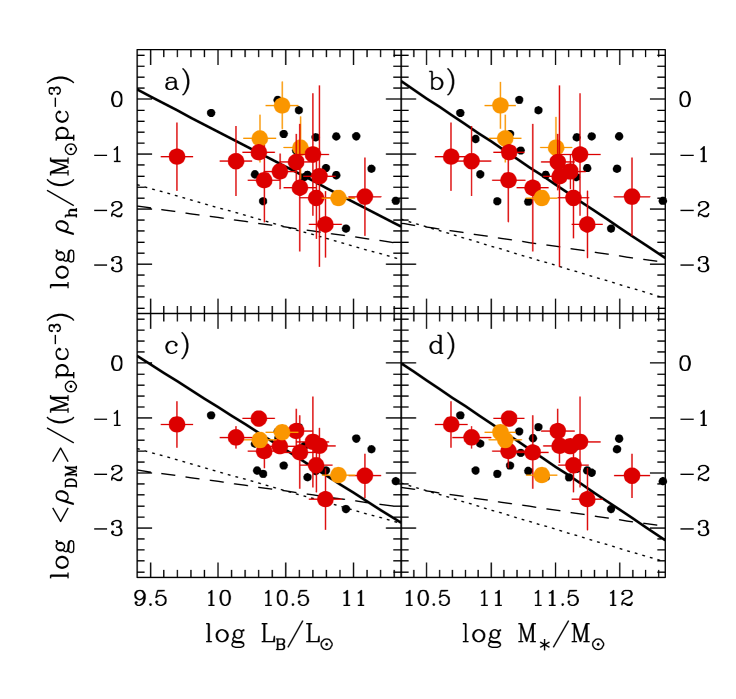
Fig. 4 shows scaling laws for dark matter densities. The central dark matter density (cf. equation 2) of the logarithmic halo fits is plotted in panels (a) and (b) versus luminosity and stellar mass. For panels (c) and (d), the best-fit dark matter halo of each galaxy (being either logarithmic or NFW) is averaged within :
| (6) |
Here, equals the cumulative dark mass inside a sphere with radius . Average dark matter densities are quoted in column (2) of Tab. 3.
The general trend for both densities is to decrease with increasing galaxy luminosity. Thereby the central densities scatter more than the averaged . For two reasons, quantifies the actual dark matter density more robustly than . Firstly, our estimate of the very central dark matter density depends strongly on the assumed halo profile. Instead, averaged over differences between logarithmic halo fits and fits with NFW-profiles are small compared to the statistical errors (averaged over the Coma sample NFW-fits yield dex higher than fits with logarithmic halos).
Secondly, the most significant differences between and occur in the four Coma galaxies with distinct halos discussed in Sec. 3. These galaxies have young central stellar populations. If the bulk of stars in these galaxies is old, however, then the related radial increase of the stellar mass-to-light ratio could contribute to their small and large . This, because in our models it is assumed that the stellar mass-to-light ratio is radially constant. By construction then, any increase in the mass-to-light ratio with radius (being either due to a stellar population gradient or due to dark matter) is attributed to the halo component. In galaxies with a significant increase of the stellar with radius, the ’halo’ component of the model thereby has to account for both, additional stellar and possible dark mass (Thomas, 2006). Any contamination with stellar mass will be largest at small radii, where the increase in the stellar dominates the shape of the mass profile. The averaging radius in equation (6) is therefore chosen as large as possible. The value of is a compromise for the whole sample, because the kinematic data extend to and the averaging should not go much beyond the last data point.
Compared to the Coma galaxies, the majority of K2000 galaxies have larger . After averaging inside , the halo densities in both samples become comparable, however. In this respect, the K2000 galaxies again resemble the four Coma galaxies with young stellar cores.
Dotted and dashed lines in Fig. 4 show spiral galaxies. Their halo densities need not to be averaged before comparison, because core sizes of spirals (in the considered luminosity interval) are larger than . Averaged over the whole sample, we find dark matter densities in Coma early-types a factor of higher than in spirals of the same luminosity. If early-types are compared to spirals of the same stellar mass, then the overdensity amounts to a factor of . Does this imply that spirals and ellipticals of the same luminosity have formed in different dark matter halos?
5. Baryonic contraction
Even if ellipticals and spirals would have formed in similar halos, then the final dark matter densities after the actual galaxy formation process could be different, since the baryons in ellipticals and spirals are not distributed in the same way. This effect can be approximated as follows: assume that (a spherical) baryonic mass distribution condenses slowly out of an original halo+baryon distribution . The halo responds adiabatically and contracts into the mass distribution . If the original particles move on circular orbits then
| (7) |
turns out to be an adiabatic invariant (Blumenthal et al., 1986).
In case of the Coma galaxies, and are known from the dynamical modeling and equation (7) can be solved for 222Because of the large core-radii in some galaxies (cf. Fig. 1c,d) it is not always possible to find for logarithmic halos. Therefore, here we only consider the best-fit NFW-halo of each galaxy.. It characterizes the original halo mass distribution before the actual galaxy formation. Had a disk with baryonic mass grown in this original halo – instead of an early-type – then the halo contraction would have been different such that in general . The difference between and actually determines how much dark matter densities of ellipticals and spirals would differ, if both had formed in the same original halos. To quantify this further, let’s consider the spherically averaged mass distribution of a thin exponential disk for (e.g. Blumenthal et al., 1986). It is fully determined by a scale-radius and a mass. For a given Coma elliptical with luminosity , the scale-radius and the mass of a realistic disk with the same luminosity can be taken from equations (4) and (5). Then, given and (the recontracted Coma galaxy halo), equation (7) can be solved for the baryon-contracted halo around the comparison disk (cf. Blumenthal et al. 1986). Once is known, the average follows directly.
If ellipticals and spirals (of the same ) would have formed in the same halos, then
| (8) |
should fully account for the observed ratio of elliptical to spiral dark matter densities. However, averaged over the Coma sample we find and, thus, that the higher baryon concentration in early-types is not sufficient to explain the factor of between the dark matter densities of ellipticals and spirals at constant luminosity.
In general, the observed dark matter density ratio between ellipticals and spirals will be a combination of a difference in the halo densities before baryon infall and a factor that comes from the baryons. Let denote the baryon-corrected dark matter density ratio, then the simplest assumption is
| (9) |
with from equation (8). After applying this approximate baryon correction, dark matter densities in Coma ellipticals are still a factor of higher than in spirals of the same luminosity. If the comparison is made at the same stellar mass, then . Note that our baryonic contraction corrections are likely upper limits, because in equation (5) we only account for the stellar mass in the disk. In the presence of gas, the baryonic disk mass will be larger and so will be the halo contraction. The dark matter density contrast relative to the original elliptical will be therefore smaller.
Concluding, the differences between the baryon distributions of ellipticals and spirals are not sufficient to explain the overdensity of dark matter in ellipticals relative to spirals of the same luminosity or stellar mass. Ellipticals and spirals have not formed in the same halos. Instead, the higher dark matter density in ellipticals points to an earlier assembly redshift.
6. The dark-halo assembly epoch of Coma early-types
In order to evaluate the difference between elliptical and spiral galaxy assembly redshifts quantitatively, let’s assume that dark matter densities scale with the mean density of the universe at the assembly epoch, i.e. (we will discuss this assumption in Sec. 7.2). Let and denote the formation redshifts of ellipticals and spirals, respectively, then
| (10) |
(Gerhard et al., 2001), with some measure of the dark matter density, e.g. . Equation (10) can be solved for
| (11) |
where we have omitted the dependency of dark matter densities and formation redshifts on and defined . Equation (11) allows to calculate formation redshifts of Coma ellipticals from and the observed . Two estimates based on different assumptions about and are shown in Fig. 5 and are further discussed below. For each case, formation redshifts were calculated with both disk halo scaling laws shown in Fig. 4 and the two results were averaged.
Raw formation redshifts without any baryon correction () are shown in Fig. 5a (and listed in column 3 of Tab. 3). We considered a wide range of spiral galaxy formation redshifts and the related uncertainty in is indicated by vertical bars. Our fiducial value is , because regular disks become rare beyond (Conselice et al., 2005). We did not allow for a luminosity dependence of spiral galaxy formation times. For the Coma ellipticals we then find ranging from to , with the majority of galaxies having formed around . Brighter galaxies have assembled later than fainter galaxies.
Coma galaxy assembly redshifts shown in Fig. 5b (see also column 5 of Tab. 3) include the baryon correction of Sec. 5, because we used in equation (11). Moreover, because fainter spirals have denser halos than brighter ones, we allowed for a luminosity dependent . In analogy to equation (10) assume
| (12) |
and for a reference luminosity (the dashed line in Fig. 8c illustrates the resulting as a function of ). Because , the baryon corrected in Fig. 5b are lower than the uncorrected ones in Fig. 5a. The typical assembly redshift reduces to , as compared to without the correction. The baryon correction is mostly smaller than the uncertainty related to our ignorance about (vertical bars in Fig. 5b correspond to ). The trend for lower in brighter galaxies is slightly diminished by the baryon correction such that the dependency of on in Fig. 5b mainly reflects the luminosity dependence of spiral galaxy assembly redshifts.
Fig. 6 compares halo assembly redshifts with central stellar population ages from Mehlert et al. (2003). (We use , and to transform ages into redshifts.) Largely independent from applying the baryon correction or not, the agreement between the two redshifts is fairly good for about half of our sample. Among the remaining galaxies, some have halos which appear younger than their central stellar populations. This could indicate that the stellar ages are overestimated (they are sometimes larger than the age of the universe in the adopted cosmology; cf. Tab. 3). It could also point at these galaxies having grown by dry merging. In a dry merger, the dark matter density can drop, but the stellar ages stay constant. In Coma galaxies with young stellar cores, the halo assembly redshifts are instead larger than the central stellar ages. This indicates some secondary star-formation after the main epoch of halo assembly.
7. Comparison with semi-analytic galaxy formation models
In the following we will compare our results to semi-analytic galaxy formation models. To this end we have constructed a comparison sample of synthetic ellipticals and spirals using the models of De Lucia & Blaizot (2007), which are based on the Millennium simulation (Springel et al., 2005). Comparison ellipticals are selected to rest in dark matter cluster structures with virial masses larger than and to obey (Simien & De Vaucouleurs, 1986). We ignore galaxies at the centers of simulated clusters since we have omitted the two central Coma galaxies from the analysis in this paper. Likewise, we exclude from the comparison galaxies that have been stripped-off their entire halo, because the only Coma galaxy that possibly lacks dark matter inside has been excluded from the analysis in this paper as well (cf. Sec. 2). Isolated field spirals are drawn from objects with in the semi-analytic models (Simien & De Vaucouleurs, 1986).
Simulated galaxies were chosen randomly from the catalogue of De Lucia & Blaizot (2007) in a way such that each of six luminosity intervals (between and ; width ) contains roughly 50 galaxies. We use dust-corrected luminosities of the semi-analytic models.
7.1. Dark matter density
Dark matter halos of simulated galaxies are reconstructed from tabulated virial velocities , virial radii , and maximum circular velocities as follows. It is assumed that the halos can be approximated by an NFW-profile (cf. equation 3), in which case the circular velocity profile reads
| (13) |
Here and the halo concentration is defined by . The maximum circular velocity of an NFW halo occurs at (Navarro, Frenk & White, 1996), such that (with equation 13)
| (14) |
Using the tabulated and this equation can be numerically solved for the halo concentration , which in turn determines and, thus, the entire NFW profile of the halo.
Before compared to the Coma galaxy models, halo densities are averaged within (cf. equation 6). In case of simulated spirals we use effective radii from the empirical relation (4). For ellipticals, we assume
| (15) |
which is a fit to the Coma data.
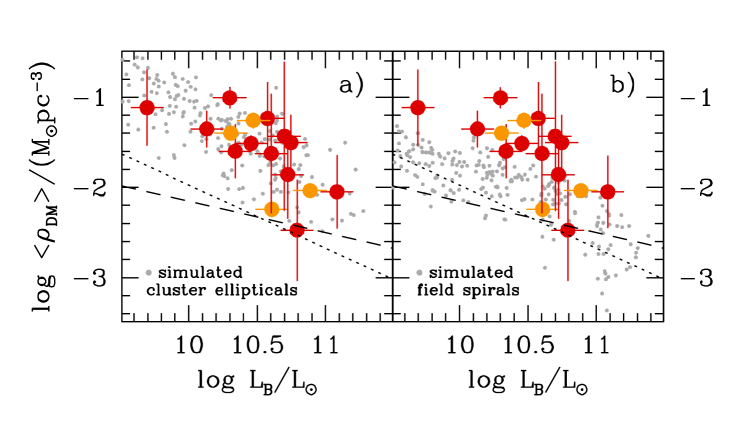
Fig. 7 shows that the average dark matter densities of the Coma early-types match fairly well with semi-analytical models. This is remarkable, because the simulations do not take into account the halo response during baryon infall. Therefore, either the net effect of the baryons on the dark matter distribution is small in the analyzed population of galaxies or there is actually a mismatch between the halos of observed galaxies and the -body models. It may also be that real galaxies do not have maximum stellar masses. This can be checked by the comparison of dynamically derived stellar mass-to-light ratios with independent stellar population synthesis models (Thomas et al., in preparation).
Similarly to what is found in real galaxies, the dark matter densities of spirals are lower than in ellipticals in semi-analytic models (cf. Fig. 7), but the density contrast in observed galaxies is larger. Again, a major uncertainty here is that the simulations do not take into account the gravitational effect of the baryons.
7.2. Assembly redshift
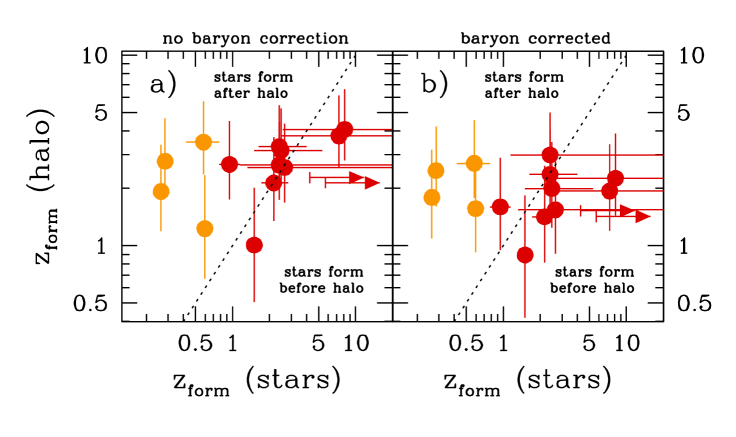
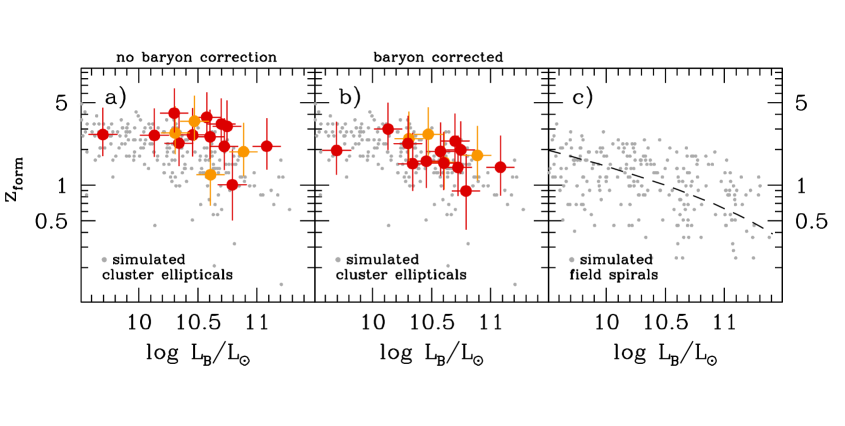
Formation redshifts of simulated and observed galaxies are compared in Fig. 8. Coma galaxy are from Sec. 6 and both cases discussed there – with and without baryon correction – are shown separately in panels (a) and (b), respectively. Formation redshifts of simulated galaxies are defined as the earliest redshift, when a halo has assembled 50 percent of its mass. Since we are mainly interested in cluster ellipticals, we need to take into account that interactions between the cluster halo and a galaxy’s subhalo cause a mass-loss in the latter. Although cluster-galaxy interactions happen in both simulated and observed galaxies, the mass-loss in the simulations may be overestimated because of the finite numerical resolution and the neglect of the baryon potential. In particular, for simulated subhalos with very low masses at the derived formation redshifts may be artificially high, when defined according to the assembly of half of the final mass. To avoid such artificially large assembly redshifts, we define of simulated galaxies as the earliest time when half of the maximum mass was assembled, that a single progenitor in the merger tree of given galaxy had at some redshift. Our assumption is that even if dynamical interactions between cluster and galaxy halos take place, they do not significantly affect the very inner regions of interest here. In case of field spirals, formation redshifts defined either from the final or from the maximum mass are very similar.
Without a baryon correction, our estimates of Coma galaxy formation redshifts are on average higher than in the semi-analytic models (Fig. 8a). This, although (1) the dark matter densities of ellipticals match with the simulations and (2) our assumption about the formation redshifts of spirals () is consistent with the simulations. The origin for the offset between Coma galaxies and semi-analytic models in Fig. 8a is that the density contrast between halos of ellipticals and spirals is larger in observed galaxies than in the simulations. After applying the baryon correction, the Coma galaxy formation redshifts become consistent with the simulations (Fig. 8b). This result indicates that the discrepancy between the measured and the simulated density ratio is due to baryon effects.
Our Coma galaxy formation redshifts are based on the assumption that . Fig. 9 shows versus explicitly. Independent of including a baryon correction or not, the slope of the relationship between and in the Coma galaxies is roughly parallel to simulated -body halos. This confirms that our assumption for the scaling between and is approximately consistent with the cosmological simulations.
Concerning the absolute values of the dark matter densities it has been already stated above that they are only consistent with the simulations if either the net effect of the baryons is zero in the case of ellipticals or if galaxies do not have maximum stellar masses. The former case would imply that halos of spiral galaxies experience a net expansion during the baryon infall (several processes have been proposed for this, e.g. Binney, Gerhard & Silk 2001).
De Lucia et al. (2006) quote a stellar assembly redshift below for simulated ellipticals more massive than . The halo assembly redshifts in Fig. 8 are mostly above . In part, this is due to the fact that we only consider semi-analytic galaxies in high-density environments similar to Coma. In addition, formation redshifts defined according to the stellar mass assembly and the halo assembly, respectively, are not always equal. For example, in our comparison sample of simulated cluster ellipticals we find an average dark halo assembly redshift for galaxies more massive than . Evaluating for the same galaxies the redshift (when half the stellar mass is assembled) yields . That is plausible if some star formation is going on between in the progenitor and/or in the subunits that are to be accreted after . It should also be noted that the simulations do not take into account stellar mass-loss due to tidal interactions.
8. Summary
We have presented dark matter scaling relations derived from axisymmetric, orbit-based dynamical models of flattened and rotating as well as non-rotating Coma early-type galaxies. Dark matter halos in these galaxies follow similar trends with luminosity as in spirals. Thereby, the majority of Coma early-types – those with old stellar populations – have halo core-radii similar as in spirals with the same -band luminosity, but their asymptotic halo velocities are about times higher. In contrast, four Coma early-types – with young central stellar populations – have halo velocities of the same order as in comparably bright spirals, but their core-radii are smaller by a factor of 4. Differences between spirals and ellipticals increase, when the comparison is made at the same stellar mass. The average halo density inside exceeds that of comparably bright spirals by about a factor of . If the higher baryon concentration in ellipticals is taken into account, the excess density reduces to about a factor of 3, but if ellipticals and spirals are compared at the same stellar mass, then it is again of the order of .
Our measured dark matter densities match with a comparison sample of simulated cluster ellipticals constructed from the semi-analytic galaxy formation models of De Lucia & Blaizot (2007). These synthetic ellipticals have and higher dark matter densities than simulated field spirals, which are appear on average around .
Assuming for local spirals as well, and assuming further that the inner dark matter density scales with the formation redshift like , our results imply that ellipticals have formed earlier than spirals. Without baryon correction, we find an average formation redshift around , which is slightly larger than in semi-analytic galaxy formation models. Accounting for the more concentrated baryons in ellipticals, the average formation redshift drops to .
For about half of our sample, dark halo formation redshifts match with constraints derived from stellar populations (Mehlert et al., 2003): the assembly epoch of these (old) early-types coincides with the epoch of formation of their stellar components.
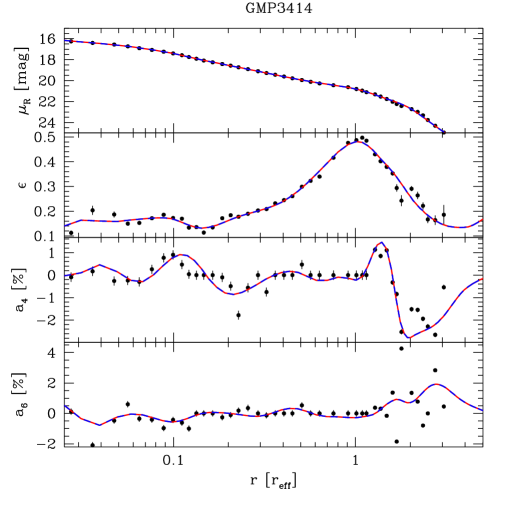
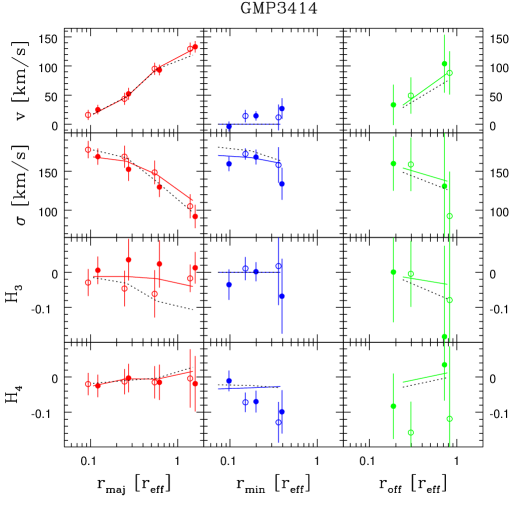
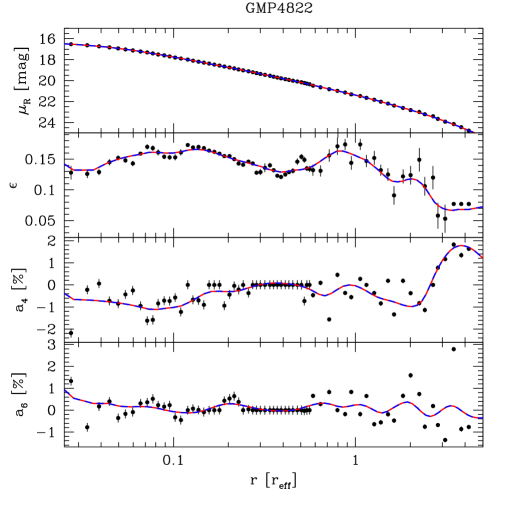
Appendix A GMP3414 and GMP4822
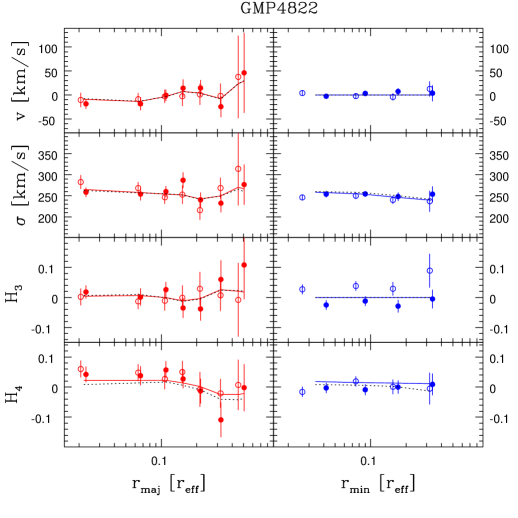
The best-fit model parameters for the galaxies GMP3414 and GMP4822 (which were not included in the original sample of Thomas et al. 2007a) are given in Tab. 4. The table is similar to Tab. 2 of Thomas et al. (2007a) and we refer the reader to this paper, in case more detailed information about the parameter definitions are required. The best-fit models with and without dark matter halo are compared to the observations in Figs. 10 and 11. In both galaxies the best-fit inclination is , but the 68 percent confidence regions include models at (GMP3414) and (GMP4822).
GMP3414 and GMP4822 were observed with the Wide Field Planetary Camera 2 (WFPC2) on board the HST as part of the HST proposal 10844 (PI: G. Wegner). For each galaxy two exposures with 300s each were taken with the filter F622W. Four other objects were previously observed as part of this proposal and a full description of the respective observational parameters and the data analysis is given in Corsini et al. (2008). A table with the final photometric parameters will be published in the journal version of this paper.
References
- Bell & De Jong (2001) Bell, E. F., & De Jong, R. S. 2001, ApJ, 550, 212
- Binney & Tremaine (1987) Binney, J., & Tremaine, S. 1987, Galactic Dynamics (Princeton: Princeton University Press)
- Binney, Gerhard & Silk (2001) Binney, J., Gerhard, O., & Silk, J. 2001, MNRAS, 321, 471
- Blumenthal et al. (1986) Blumenthal, G. R., Faber, S. M., Flores, R., Primack, J. R. 1986, ApJ, 301, 27
- Cappellari et al. (2006) Cappellari, M., et al. 2006, MNRAS, 366, 1126
- Chanamé et al. (2008) Chanamé, J., Kleyna, J., & van der Marel, R. 2008, ApJ, 682, 841
- Conselice et al. (2005) Conselice, C. J., Blackburne, J. A., & Papovich, C. 2005, ApJ, 620, 564
- Corsini et al. (2008) Corsini, E. M., Wegner, G., Saglia, R. P., Thomas, J., Bender, R., Thomas, D. 2008, ApJS, 175, 462
- Cretton et al. (1999) Cretton, N., de Zeeuw, P. T., van der Marel, R. P., & Rix, H.-W. 1999, ApJS, 124, 383
- De Lorenzi et al. (2007) De Lorenzi, F., Debattista, V. P., Gerhard, O., & Sambhus, N. 2007, MNRAS, 376, 71
- De Lucia et al. (2006) De Lucia, G., Springel, V., White, S. D. M., Croton, D., Kauffmann, G. 2006, MNRAS, 366, 499
- De Lucia & Blaizot (2007) De Lucia, G., & Blaizot, J. 2007, MNRAS, 375, 2
- Gebhardt et al. (2000) Gebhardt, K., et al. 2000, AJ, 119, 1157
- Gebhardt et al. (2003) Gebhardt, K., et al. 2003, ApJ, 583, 92
- Gerhard et al. (1998) Gerhard, O., Jeske, G., Saglia, R. P., & Bender, R. 1998, MNRAS, 295, 197
- Gerhard et al. (2001) Gerhard, O. E., Kronawitter, A., Saglia, R. P., Bender, R. 2001, AJ, 121, 1936
- Godwin, Metcalfe & Peach (1983) Godwin, J. G., Metcalfe, N., & Peach, J. V. 1983, MNRAS, 202, 113
- Gunn & Gott (1972) Gunn, J. E., & Gott, J. R. I. 1972, ApJ, 176, 1
- Jørgensen, Franx & Kjærgard (1995) Jørgensen, I., Franx, M., & Kjærgard, P. 1995, MNRAS, 273, 1097
- Jørgensen, Franx & Kjærgard (1996) Jørgensen, I., Franx, M., & Kjærgard, P. 1996, MNRAS, 280, 167
- Kormendy & Freeman (2004) Kormendy, J., & Freeman, K. C. 2004, in IAU Symp. 220, Dark Matter in Galaxies, ed. S. D. Ryder et al. (San Francisco: ASP), 377
- Kronawitter et al. (2000) Kronawitter, A., Saglia, R. P., Gerhard, O. E., Bender, R. 2000, A&AS, 144, 53
- Mehlert et al. (2000) Mehlert, D., Saglia, R. P., Bender, R., Wegner, G. 2000, A&AS, 141, 449
- Mehlert et al. (2003) Mehlert, D., Thomas, D., Saglia, R. P., Bender, R., Wegner, G. 2003, A&A, 407, 423
- Navarro, Frenk & White (1996) Navarro, J. F., Frenk, C. S., & White, S. D. M. 1996, ApJ, 462, 563
- Persic, Salucci & Stel (1996a) Persic, M., Salucci, P., & Stel, F. 1996a, MNRAS, 281, 27
- Persic, Salucci & Stel (1996b) Persic, M., Salucci, P., & Stel, F. 1996b, MNRAS, 283, 1102
- Press et al. (1992) Press, W. H., Teukoslky, S. A., Vetterling, W. T., Flannery, B. P. 1992, Numerical Recipes in FORTRAN 77, 2nd edn. Cambridge Univ. Press, Cambridge
- Saglia et al. (1997) Saglia, R. P., Burstein, D., Baggley, G., Davies, R. L., Bertschinger, E., Colless, M. M., McMahan, R. K., Jr., & Wegner, G. 1997, MNRAS, 292, 499
- Schwarzschild (1979) Schwarzschild, M. 1979, ApJ, 232, 236
- Simien & De Vaucouleurs (1986) Simien, F., & De Vaucouleurs, G. 1986, ApJ, 302, 564
- Springel et al. (2005) Springel, V., et al. 2005, Nature, 435, 629
- Terlevich & Forbes (2002) Terlevich, A. I., & Forbes, D. A. 2002, MNRAS, 330, 547
- Thomas et al. (2005a) Thomas, D., Maraston, C., Bender, R., Mendes de Oliveira, C. 2005a, ApJ, 621, 673
- Thomas et al. (2004) Thomas, J., Saglia, R. P., Bender, R., Thomas, D., Gebhardt, K., Magorrian, J., Richstone, D. 2004, MNRAS, 353, 391
- Thomas et al. (2005b) Thomas, J., Saglia, R. P., Bender, R., Thomas, D., Gebhardt, K., Magorrian, J., Corsini, E. M., Wegner, G. 2005b, MNRAS, 360, 1355
- Thomas (2006) Thomas, J. 2006, Ph.D. thesis (Univ. of Munich)
- Thomas et al. (2007a) Thomas, J., Saglia, R. P., Bender, R., Thomas, D., Gebhardt, K., Magorrian, J., Corsini, E. M., Wegner, G. 2007, MNRAS, 382, 657
- Thomas et al. (2007b) Thomas, J., Jesseit, R., Naab, T., Saglia, R. P., Burkert, A., & Bender, R. 2007, MNRAS, 381, 1672
- Trager et al. (2000) Trager, S. C., Faber, S. M., Worthey, G., & González, J. J. 2000, AJ, 119, 1645
- Wechsler et al. (2002) Wechsler, R. H., Bullock, J. S., Primack, J. R., Kravtsov, A. V., & Dekel, A. 2002, ApJ, 568, 52
- Valluri et al. (2004) Valluri, M., Merritt, D., & Emsellem, E. 2004, ApJ, 602, 66
- Wegner et al. (2002) Wegner, G., Corsini, E. M., Saglia, R. P., Bender, R., Merkl, D., Thomas, D., Thomas, J., Mehlert, D. 2002, A&A, 395, 753
- van den Bosch et al. (2008) van den Bosch, R. C. E., van de Ven, G., Verolme, E. K., Cappellari, M., & de Zeeuw, P. T. 2008, MNRAS, 385, 647
| relation | ||||||||
|---|---|---|---|---|---|---|---|---|
| rms | figure | |||||||
| (1) | (2) | (3) | (4) | (5) | (6) | (7) | (8) | (9) |
| fits to all galaxies | ||||||||
| 1.24 | 0.35 | 0.39 | 0.010 | |||||
| 0.85 | 0.31 | 0.39 | 0.002 | |||||
| 1.62 | 0.19 | 0.21 | 0.109 | |||||
| 1.04 | 0.17 | 0.21 | 0.002 | |||||
| 0.41 | 0.41 | 0.66 | 0.001 | |||||
| 1.15 | 0.31 | 0.39 | 0.026 | |||||
| 0.75 | 0.47 | 0.66 | 0.019 | 4a | ||||
| 0.94 | 0.52 | 0.66 | 0.058 | 4b | ||||
| 1.31 | 0.38 | 0.32 | 0.004 | 4c | ||||
| 1.79 | 0.44 | 0.32 | 0.025 | 4d | ||||
| fits omitting galaxies with young stellar cores | ||||||||
| 0.16 | 0.16 | 0.44 | 0.002 | 1a | ||||
| 0.18 | 0.17 | 0.44 | 0.007 | 1b | ||||
| 0.14 | 0.07 | 0.24 | 0.016 | 1c | ||||
| 0.12 | 0.07 | 0.24 | 0.008 | 1d | ||||
| 0.04 | 0.18 | 0.75 | 0.006 | 2 | ||||
| 0.10 | 0.14 | 0.44 | 0.017 | 3 | ||||
| 0.31 | 0.34 | 0.75 | 0.028 | |||||
| 0.31 | 0.36 | 0.75 | 0.090 | |||||
| 0.77 | 0.31 | 0.41 | 0.012 | |||||
| 0.86 | 0.33 | 0.41 | 0.020 | |||||
Note. — (1,2) Fitted quantities; (3,4) parameters of linear fit with errors; (5) reduced of the fit; (6) rms-scatter in ; (7) mean error ; (8) significance of the relation (probability that there is no relation according to a Spearman rank order correlation test); (9) figure in which the relation is shown.
| galaxy | ||||||
|---|---|---|---|---|---|---|
| (1) | (2) | (3) | (4) | (5) | (6) | (7) |
| 0144 | ||||||
| 0282 | ||||||
| 0756 | ||||||
| 1176 | ||||||
| 1750 | ||||||
| 2417 | ||||||
| 2440 | ||||||
| 3414 | ||||||
| 3510 | ||||||
| 3792 | ||||||
| 3958 | ||||||
| 4822 | ||||||
| 4928 | ||||||
| 5279 | ||||||
| 5568 | ||||||
| 5975 |
Note. — (1) Galaxy id from Godwin, Metcalfe & Peach (1983); (2) average dark matter density inside ; (3) halo assembly redshift according to equation (11) with and ; (4) as column (2), but including the baryonic correction defined in equation (8) (we do not derive an error estimate for the baryonic contraction, but use the same errors in columns (2) and (4), respectively); (5) as in column (3), but with baryon corrected and from equation (12); (6) central stellar age from Tab. B.1 of Mehlert et al. (2003) (GMP3958 has no age estimate because of its very low H); (7) formation redshift of the stars derived from column (6). In some galaxies the stellar age or its upper limit exceed the age of the universe in the adopted cosmology. In such cases only a lower limit is given for or the upper redshift error is set equal to , respectively.
| galaxy | fit | ||||||
|---|---|---|---|---|---|---|---|
| (1) | (2) | (3) | (4) | (5) | (6) | (7) | (8) |
| GMP3414 | SC | ||||||
| LOG | |||||||
| NFW | |||||||
| GMP4822 | SC | ||||||
| LOG | |||||||
| NFW |
Note. — (1) galaxy id; (2) type of fit (SC: without dark matter; LOG: logarithmic halo; NFW: halo profile from Navarro, Frenk & White 1996); (3) best-fit stellar (-band); (4,5) best-fit logarithmic halo parameters and ; (6,7) best-fit NFW concentration and flattening (cf. Thomas et al. 2007a for details); (8) achieved goodness-of-fit (per data point).