The Centrality Dependence of the Parton Bubble Model for high energy heavy ion collisions and fireball surface substructure at RHIC
Abstract
In an earlier paper we developed a QCD inspired theoretical parton bubble model (PBM) for RHIC/LHC. The motivation for the PBM was to develop a model which would reasonably quantitatively agree with the strong charged particle pair correlations observed by the STAR collaboration at RHIC in Au + Au central collisions at = 200 GeV in the transverse momentum range 0.8 GeV/c to 2.0 GeV/c. The model was constructed to also agree with the Hanbury Brown and Twiss (HBT) observed small final state source size 2fm radii in the transverse momentum range above 0.8 GeV/c. The model assumed a substructure of a ring of localized adjoining 2fm radius bubbles perpendicular to the collider beam direction, centered on the beam, at mid-rapidity. The bubble ring was assumed to be located on the expanding fireball surface of the Au + Au collision. These bubbles consist of almost entirely of gluons and form gluonic hot spots on the fireball surface. We achieved a reasonable quantitative agreement with the results of both of the physically significant Charge Independent (CI) and Charge Dependent (CD) correlations that were observed. In this paper we extend the model (PBME) to include the changing development of bubbles with centrality from the most central region where bubbles are very important to the most peripheral where the bubbles are gone. Energy density is found to be related to bubble formation and as centrality decreases the maximum energy density and bubbles shift from symmetry around the beam axis to the reaction plane region causing a strong correlation of bubble formation with elliptic flow. We find reasonably quantitative agreement (within a few percent of the total correlations) with a new precision RHIC experiment which extended the centrality region investigated to the range 0-80% (most central to most peripheral). The characteristics and behavior of the bubbles imply they represent a significant substructure formed on the surface of the fireball at kinetic freezeout.
pacs:
25.75.Gz, 12.38.MhI Introduction and Review of Model
In the early eighties L. van HoveVanHove proposed a bubble model as a way of finding convincing evidence for a Quark-Gluon Plasma (QGP). His model based on a string calculation predicted that in one to perhaps a few observable localized rapidity bumps would appear in the final state of some events and he gave a prescription for experimentally finding them. We searched for these in all relevant data, but we nor anyone else ever found experimental evidence for the rapidity bumps.
There were numerous other bubble models and some charge correlation models proposed. Some examples of these are referencesLopez ; Pratt ; Gyulassy ; Dumitru ; Drescher ; LL . However, to our knowledge no significant experimental evidence has been found for any of these.
In a previous publicationPBM we proposed a parton bubble model (PBM) for central (impact parameter near zero) high energy heavy ion collisions at RHIC/LHC which contains a substructure consisting of an 8fm radius single ring of a dozen adjoining 2f radius bubbles transverse to the collider beam direction, centered on the beam, and located at or near mid-rapidity on the expanding surface of the fireball at kinetic freezeout. The bubble radius, and the bubble ring radius were estimated considering the Hanbury-Brown and Twiss (HBTHBT ) observations, and other general considerations utilizing the blast wave model. We assumed these bubbles (gluonic hot spots) are likely the final state result of quark-gluon plasma (QGP) formation. Thus this is the geometry for the final state kinetic freezeout of the QGP bubbles on the surface of the expanding fireball treated in a blast wave model. In the central (near impact parameter 0) mid-rapidity region at RHIC we are observing the region where the highest energy densities and temperatures (parton energies) are produced. The experimentally observed = 200 GeV central Au + Au collisions at RHICcentralproduction produce initial energy densitiesadams which exceed those predicted by lattice quantum chromodynamics (QCD) as sufficient for production of a QGPkarsch .
This single bubble ring resides at mid-rapidity on the surface of the expanding fireball at kinetic freezeout. Thus each bubble would emit a considerable fraction of final state particles (observed experimentally) resulting from the QGP state. The fraction of all the final state particles from bubbles is 1/2. There would be very little re-interaction for particles emitted outward from the surface because the final state surface of the fireball is at kinetic freezeout. The bubble substructure (surrounded by cooler background) results in the lumpy surface of the fireball at kinetic freezeout. Section II presents more detail on the assumptions made, the development, and construction of the PBM.
The PBM successfully explained in a reasonably quantitative manner all of the particle pairs correlations in a precision STAR central production experimentcentralproduction . See Section 4 of Ref.PBM for this comparison. In Ref.PBM some aspects of quark-quark recombination were compared with the PBM and a good agreement was obtained (see Section 5 PBMPBM ).
In this paper we extend the model of Ref.PBM to consider the case of varying the centrality bins (Section III). We wish to compare with a new RHIC = 200 GeV minimum bias Au + Au analysis which covered the 0-80% centrality rangecentralitydependence .
This paper is organized as follows:
Section I is the Introduction. Section II summarizes the assumptions made in the prior model (PBM) for the central region (0-10% centralityPBM ) Section II also discusses the relevance and the reasoning behind these assumptions. Section III discusses extending the PBM to the Parton Bubble Model Extended (PBME) so that it becomes able to reasonably quantitatively fit and explain the new 0-80% centrality high precision datacentralitydependence . Section IV discusses general characteristics of the PBM. Section V presents and discusses a comparison of the experimentally determined Charge Independent (CI) correlation with PBME as a function of % centrality. Section VI presents and discusses a comparison of the experimentally determined Charge Dependent (CD) correlation with PBME as a function of % centrality. Section VII presents further details of the PBME bubble correlation. Section VIII is the Summary and Discussion.
II Assumptions and Development of the PBM
Our goal for the past 2 decades was to develop a model of bubble production in relativistic heavy ion collisions assumed to originate from a QGP, which could be reasonably quantitatively compared with relevant experimental data of sufficient precision and scope. Thus hopefully we could obtain convincing, or at least substantial evidence for the existence of bubble production. Since this is a process which clearly involves strong non-perturbation QCD, pQCD calculations can serve only as a rough guide.
Thus we concluded we needed to obtain a strong hint from experimental data as evidence for possible bubble substructure to proceed to build a realistic model. The failures of obtaining significant experimental evidence for the many bubble models which did not incorporate such a strong hint from the experimental data led us to conclude that it was essential to obtain one from experimental observations. Then one could build the bubble model based on observations in order to provide quantitative description of the data.
We utilize a two particle correlation function in the two dimensional (2-D) space of vs . The azimuthal angle of a particle is defined by the angle of the particle with respect to the vertical axis which is perpendicular to the beam axis and is measured in a clock-wise direction about the beam. is the difference, - , of the angle of a pair of particles (1 and 2). The pseudo-rapidity of a particle is measured along one of the beam directions. is the difference, - , of the values of a pair of particles (1 and 2).
The two dimensional (2-D) total correlation function is defined as:
| (1) |
Where S() is the number of pairs at the corresponding values of coming from the same event, after we have summed over all the events. M() is the number of pairs at the corresponding values of coming from the mixed events, after we have summed over all our created mixed events. A mixed event pair has each of the two particles chosen from a different event. We make on the order of ten times the number of mixed events as real events. We rescale the number of pairs in the mixed events to be equal to the number of pairs in the real events.
The behavior of the HBT quantum interference radiiHBT , especially was interpreted as indicative of observation of spatial radii 2fm in RHIC central Au + Au collisions at = 200 GeV for 0.8 GeV/c. reduced to 2fm from 6fm as increased from 0.2 GeV/c to greater than 0.8 GeV/c. HBT quantum interference is by necessity only measured for pairs of charged particles of the same sign with small difference in momentum. In our model all particles coming from a bubble are constrained to come from a 2fm radius. Particles above 0.8 GeV/c that come from different bubbles differ in momentum such that they do not show HBT quantum interference.
The generally accepted explanation for observing these increasingly smaller final state HBT radii as increased was that radial flow increasingly focused the viewed region of the overall final state source into a smaller volume as increased. We refer to this phenomenon as phase space focusing due to flow. We realized (in our first bubble model paperthemodel published in 2003) that flow phase space focusing implies that the viewed region on the surface for 0.8 GeV/c of the fire ball would have a volume with radii of 2fm. With in this volume a hot source producing a larger number of particles would move out away from the surface, and being focused together would lead to an increase of particles emitted in an angular region. However the HBT correlation function has the property that a ring of essentially similar bubbles as assumed in our PBM model would image on top of each other forming an average bubble which HBT would be viewing. The lower cut of 0.8 GeV/c would allow HBT to view and resolve this average bubble formed from differences in momentum of two particles for above 0.8 GeV/c. Our model populated these HBT viewed regions with a ring of bubbles or gluonic hot spots producing a larger number of particles with an angular correlation. We form a correlation function based on the difference of angles between two charged particles which images the 12 bubbles on top of each other.
It is important to note that we have calculated that the correlations observed at RHIC are strong enough so that if there was only one bubble instead of a ring of bubbles distributed around the azimuth as our PBM assumed, one would produce an angular region with huge amplitude spikes in individual events. These spikes are not observed in individual events at RHIC. Therefore the RHIC correlation data has to be built of smaller distributed correlated regions as assumed by the PBM.
We had used a virtually identical bubble ring and the same correlation function in our first bubble modelthemodel which was published in 2003 and was able to predict and subsequently explain important general characteristics of the experimental analysis of the two charged particle correlation data for central collisionscentralproduction . This experimental paper used the cuts developed in our 2003 paper 0.8 2.0 GeV/c. The 2 GeV/c cut was employed to make jet contamination negligible. The angular correlations used the differences of the azimuthal angles () and the differences of psuedorapidity () of all charge particle pairs which had the property that imaged all bubbles in the ring on top of each other. This allowed the phase space focusing by radial flow to provide consistency with the observed correlation data analyses and the HBT observations.
An important assumption made in our PBM is that in a central heavy ion collision (e.g. Au + Au) at high RHIC energies a high density of energetic partons (virtually all gluons) form a dense opaque fireball. This dense opaque fireball has a large amount of radial flow and can be described very well by a blast wave model. The usually employed blast wave model we usedHBT has its maximum velocity at the surface of the fireball at kinetic freezeout of approximately (3/4)c.
A theoretical pQCD calulationKajantie in 1987 concluded that jets formed with initial parton transverse momenta of around 3 GeV/c (also applicable down to 2 GeV/c) would become thermalized in a = 200 GeV U + U collision at RHIC and would not escape from the system. Therefore these jets would not result in the correlations observed at RHICcentralproduction . One could speculate that these thermalized jets form the dense opaque fireball.
There is direct experimental evidence of strong quenching of high particles at RHIC (e.g. Refs.quench1 ; quench2 ; quench3 ). An experimental result which is independent of our model demonstrates that in the central region charged particles with of (0.8 4.0 GeV/c) are emitted from the surface of the dense opaque fireball. This point was demonstrated in Section IV B of Ref.centralitydependence . We quote the last 3 sentences from this Section IV B which states the conclusion. “This surface or near surface hadronization and emission from the fireball both occur in the central region and all other centralities where there is appreciable particle density. In the most peripheral bins the particle density is low enough to allow undisturbed fragmentation and thus no change in the CD correlation. Thus the CD behavior is consistent with a surface emission model such as Ref.PBM .” This result implies that surface or near surface emission occurs for charged particles with (0.8 4.0 GeV/c) for all centralities.
The HIJING event generatorhijing combines Pythia jetspythia and the Lund modellund and thus was a familiar base for constructing our PBM model. As we had done in our earlier bubble modelthemodel , we replaced the Pythia jets in HIJING with our bubble ring. Momentum, energy and charge conservation are all satisfied within the bubble ring in the PBM. The bubble ring becomes the source of emmitted particle correlation generated by Pythia which we used for fragmentation of the bubbles. We made the approximation that hard jet particles are essentially removed or have their correlations removed by quenching. The only remaining particles from HIJING are the beam jet fragmentation particles which are soft and have no correlation. These particles become our background particles in the PBM. However we did include the effects of elliptic flowellipticflow on the soft beam jet fragmentation particles, since elliptic flow does generate a small cos term in the correlation even in the central collisions. The procedure we employed was to in each event determine the reaction plane and modulate the soft beam fragmentation particles by the elliptic flow term cos which was a sufficient approximation for elliptic flow effects. Thus the elliptic flow effects were put into the model on an event by event basis. In the PBM we used angular correlations of charge particle pairs to predict and fit the experimentally determined correlationscentralproduction .
In Fig.3 of the PBM publicationPBM we schematically show a number (3-4) of parallel parton showers contained in each bubble. The parton showers must be parallel to give results which are consistent with the experimental analysis of angular correlations.
The particle production from our bubbles uses a similar parton QCD shower fragmentation as a jet with a well defined angle (Fig.2 of the PBMPBM ). The distribution of the partons inside the bubble is similar to pQCD but has a suppression in the high region like the dataquench1 ; quench2 ; quench3 . The 3-4 partons have different longitudinal momentum. At kinetic freezeout we used Pythia fragmentation functionspythia for the bubble fragmentation to form the final state emitted charged particles.
Models that successfully predict and fit non-perturbative QCD experimental results reasonably, almost always have to adjust some parameters when comparing with experimental data. In the PBM there are two such adjustable parameters which are the number of partons in a bubble and the longitudinal momenta of the partons. Ever since Landau discovered in cosmic rays a long time ago that excited nuclear fireballs exhibited a longitudinal expansion this fact was well known. Adjusting the longitudinal momenta of the partons is obviously necessary to explain the expansion in in the central production experimentcentralproduction . The two parameters in the PBM were adjusted for a set number of bubbles by comparing the PBM fit to the experimentally determined final state charge pair correlation (CI defined below).
In our models (e.g. PBM) the experimental correlation data analysis we are comparing to utilizes the correlations of charge particle pairs. There are 2 types of such correlated pairs, namely unlike-sign charge pairs (US) and like -sign charge pairs (LS). The total sample of correlated charge pairs generated and emitted in the final state of a theoretical model is equal to the average of the US and LS correlations ((US + LS)/2). In an experiment the total sample detected depends on the acceptance and efficiency of the detector. One makes cuts on the theoretical model to account for these effects. However the correlation function used in equation 1 is conventionally used in experimental analyses and is drastically independent of acceptance effects as stated in Section 2.1PBM allowing reasonable comparisons.
The Charge Independent (CI) correlation is conventionally defined as the unlike-sign charge pair correlation (US) + like-sign charge pair correlation (LS). The total correlation derived when using all particle pairs independent of what charge signs are used to form the correlation is equal to CI/2. Thus CI/2 gives the average structure of the correlated emitting sources independent of charge and represents the overall physical phenomenon.
The Charge Dependent (CD) correlation is conventionally defined as the US - LS. The subtraction of the total like-sign charge pairs correlation (LS) in forming the CD is equivalent to removal of the opposite sign charge pairs which are not from the same space-time region where charge has to balancebalfun ; centralproduction . Therefore the CD is expected to represent the correlation of unlike-sign pairs from the same space-time region where charge is balanced as modified by interaction with the medium. In our surface emission model (PBM) the interaction with the medium is absent therefore, the CD is expected to exhibit the correlation of Pythia jets which are produced in a vacuum.
In Section 4.2 of the PBMPBM we compare the total CI correlations of PBM and precision experimental correlation datacentralproduction . We adjusted the two parameters by comparing the CI of the PBM with the CI of the data. We show the PBM and the data agree within less than 10% of the total CI correlation which is a reasonably quantitative agreement.
In Section 4.3 of the PBMPBM we compare the CD correlations of PBM with the experiment by making use of the fact that the net charge fluctuation suppression is directly related to an integral over the CD. Thus we compared the net charge fluctuation suppressions of the data with the PBM and found agreement within errors. We did the comparison of the CD in this way since the experimental paper we compared the model with considered this to be an important aspect of the CD correlation and chose to treat the CD in this manner.
III Extension of PBM to cover 0-80% centralities
The PBM is a successful bubble model for central heavy ion (e.g. Au + Au) collisions at the highest energy at RHIC as discussed in the previous section. However an interesting question that arises is what would happen to bubble production and the general characteristics of charge pair correlations as centrality varies from most central (impact parameter near zero) to peripheral collisions. The PBM has been successfully tested in the centrality range approximately (0-10%). A new precision RHIC minimum bias trigger data analysis for Au + Au collisions at = 200 GeV in transverse momentum range 0.8 GeV/c to 4.0 GeV/c covers the 0-80% centrality rangecentralitydependence and is ideally suited for investigating the varying centrality evolution of the PBM. This experimental analysis was done in a manner which was a logical extension of the central production papercentralproduction . The data, the charge particle pairs correlations (US and LS), the CI and the CD were treated in a similar manner, but analyzed and fit separately in each of nine centrality bins.
In the data analysiscentralitydependence the most central bins US, LS, and CI were consistent with the results of the prior central production experiment. However as one moves from central to peripheral bins a jet-like component is increasingly evident (in the data analysis) till the most peripheral bins where there is only jet-like correlations. The elliptic flow amplitude as part of the correlation increases as one moves to more peripheral centralities. This flow reaches its maximum at 40-50% centrality (see Fig. 28 of Ref.centralitydependence ).
We will proceed to extend the PBM to include the entire 0-80% centrality region. We name this extended version of the PBM as PBME. Several obvious characteristics of the experimental and theoretical analysis that must be included in this extension of the model to PBME are discussed below.
The previous central collision bubble ring geometry was well suited for the most central collisions situation since the highest energy densities are circular around the beam which is the expected geometric symmetry. As one moves from central toward peripheral the decreasing size and change of shape of the overlap region of the two Au nuclei determines where the energy densities are highest. The overlap of matter in the two Au nuclei becomes greater in the reaction plane region, while the overlap of matter becomes less outside of the reaction plane. This breaking of symmetry will modify the overall spatial shape and location of the bubbles.
The effects of elliptic flowellipticflow on the events in each centrality bin were put into the model using the same procedure we used as previously described in Section II for the PBM. The procedure we employed was to in each event determine the reaction plane and modulate the soft beam fragmentation particles by the elliptic flow term cos which was a sufficient approximation for elliptic flow effects. Thus the elliptic flow effects were put into the model on an event by event basis.
Jet quenching is largest in the most central collisions and decreases as one moves to more peripheral bins. We found a sufficient way to put the effects of strong jet quenching in the central collisions. We set jet quenching to its maximum in HIJING for 0-30% centralities by removing all jets (quenched away). For centralities 30-80% we use the non-jet-quenching version of HIJING thus all jets become part of the event. The soft beam jet particles have elliptic flow as described above.
We relied on the blast wave to determine the geometry of where the energy density is highest. These regions of high energy density is where bubbles are formed. In the final state at kinetic freezeout the bubbles are located on the fireball (blast wave) surface which is the source of emmitted correlated charge particle pairs generated by Pythia fragmentation of the bubbles. Thus the blast wave determined the location, number and geometry of the bubbles.
IV General characteristics of the PBME
For the most central bin we have the same bubble geometry and partons per bubble as Ref.PBM ; namely 12 bubbles and 3-4 partons per bubble. As we move away from the most central the number of partons per bubble decreases dropping to 3 then 2 and finally 1 at 50-60% centrality. The number of bubbles formed per event decreases from 12 in the most central bin to 0.3 in the 50-60% bin (see Table I in this section).
The most central collisions have a bubble ring symmetry about the beam axis (see Fig.1 of Ref.PBM ). The region of highest energy density will also be symmetric about this axis and the ring of bubbles is the expected geometry. As we move to more peripheral collisions the symmetry becomes defined by the reaction plane. The region of highest energy density becomes more concentrated in the region of the reaction plane. Therefore it is reasonable to expect the ring symmetry will be broken and the bubbles farthest from the reaction plane would disappear. We find comparing 0-5% centrality to 5-10% centrality the 12 bubbles reduce to 10 bubbles with the bubbles perpendicular to the reaction plane gone. For 10-20% the number drops to 7 bubbles with 4 bubbles being near the reaction plane and 3 appearing above and below the plane, while for 20-30% we drop to 5 bubbles with 4 bubbles being near the reaction plane with only 1 appearing above or below the plane. Moving to 30-40%, 40-50%, and 50-60% the bubbles are in the reaction plane region with the probability per event of making a bubble being 1.5, 0.6, 0.3 respectively (see Table I). The above changes in bubble production are due to the decrease in energy density as the % centrality range becomes more peripheral which decreases the overlap region of the Au + Au colliding nuclei.
The STAR experiment has measured charged particle pair correlations for minimum bias Au + Au events at = 200 GeVcentralitydependence . The range of that data is 0.8 to 4.0 GeV/c for the entire range and the range . Both the experimental data analysis compared to and the PMBE model utilize two dimensional correlations. See examples of these two dimensional perspective plots in Refs.PBM ; centralproduction and Fig.11-12 (this paper).
In order to compare and present these two dimensional plots for the new datacentralitydependence and the PBME we divided the entire region into five bins which covered the entire range. Each bin could then be presented as a one dimensional projection and a comparison between data and model can be made. The five bins were 0.0 to 0.3, 0.3 to 0.6, 0.6 to 0.9, 0.9 to 1.2 and 1.2 to 1.5. In each of these five bins the correlations for the charged particles covered the entire range 0 - . Due to demonstrated symmetry in the data and the model the range which was experimentally detected was folded resulting in the ranges.
| Table I | ||
|---|---|---|
| Centrality | bubbles per event | partons per bubble |
| 12 | 3-4 | |
| 10 | 3 | |
| 7 | 3 | |
| 5 | 3 | |
| 1.5 | 2 | |
| 0.6 | 2 | |
| 0.3 | 1 | |
Table I. Parameters of bubble model with centrality.
V Charge Independent (CI) correlation
In this section we are going to compare the PBME model predicted CI correlations with the STAR experimental analysis resultscentralitydependence . The two particle correlations are formed from two different types of charge particle pairs:
1) Unlike-Sign charge pairs (US)
2) Like-Sign charge pairs (LS)
The Charge Independent (CI) total correlation = US + LS. It is the sum of the CI signal + Background correlations in the final state after kinetic freezeout. Thus it is the total two particle correlation observed in the detector (STAR TPC). The entire CI correlation (signal + background) is used for comparing the analysis results with the model. This eliminates any model dependence on the separation of signal from background. Certain necessary corrections and cuts in the experimental analysis were applied to the PBME model (this paper) so that a quantitative comparison could be made with the experimental analysis. The CI displays the average correlation structure of the emitting sources in the final state after kinetic freezeout and thus is physically significant.
The five plots comparing the experimental analysis of the CI and the PBME fits are shown in Fig. 1-5. On the vertical axis the CI is multiplied by the average event multiplicity within the particular centrality bin shown by the symbols on the plot. This procedure is necessary when one compares different centralities in order to make the comparison independent of multiplicity.
The correlation function is given in equation 1. The experimentally observed correlation has a numerator which is proportional to the number of correlated particle pairs which itself is proportional to the multiplicity. However the denominator is proportional to the total number of pairs which can be formed which is proportional to the square of the multiplicity. Therefore in order to make comparisons of different centralities or other experiments one multiplies by the average multiplicity to remove the dependence on the multiplicity. This procedure is referred to as multiplicity scaling or multiplicity scaled.
For each centrality we generated 500,000 simulated events with the bubble geometries presented above. The impact parameter range of HIJING for the different centralities is given in Table II. See Table I for the number of bubbles per event and partons per bubble as a function of % centrality bins.
| Table II | |
|---|---|
| Centrality | Impact parameter (fm) |
| 0.0-2.9 | |
| 2.9-4.1 | |
| 4.1-5.8 | |
| 5.8-7.1 | |
| 7.1-8.2 | |
| 8.2-9.2 | |
| 9.2-10.1 | |
| 10.1-10.9 | |
| 10.9-11.7 | |
Table II. Impact Parameters of HIJING with Centrality.
In Fig.1 to Fig.5 we used the STAR calculated Charge Independent (CI) correlation which is the average correlation of the unlike-sign charge pairs correlation plus the like-sign charge pairs correlation. In order to allow comparison with the different centrality bins we and also STAR multiplied by the multiplicity, because as explained previously this removes the dilution of the signals due to the quadratic increase of pair combinations. The multiplicity that is used in Ref.centralitydependence is based on the particles measured in the STAR TPC (Time Projection Chamber). There are readout boundaries between the 12 TPC sectors which cover the azimuth that do not measure tracks. We put these readout boundaries in our Monte Carlo generation of our particles, which cause a loss of approximately 10% of the particles.
The multiplicity scaled correlation for each centrality for a given bin is plotted with the maximum angle of the away side () shifted to the same value. The horizontal line for each centrality shows the shifted average multiplicity line which was normalized to a mean of 1 in the original CI correlation and became equal to the average multiplicity after becoming rescaled to the scaled correlation. The solid curves are the PBME calculations shifted by the same amount as the data. The agreement between the PBME and the RHIC data in Fig.1 to Fig.5 is within a few percent of the total correlation. Considering that the model (PBME) does not completely include important non-perturbative QCD effects contained in the data we consider this a reasonable quantitative agreement. The CI x multiplicity displays the average structure of the correlation sources at kinetic freezeout.


VI Charge Dependent (CD) correlation
We compare total experimentally observed CD correlations to total theoretically predicted CD correlations in order to avoid possible uncertainties due to separation of signals and background.
The Charge Dependent (CD) correlation which is the difference between the unlike-sign charge pair correlations and the like-sign charge pair correlations ( US - LS ) displays a measure of the emission correlation of the opposite sign pairs of particles emitted from the same space-time region at the time of hadronizationbalfun ; centralproduction . The CD as all correlations in all centrality ranges in the PBME (which includes a HIJING jet component) has it’s fragmentation of all partons determined by Pythia fragmentationpythia . We use the same projection method of the 2-D CD correlation into the same five ranges and multiply the CD by the multiplicity as described and discussed in the previous Section V. In Fig.6 we show the multiplicity times the CD correlation from Ref.centralitydependence within the range 0.0 to 0.3 for each centrality compared to the bubble model (PBME) calculations. We achieve a good agreement between data and model. Similar results and good agreement with the PBME occurs for the four other ranges not shown. Thus we have good agreement in all 5 ranges which together comprise the entire CD.
In Fig.7 we plot from Ref.centralitydependence the CD correlation for 4 bins covering the range 0.0 1.2.111The range 1.2 to 1.5 (not shown) is just a flat background with very little CD signal from Pythia parton fragmentation left. Each of 9 centralities shown were scaled so that the 5 - bin for 0.0 0.3 range is normalized to 1. This was done in order to remove the scale difference between the different centrality ranges and allow us to show that the CD shape is approximately independent of centrality. In Fig.7 the experimental analysis points in each range cluster around the four lines which corresponds to each of the four ranges generated by Pythia jetspythia . Pythia jets were used as the jets in HIJING and Pythia fragmentation was used in the parton bubble modelPBM . Thus the CD shape is in good agreement with Pythia and is independent of centrality. Pythia jet CD correlations are the initial correlations of opposite sign charge pairs from the same space-time region at the time of hadronizationbalfun ; centralproduction . The fact that there is essentially no change in these correlations at the time of kinetic freezeout demonstrates that there is little or no further interaction of these opposite sign charge pairs with the fireball medium from the time of hadronization till the time of kinetic freezeout. Thus both hadronization and kinetic freezeout occur at or very near the surface of the expanding fireball at all centralities. Hence in general the fireball is dense and opaque at kinetic freezeout. One should note that in the peripheral bins there is very little matter in the short path length from any point to the surface. This is consistent with surface emission from the fireball at kinetic freezeout or undisturbed fragmentation in those peripheral bins where the path length to the surface is small.
Both the original parton bubble model (PBM)PBM and the present extension of the model (PBME) construct surface bubbles which are boosted by the expanding fireball. These bubbles at freezeout give results that are consistent with experimental correlation datacentralitydependence . Furthermore the PBME fits the observed CD correlation to within a few percent of the correlation at all centralities. The PBME produces the CD shape that is consistent with Pythia jet CD correlations. As previously shown in Section V the PBME fits the observed CI correlations to within a few percent of the correlation. The US and LS correlations are linear combinations of the CI and CD. Therefore they are also fit to within a few percent of the correlation. Thus all two charge particle pair correlations are reasonably quantitatively fit by the PBME (Parton Bubble Model Extended). One should note that the fireball in both the PBM and PBME is treated in a blast wave model with the bubbles forming on the surface and emitting their final state particles at kinetic freezeout. The fireball surface is moving at the maximum velocity at kinetic freezeout.


VII Further Discussion of the Parton Bubble Model Correlation
We note from Tables I-III that as we move from the most central region (impact parameter small) toward the peripheral bins the number of bubbles in a centrality bin per event and the number of partons per bubble both tend to decrease. In the two most peripheral bins bubble production is negligible.
| Table III | |||
|---|---|---|---|
| No partons | particles per bubble | per bubble(GeV/c) | energy per bubble(GeV) |
| 3-4 | 8.5 | 7.0 | 9.8 |
| 3 | 7.0 | 5.7 | 8.0 |
| 2 | 4.9 | 4.0 | 4.9 |
| 1 | 2.6 | 2.1 | 2.1 |
Table III. Parameters of bubble model per number of partons.
Fig.8 and Fig.9 are 2 dimensional perspective plots -- of the part of the CI correlation multiplied by the multiplicity (multiplicity scaled) which results from particles emmitted from the same bubble in the centrality bins shown. The angular distributions of the correlation are primarily confined to the near side ( ). The shape of the correlation for 0-30% centrality bins peak near small angles and decrease as increases toward and are qualitatively similar. However the distribution shape remains qualitatively broad in the 0-30% centrality bins exhibiting the elongation observed in the datacentralitydependence . One should note that there is very little away side ( ) in any of these centrality bins.
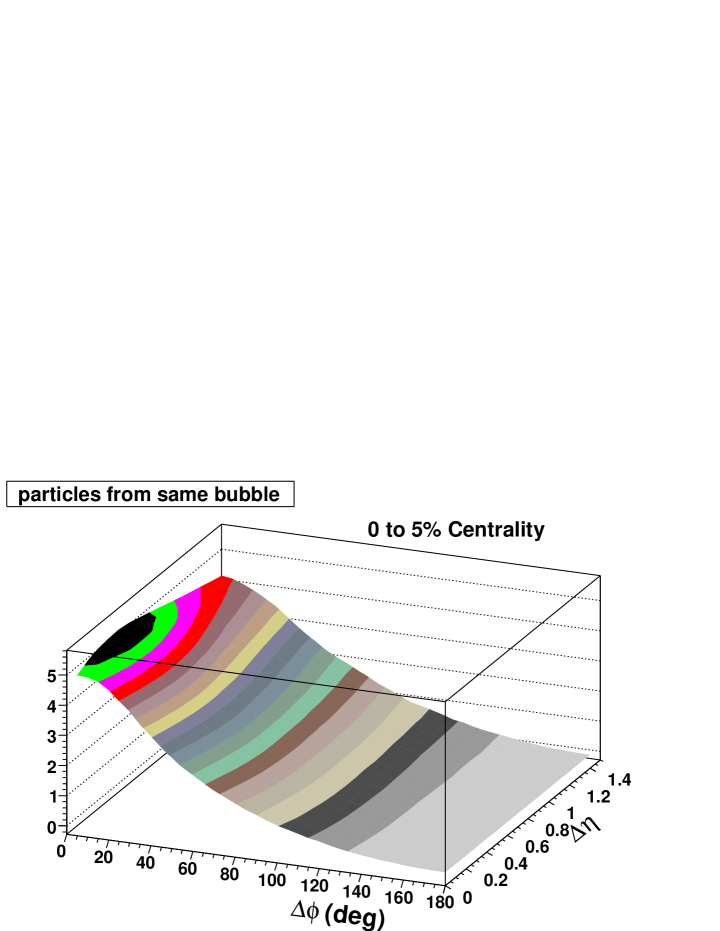
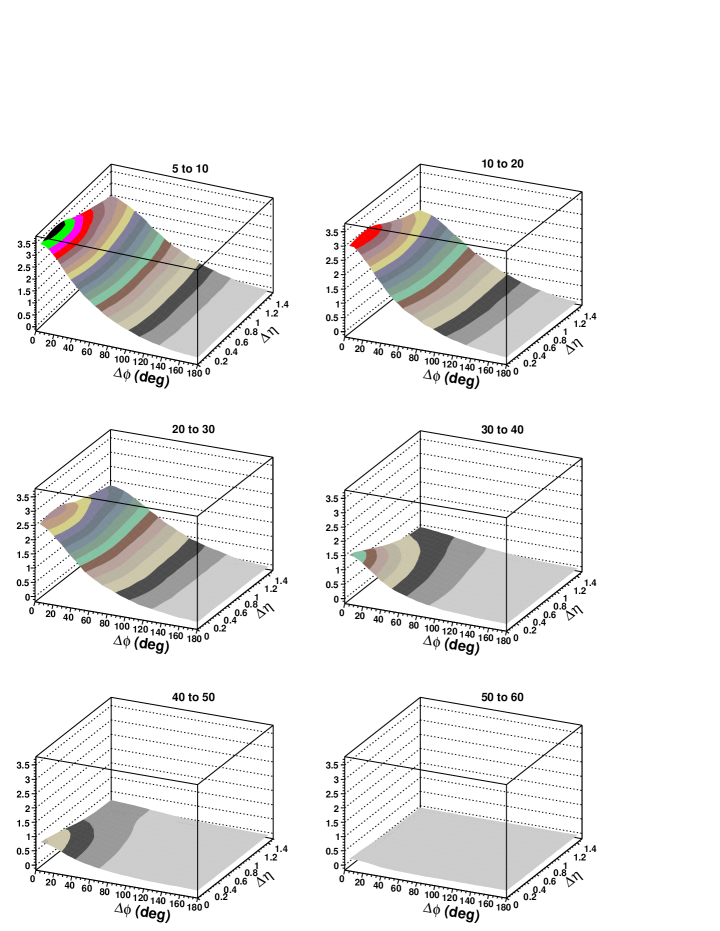

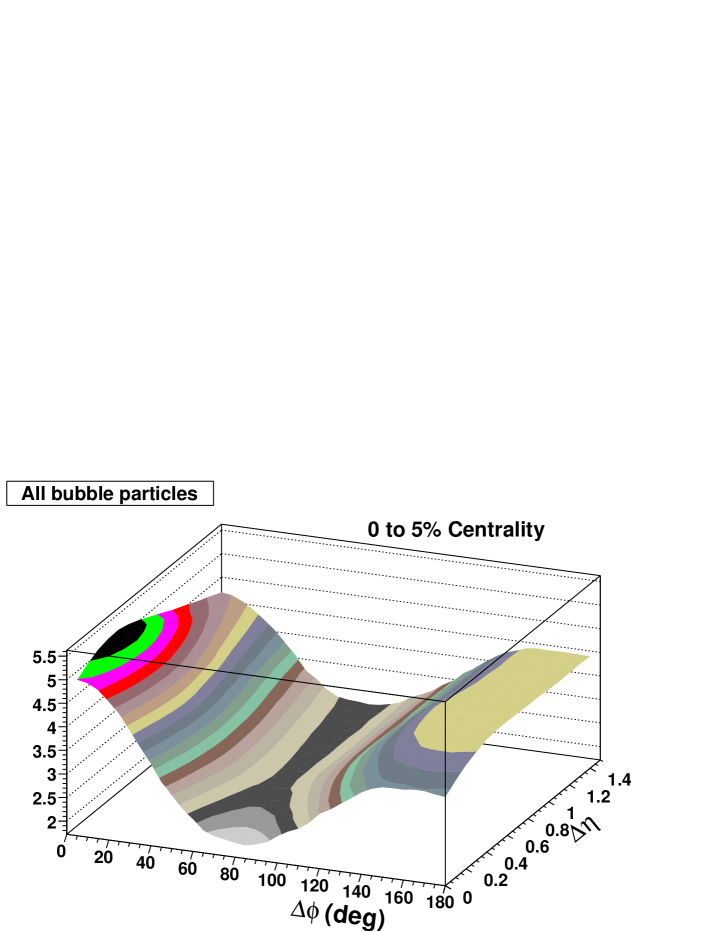
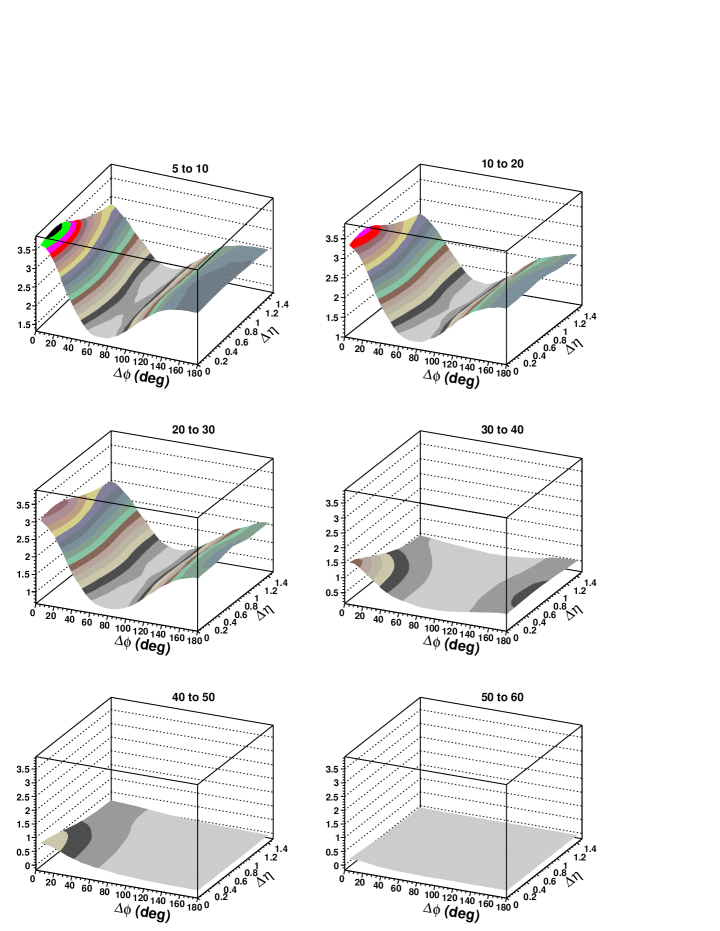
Fig.10 shows a comparison of the bubble signal (particle from the same bubble) shape in of the different centralities in which we have bubbles. The bubbles with the same number of partons are consistent with the same shape in . Thus the longitudinal (i.e. distribution) determines the number of partons in each bubble which determines the longitudinal shape of the bubbles. We can see that there is a maximum expansion in the length of in the most central bin (0-5%) and close to this maximum is maintained through the (20-30%) bin. However the length of considerably decreases in the (30-60%) bins.
In Ref.PBM the ring of bubbles played an important role in the away side ( ) correlation. Correlation between particles from different bubbles show an away side correlation. Fig.11 and Fig.12 show the correlation that resulted from all particles from all the bubbles. We plot this correlation for all centralities where there are bubbles present.
If we compare Fig.8 and Fig.9 (multiplicity scaled CI for particles from the same bubble) with Fig.11 and Fig.12 (multiplicity scaled CI for particles from all bubbles) we note a striking difference in the away side () behavior of the two sets. The correlation resulting from particles emitted by the same bubble produces an away side that is very small (Fig.8 and Fig.9). The away side correlation produced by particles emitted by all bubbles is large in the centrality range 0-30% where bubble production is large and then essentially disappears for the more peripheral centralities where the bubble production becomes small to negligible (Fig.11 and Fig.12). This is due to the model conserving momentum between the bubbles and is consistent with the experimental observations.
Our model results in bubbles forming where energy density is highest. Thus as we have pointed out the most central collisions have the highest energy density and therefore a circular ring of bubbles perpendicular to and centered on the beam axis was able to explain the correlations observed in a 200 GeV Au + Au RHIC central production experimental analysisPBM ; centralproduction . The PBME model with the same bubble geometry has explained the new experimental analysis as a function of centralitycentralitydependence . However as we move away from central production bins toward peripheral bins the highest energy density concentrates in the region of the reaction plane, the central ring symmetry is broken, and the bubbles tend to be produced in the reaction plane region. Thus the geometry of the bubbles become coupled to elliptic flow.
VIII Summary and Discussion
In this article we summarize the assumptions made, and the reasoning that led to the development and construction of our Parton Bubble ModelPBM which successfully explained the charge particle pair correlations in the central (approximately 0-10% centrality) = 200 GeV Au + Au datacentralproduction . The PBM was also consistent with the central collision Au + Au HBT results. This is presented and discussed in Section 4 of Ref.PBM and Section II of this paper. Most of this paper is concerned with extending our model which was a central region model to be able to treat the geometry of bubble production for 0-80% collision centralities (PBME) such as measured and analyzed in recent RHIC datacentralitydependence . In the PBME we included elliptic flow for all centralities and a jet component for centralities of 30-80%, both of which become large while bubble production becomes smaller as the centrality becomes more peripheral. We were able to extend the PBM to the PBME and reasonably fit the new quantitative RHIC 0-80% = 200 Au + Au datacentralitydependence for the CI and CD correlations. We demonstrated that the PBME had a bubble geometry that tracked the highest energy density of the different centralities. The most central collisions have a symmetry about the beam axis. The region of highest energy density will also be symmetric about this axis and the ring of bubbles centered on this axis is the expected geometry nearly identical to that of the PBM.
As we move to more peripheral collisions the energy density decreases. The symmetry of highest energy density becomes coupled to elliptic flow and is defined by the reaction plane. The region of highest energy density becomes concentrated in the reaction plane region. Therefore the ring symmetry which applies to central production was broken and the bubbles farthest from the reaction plane disappear. The 12 bubbles for the most central (0-5%) reduce to 10 (5-10%), then to 7 (10-20%), and then to 5 bubbles (20-30%). Moving to 30-40%, 40-50%, and 50-60% the bubbles are in the reaction plane region with the probability per event of making a bubble being 1.5, 0.6, 0.3 (see Table I).
Both the PBM and the PBME treat the fireball in a blast wave model. Bubbles are formed on the surface of the blast wave fireball which emit the final state particles at kinetic freezeout. We achieve reasonable fits to the quantitative STAR experimental analysis of the Charge Independent (CI) and the Charge Dependent (CD) correlations within a few percent of the total correlationscentralitydependence . These correlations considered particles in the range 0.8 to 4.0 GeV/c. The model is also consistent with the HBT results in this range. The CI correlation displays the average structure of the correlated emitting sources at kinetic freezeout. The CD correlation has the initial emission correlation of the opposite sign charge pairs of particles emitted from the same space-time region at the time of hadronization. This initial correlation should remain consistent with the CD correlation of Pythia jets if there is no further interactions with other particles after hadronization. The analysis above demonstrated that at kinetic freezeout the CD correlation in the above range was consistent with Pythia jets at all centralities (see Section VI). Therefore one concludes that hadronization and kinetic freezeout both occur at or very near the surface of the fireball at all centralities. Thus the expanding fireball is dense and opaque for most centralities at kinetic freezeout. Of course the most peripheral bins due to the low material content allow small path length to the surface. Both the PBM and its extended present version PBME are surface emission models and thus are consistent with this striking experimental feature.
It is of interest to note that the parton bubble model central collision analysisPBM has recently been pointed out in glasma as having features in common with glasma flux tubes which evolve from initial color glass condensates. This supports the hypothesis that the bubble substructure can be considered a QGP signal and may serve as a key in investigating both QGP and glasma effects.
The persistence of the production of similar surface bubbles at kinetic freezeout in numbers which decrease as the highest energy density decreases as the centrality is decreased (going toward the peripheral bins); and their general characteristic of being produced in the region of highest energy density implies the following:
1) The bubbles represent a significant substructure of gluonic hot spots formed on the surface of a dense opaque fireball at kinetic freezeout. The number of bubbles formed and the energy content of each of these substructures is a function of the energy density and its extent in space.
2) Their characteristics, persistence, behavior as a function of centrality, and the PBME reasonably quantitative fits to the CI and CD data at all centralities provide substantial evidence that the bubbles are the final state products of QGP production. If sufficiently convincing QGP signatures can be extracted from these bubbles then one could eventually provide substantial evidence for a QGP. We will be investigating this in future work. The bubbles may contain relevant information on other topics of interest (e.g. glasma) which we will also investigate. In our future program we plan to utilize the anticipated forthcoming availability of Time of Flight particle identification data at STAR to further study charged particles correlations with identified particles. In the second paragraph from the end of Section 1.2 of Ref.PBM we speculated on the possibility of applying these model ideas (suitably modified) to LHC data when it becomes available.
IX acknowledgements
The authors thank William Love for valuable discussion and assistance in production of figures. This research was supported by the U.S. Department of Energy under Contract No. DE-AC02-98CH10886 and the City College of New York Physics Department of the City University of New York.
References
- (1) L. van Hove, Z. Phys. C 27, 135 (1985).
- (2) J.A. Lopez, J.C. Parikh, and P.J. Siemens, Phys Rev. lett. 53, 1216 (1984).
- (3) S. Pratt, P.J. Siemens, and A.P Vischer, Phys. Rev. Lett. 68, 1109 (1992).
- (4) M. Gyulassy, D. Rischke, B. Zhang, Nucl. Phys. A 613, 397 (1997).
- (5) A. Dumitru, D. Pisarski, Phys. Lett. B 504, 282 (2001).
- (6) H.J. Drescher, F.M. Liu, S. Ostapchenko,T.Pierog, and K. Werner, Phys. Rev. C 65, 054902 (2002).
- (7) S.J. Lindenbaum and R.S. Longacre, J. Phys. G 26, 937 (2000).
- (8) S.J. Lindenbaum, R.S. Longacre, Eur. Phys. J. C. 49,767-782 (2007), DOI: 10. 1140/epjc/s10052-006-0131-4 published on line November 15 (2006).
- (9) J. Adams et al., Phys. Rev. C. 71, 044906 (2005), S.S. Adler et al., Phys Rev. Lett. 93, 152302 (2004).
- (10) J. Adams et al., Phys. Rev. C 75, 034901 (2007).
- (11) J. Adams et al., Phys. Rev. C. 70, 054907 (2004).
- (12) F. Karsch, Nucl. Phys. A 698, 199c (2002).
- (13) B.I. Abelev et al., nucl-ex/08060513, R.S. Longacre, Quark Matter 2006, nucl-ex/0702008.
- (14) S.J. Lindenbaum, R.S. Longacre and M. Kramer Eur. Phys. J. C (Particles and Fields) 30, 241-253 (2003). DOI: 10. 1140/epjc/s2003-01 268-3
- (15) K. Kajantie, P.V. Landshoff, and J. Lindfors, Phys. Rev. Lett. 59, 2527 (1987).
- (16) C. Adler et al., Phys. Rev. Lett. 88, 022301 (2002).
- (17) J. Adams et al., Phys. Rev. Lett. 91, 172302 (2003).
- (18) A. Adare et al., nucl-ex/08014020.
- (19) X.N. Wang and M. Gyulassy, Phys. Rev. D 44, 3501 (1991).
- (20) T. Sjostrand and M. van Zijil, Phys. Rev. D 36, 2019 (1987).
- (21) B. Andersson, J. Gustfson, G. Ingelman and T. Sjostrand, Phys. Rept. 97, 31 (1983).
- (22) J. Adams et al., Phys. Rev. C. 72, 014904 (2005).
- (23) S. A. Bass, P. Danielewicz and S. Pratt, Phys. Rev. Lett.85, 2689 (2000), S. Cheng et al., Phys. Rev. C 69, 054906 (2004), P. Christakoglou, A. Petridis and M. Vassiliou, Nucl. Phys. A 749, 279c (2005).
- (24) A. Dumitru,F. Gelis,L. McLerran,R. Venugopalan, Nucl. Phys. A 810 91 (2008).