Polarization proximity effect in isolator crystal pairs
Abstract
We experimentally studied the polarization dynamics (orientation and ellipticity) of near infrared light transmitted through magnetooptic Yttrium Iron Garnet crystal pairs using a modified balanced detection scheme. When the pair separation is in the sub-millimeter range, we observed a proximity effect in which the saturation field is reduced by up to 20%. 1D magnetostatic calculations suggest that the proximity effect originates from magnetostatic interactions between the dipole moments of the isolator crystals. This substantial reduction of the saturation field is potentially useful for the realization of low-power integrated magneto-optical devices.
OCIS codes: 230.3810, 210.3820, 230.3240, 230.2240, 050.1930, 260.5430.
Optical isolators are important polarization components which are controlled by static external magnetic fields. They induce nonreciprocal polarization phase shifts originating from the so-called magneto-optical (MO) Faraday rotation [1]. The unidirectional nonreciprocal polarization control is crucial for the reduction of reflection-related instabilities in active devices [1-6]. A fully functional isolator consists of a magnetically active isolator crystal situated between two crossed polarizers, and a rotation equal to 45∘ of an input linear polarization is required at the wavelength of operation, in the presence of an external magnetic field . Ferrimagnetic iron garnets are popular materials for isolators in the visible and near infrared, as they possess large induced magnetizations, leading to the highest known Faraday rotations in the spectral range used for today’s optical telecommunication systems [7]. Specifically, in a Yttrium Iron Garnet (YIG, Y3Fe5O12) crystal subject to a magnetic field, the latent Faraday angle per unit thickness, at the principal telecom wavelength (1.55 m), is typically 0.016 at saturation, when the light propagates along the crystal’s easy axis of magnetization [7,8]. As a result, a YIG crystal operating in the telecom spectral region typically requires a length of several millimeters to be effective as an optical isolator. In propagation of light through such thick MO samples, the (usually) desirable circular birefringence is accompanied by substantial magnetically-induced circular dichroism [8], which introduces an ellipticity (”smearing”) of the polarization [9].
While the optical response of MO single crystals as a function of the magnetic field has been thoroughly characterized in the past [2-8], the polarization dynamics associated to the combination of several (i.e., separate) MO components, located in close proximity and subject to a uniform magnetic field, has not been addressed so far. Such a study, however, is important in view of recent potential applications involving the integration of several optoelectronic devices on the same chip [2-6,10]. In such devices the overall response of a set of magneto-optical components, including magnetostatic proximity effects [11], plays a significant role and can lead to unexpected and surprising behaviors. In this paper we report our study of the polarization dynamics (in terms of orientation and ellipticity, as a function of the magnetic field) of light transmitted through YIG isolator crystal pairs positioned in series (i.e. one after the other), using a balanced detection scheme. For small separations of the YIG crystal pairs, we observed a magnetostatic proximity effect [11], in which the saturation field is reduced significantly, i.e. by up to 20%.
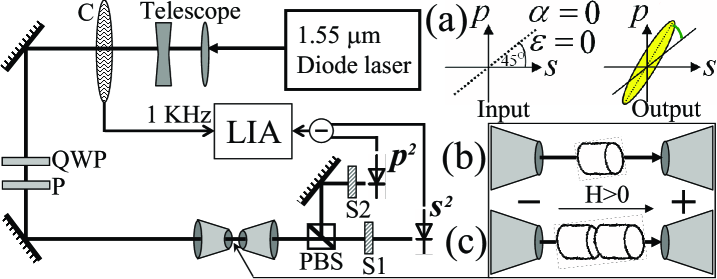
The experimental setup is represented in Fig. 1. A linearly polarized diode laser beam at a wavelength of 1.55 m is collimated with a telescope and passed through a chopper (C) which synchronizes a lock-in amplifier (LIA) at 1 KHz. The combination of a quarter wave-plate (QWP) and a polarizer (P) enables the control of the input linear polarization. The input polarization is always set initially to a value of 45∘ in the first quadrant [0 and 0, see Fig. 1(a)]. After propagation along the magnet, the output beam enters a polarizing beam splitter (PBS) which separates the and components, both of which are detected by a pair of identical photodiode detectors connected to the lock-in amplifier operating in differential mode. Since optical detectors always measure intensity rather than amplitude, the signal read by the amplifier when both channels are open is . When either one or both components change sign, a vectorial correction must be applied, as described below. Each polarization component can be blocked individually with a mechanical shutter (S1 or S2) to read the other component independently. The total optical energy is proportional to , a constant quantity throughout all scans of the magnetic field. In our experiments, we used a GMW magnet (model 3470). With a separation of 2 cm between the poles, the magnet delivers a nearly uniform magnetic field of up to 4 kG within the volume between the poles. Inside the magnet, either a single crystal [Fig. 1(b)] or a pair of crystals [Fig. 1(c)] have been used. Each MO sample is a 2.8 mm-long single crystal YIG rod of 5 mm diameter, polished and anti-reflection coated for operation at the laser’s wavelength. The easy axis of magnetization is nearly parallel to the rod axis, which is also the optical beam and magnetic field directions [see Figs. 1(b),(c)]. The transmission is 88% with a single crystal and 80% with the pair setting.
A general output state of polarization has both an orientation angle with respect to the input state, and an ellipticity angle [9]. We define a normalized balanced detection signal as . In the presence of ellipticity the entire energy can never be set parallel to a single linear polarization state (as opposed to the input state): some residual energy always remains in the other orthogonal state, corresponding to the minor axis of the ellipse. Closing S1 and maximizing the signal by rotating P yields a signal that corresponds to alignment of the ellipse’s major axis along . In the same setting, closing S2 and opening S1 yields a corresponding signal relating to the ellipse’s minor axis aligned along . The square root of the ratio between these signals is thus proportional to the ratio between the polarization ellipse axes, and we can thus define a normalized signal which is measured in conjunction with . A straightforward calculation yields the following relation between the measured signals, and , and the physical parameters and :
| (1) |
The sign in the right-hand term of the first equation corresponds to different quadrants, in the plane, of the output polarization. The actual quadrant of the polarization must thus be taken into account before applying Eq. (1). Each equation yields two real solutions, of which only one has physical meaning. This measurement is sensitive to the sign of , but not to that of .
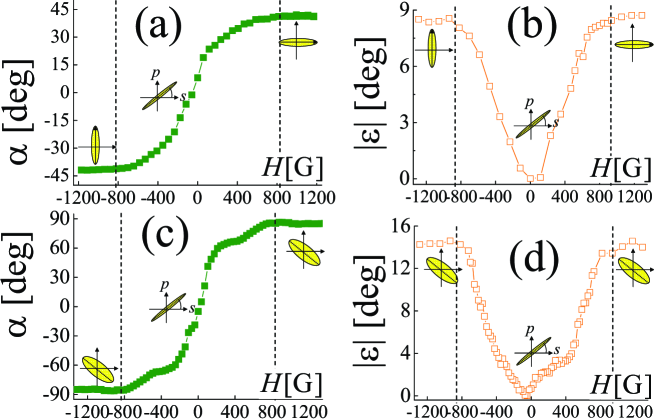
Experimental results are shown in Fig. 2. Considering first the single crystal geometry [Fig. 1(b)], the polarization dynamics (angles and calculated from Eq. (1), as a function of the magnetic field), are shown in Figs. 2(a),(b). Here the polarization is always in the first quadrant of the plane, corresponding to the minus sign in Eq. (1). The slopes obtained from linear fits to and , in fields far below saturation, are 4.110-2 for the Faraday rotation (Verdet coefficient) and 4.510-3 for the magnetic circular dichroism, in accordance with the literature [7,8]. The orientation and ellipticity both saturate in a magnetic field of 820 G at the values of 45∘ and 8∘, respectively. Turning to the double-crystal geometry [Fig. 1(c)], with a 1 mm separation between the crystals, the polarization dynamics are shown in Figs. 2(c),(d). Above half the saturation field, the polarization is in the second or fourth quadrant, and the plus sign is used in Eq. (1). The slopes of and far below saturation are approximately twice those obtained in the single crystal case, implying that the Verdet and the dichroism coefficients, normalized by the total thickness, are equal. The orientation and ellipticity again saturate at 820 G, and their values are 90∘ and 15∘, respectively.
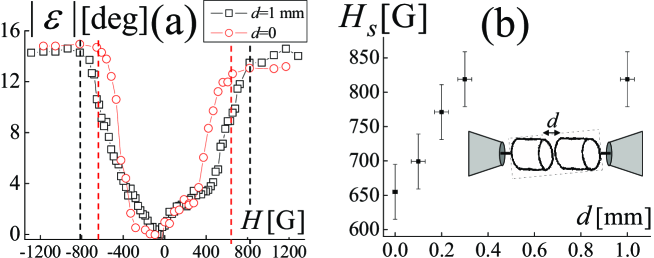
As the distance between the crystals becomes small, however, we observe a strong dependence of the saturation field of both the orientation and ellipticity angles on the crystal separation. Figure 3(a) shows the dynamics of for distant (squares) and adjacent (circles) crystal pair settings. While the saturation field is 820 G when the two crystals are set apart, similar to the case of a single crystal, in adjacent crystal settings the saturation field is reduced to 650 G, namely to 80% of the initial value. A detailed characterization of the saturation field () as a function of the pair facet-to-facet separation () [Fig. 3(b)] reveals that the proximity effect decays on a sub-mm separation scale. As both the Faraday rotation and the magnetic circular dichroism are proportional to the total magnetization, this exponential dependence of the decay on the distance between the two crystals suggests that the proximity effect originates from effective magnetostatic interactions between the crystal magnetic moments in the presence of an external field [11].
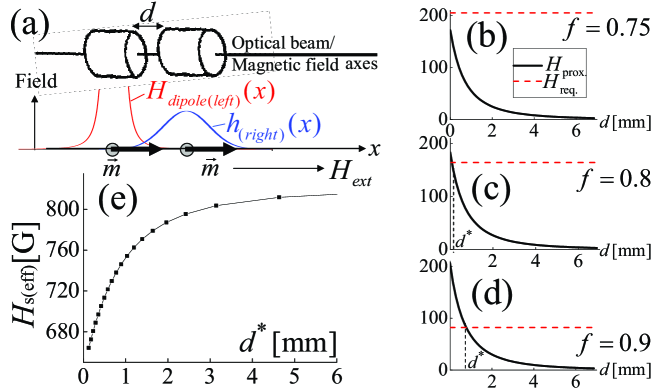
To further support our interpretation of the proximity effect we used a simple 1D theoretical model, the results of which are shown in Fig. 4. A magnetic dipole moment, dispersed around the center, can be assigned to each isolator crystal [see Fig. 4(a)]. In saturation, the typical magnetization along the easy axis is 140 in YIG [7,8]. Integration along the crystal volume yields a magnetic moment of 77 . In the presence of an external magnetic field , where and =820 G, the magnetic moment distribution within each crystal is taken as , where is the density per unit length of the dipole distribution along . Here is taken as a Gaussian distribution with a FWHM of 2.8 mm (the isolator length) and an area of unity. As the easy axis of magnetization, the magnetic field and the beam axis are all approximately parallel to , we assume that both dipoles are oriented along and consider only the dependence on this dimension. Each individual crystal induces the magnetic field of a dipole dispersed around its center, . Thus, the effective proximity field increase experienced by the right crystal due to the left crystal is, to the first order, [see Fig. 4(a)]. This is the same as the effective field induced on the left crystal by the right crystal, following symmetry reasons. In addition, the field increase required to reach saturation in each crystal is . Figs. 4(b)-(d) show the calculated fields and as a function of the crystal separation for different values of . For low values of , and do not coincide for any value of [Fig. 4(b)]. This implies that effective saturation cannot be reached as a result of the proximity effect. For higher values of [Figs. 4(c),(d)], and intersect. In particular, for separations smaller than [indicated in Figs. 4(c),(d)] each crystal is effectively saturated, and can thus be regarded as an effective ”saturating” separation. Figure 4(e) shows the field required to reach effective saturation, , versus , as extrapolated from different values of . This can be directly compared to the experimental result in Fig. 3(b). The effective decrease of the saturation field by 20% in adjacent crystals, as well as an exponential decay with the distance, are indeed verified [Fig. 4(e)].
In conclusion, we have studied the polarization dynamics in YIG isolator crystal pairs using a modified balanced detection setup. A proximity effect was observed in which the saturation field is reduced by up to 20% for nearby crystals. The decay rate suggests that this effect originates from magnetostatic interactions between the nearby magnetic moments in the presence of an external field [11], as further supported by 1D magnetostatic calculations. This substantial reduction of the saturation field is potentially useful for the realization of integrated magneto-optical devices [2-6,10], since a lower saturating field would essentially mean lower power consumption.
This research was supported by the Natural Sciences and Engineering Research Council (NSERC) of Canada. Y.L. acknowledges a MELS FQRNT fellowship. We also thank R. Helsten for his invaluable technical assistance.
References
- (1) ”Magnetooptics”, J. F. Dillon, J. Magn. Magn. Mater. 100, 425 (1991).
- (2) ”Lens-free in-line optical isolators”, T. Sato, J. Sun, R. Kasahara, and S. Kawakami, Opt. Lett. 24, 1337 (1999).
- (3) ”Magneto-optical nonreciprocal phase shift in garnet/silicon-on-insulator waveguides”, R. L. Espinola, T. Izuhara, M. C. Tsai, and R. M. Osgood, Opt. Lett. 29, 941 (2004).
- (4) ”Polarization rotation enhancement and scattering mechanisms in waveguide magnetophotonic crystals”, M. Levy and R. Li, Appl. Phys. Lett. 89, 121113 (2006).
- (5) ”Demonstration of quasi-phase-matched nonreciprocal polarization rotation in III-V semiconductor waveguides incorporating magneto-optic upper claddings”, B. M. Holmes and D. C. Hutchings, Appl. Phys. Lett. 88, 061116 (2006).
- (6) ”Magneto-optical isolator with silicon waveguides fabricated by direct bonding”, Y. Shoji, T. Mizumoto, H. Yokoi, I-W. Hsieh, and R. M. Osgood, Appl. Phys. Lett. 92, 071117 (2008).
- (7) ”Magnetic and optical properties of rare earth garnets”, J. F. Dillon, J. Magn. Magn. Mater. 84, 213 (1990).
- (8) ”Magnetic circular dichroism and Faraday rotation spectra of Y3Fe5O12”, G. B. Scott, D. E. Lacklison, H. I. Ralph, and J. L. Page, Phys. Rev. B 12, 2562 (1975).
- (9) S. Huard, Polarization of Light (Wiley, 1997).
- (10) ”Silicon photonics: Lighting up the chip”, A. Mekis, Nat. Photonics 2, 389 (2008).
- (11) ”Magnetostatic interaction in arrays of nanometric permalloy wires: A magneto-optic Kerr effect and a Brillouin light scattering study”, G. Gubbiotti, S. Tacchi, G. Carlotti, P. Vavassori, N. Singh, S. Goolaup, and A. O. Adeyeye, Phys. Rev. B 72, 224413 (2005).