HW Vir’s Companion: a M-type Dwarf, or maybe a giant rotating spherical Mirror?
Abstract
From optical high-resolution spectra the nature of the unseen companion of HW Vir is determined without detection of any spectral features originating from the secondary itself. Using radial velocity measurements from the primary hot subdwarf B star and from weak additional absorption lines detected close to the secondary eclipse, probably caused by reflected light off the surface of the secondary, the mass and radius of the companion is determined. The values are consistent with those of a M type main sequence star.
The University of Texas at Austin, McDonald Observatory, 1 University Station C1402, Austin, TX 78712, USA
1. Introduction
HW Vir () is a well analyzed bright () object. Berger & Fringant (1980) were the first to classify it as a subdwarf B (sdB) star using low resolution spectroscopy. From photometry Menzies (1986) discovered that HW Vir is not a single star but an eclipsing binary with an orbital period of showing a strong reflection effect. Subsequent radial velocity measurements (Menzies & Marang 1986) revealed a first determination of the semi amplitude of for the primary hot subdwarf and a system velocity of , but from their spectra they could not detect any lines due to the secondary. Using photometry Wood, Zang, & Robinson (1993) determined the inclination angle of the system to . Independently, Wood, Zang, & Robinson (1993) as well as Włodarczyk & Olszewski (1994), who used photometry, deduced from their data that the primary star is most likely a M-type dwarf with a mass near . In 1999 Wood & Saffer presented a paper about the analysis of more than two dozen of optical low resolution spectra taken from HW Vir in order to measure not only the orbital parameters of the system (, ) but also to determine the atmospheric parameters of the sdB star. Their results show that the primary is a bona-fide sdB star (, , ) at a distance of pc, and the secondary’s star mass and radius are consistent with those of a M-type dwarf. But they discovered something else, which was previously unknown: from their co-added single spectra they were able to detect a very weak absorption feature close to the line of the primary sdB star, however, only visible close to the secondary eclipse. Because the radial velocity of this line matched very good the value one would expect to find for a M-type dwarf companion, Wood & Saffer (1999) favored the interpretation that this line is a result of an irradiation of the face of the secondary. But they could not elucidate why this line is showing in absorption and not, like expected, in emission. High resolution observations from Hilditch, Harries, & Hill (1996) revealed, like all observations before, no indication of any spectral features from the companion. However, their spectra only covered the wavelength region of 4360-6070 Å.
Here, I present new results from high resolution spectroscopy obtained for HW Vir.
2. Observations and orbital Parameters
A set of high resolution spectra have been obtained on the night of January 30-31, 2006 at the McDonald observatory, West-Texas, USA, with the 2.7 m Harlan J. Smith telescope equipped with the high resolution cross-dispersed echelle spectrometer (cs2). In order to observe one complete cycle () 16 consecutive spectra, with an integration time of 10 minutes each, were obtained. The observing time was chosen to retrieve a reasonable S/N30 on one hand, but on the other hand also to minimize orbital smearing. The spectra cover the wavelength from 3 600 Å to 10 000 Å. The nominal resolution is .
The radial velocities (RVs) for the primary sdB star are determined by calculating the shifts of the measured wavelengths of Hα, Hβ, and He i 5876 Å. To determine the central wavelengths Gaussian curves are fitted to the Balmer line cores and to the helium line. After the measurement the RVs were corrected to heliocentric values. Using the same method described by Edelmann et al. (2005) a period of , a semi amplitude of , and a system velocity of results. Fig. 3 (top pane) shows the best fit RV curve. The orbital results are in very good agreement to the parameters determined by Wood, Zhang, & Robinson (1993): , and Wood & Saffer (1999): , and .
The residuals to the sine fit plotted in Fig. 3 (second panel from the top) indicate that the majority of the RV values are well reproduced by a sinusoidal curve. Only 2 measurements close to phase zero, i.e. the primary eclipse, are off the predicted values. The first value is much too high (i.e. the emitting source is moving away faster), and the second value is much too low (i.e. the emitting source is moving faster towards the observer). Lets assume the sdB star is rotating. Shortly before the total eclipse occurs the hemisphere of the sdB which is moving towards us is covered by the surface of the companion, so the measured RV value is the velocity of the star moving away from us due to the orbital motion plus the velocity of the hemisphere moving away from us due to the rotation. Shortly after the primary eclipse the measured RV value is the velocity of the star moving towards us plus the velocity of the hemisphere moving towards us. The other hemisphere is, again, covered by the companion. This effect is know as the Rossiter-McLaughlin (RM) effect (Rossiter 1924, McLaughlin 924). Detecting an RM effect means the sdB star must rotate significantly, and this should be seen in the observed line profiles (cf. Section 4.). A quantitative investigation to determine the radial velocity using the RM effect is, however, beyond the scope of this proceedings paper. It will be addressed in a subsequent, more detailed paper. The RM effect also has been reported for other eclipsing binaries containing a hot subdwarf star (e.g. AA Dor, Rauch & Werner 2003; NY Vir, Vučović et al. 2007 and this proceedings).
3. Nature of the Companion
The high resolution data obtained show at first sight only single lined spectra of a RV variable sdB star with an invisible companion. However, watching more carefully you can detect, close to the secondary eclipse some sort of ’additional’ very weak absorption lines in the wings of the sdB’s Balmer lines moving in time from the red to the blue hand side (see Fig. 1).
The radial velocities that can be measured from each of those lines in each individual spectra match, i.e. the RV of the line in the wing of match to those of the one in the wing of , and also to those for 111The secondary absorption lines due to are barely above the detection limit. Therefore, these lines are connected and represent very likely a Balmer line series from another object, possibly due to the secondary.
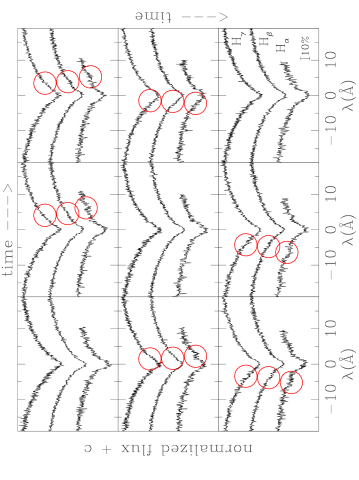
Because you can only see the ’secondary’ Balmer lines close to the secondary eclipse, i.e. the cool companion is covered by sdB star, which in turn also means that in this phase you see most of the surface of the companion illuminated by the hot subdwarf, the lines are possibly due, and solely due, to the heated hemisphere of the companion. However, then, if assuming the star is rotating, our RV measurements cannot be ’directly’ used to determine the RV curve. During quadrature222In quadrature the sdB is moving away (or moving towards us) at the same time as the secondary is moving towards us (or moving away) at maximum speed., i.e. phase=0.25, 0.75, to the observer only one half of the secondary’s sphere is illuminated (an therefore heated). This means that you do not measure the total RV at this phase, but something like the RV minus the rotation of the star. So one can only use the RV values close to the eclipse, when the rotation of the star does not influence the RV measurements, to determine the RV curve. With the fixed period of , and a fixed system velocity of , a results. The measured RV values and the fitted curve to the 2 points close to the secondary eclipse is show in Fig. 3 (dotted line). Using the systems mass function and Kepler’s 3rd law
the mass of the sdB primary, as well as those of the companion, can be calculated to , and .
The results are very promising, because not only the mass of the sdB is close to its canonical mass, like the majority of all measured sdB masses are, but also the mass of the companion is in perfect agreement with the results from the photometric observations (e.g. Wood, Zang, & Robinson 1993, Włodarczyk & Olszewski 1994).
The difference between the maximum (minimum) value of the secondary’s RV curve and the measured RV value of the lines close to the quadrature phase is about . As described above, this is also roughly the rotational velocity of the companion. Assuming a bound rotation of the secondary it is also possible to estimate the radius of the companion to . This very rough estimation is in agreement with the results from the photometric work of Wood, Zang, & Robinson (1993, ), and Włodarczyk & Olszewski (1994 ). The mass and radius determined for HW Vir’s companion is also consistent with theoretical models for low-mass dwarf stars from Dorman et al (1989): a star should have a radius of . The companion, therefore, is a M type dwarf.
4. Atmospheric Parameters of the sdB Star
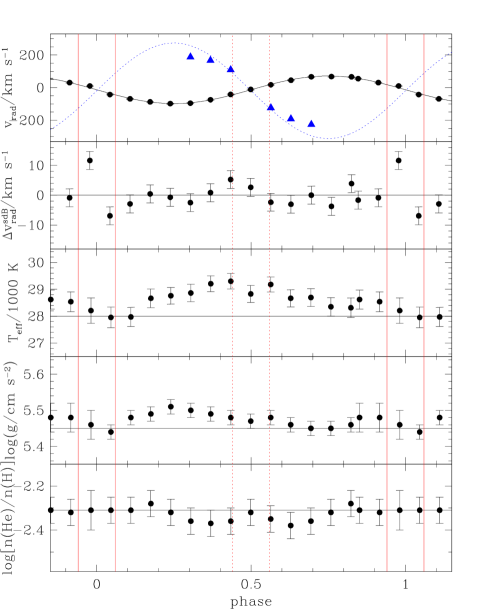
Second panel from the top: Residuals for the sdB primary () to the sine fit including error bars. Note the ’outliers’ during the primary eclipse (start and end are marked by the vertical solid lines) which are due to the Rossiter-McLaughlin effect (see text).
Also plotted are the determined effective temperature (center panel), surface gravity (second panel from the bottom), and helium abundance (bottom panel) for all individual spectra including error bars.
The vertical dotted lines mark the start and end of the secondary eclipse.
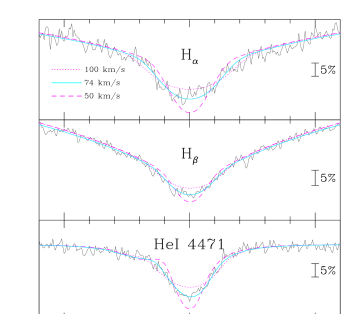
The stellar atmospheric parameters are determined for all individual normalized (the continuum was set to unity) spectra using a fit method (Napiwotzki, Green, & Saffer 1999) and NLTE model atmospheres from Napiwotzki (1997). In this fit procedure I also included the projected rotational velocity as an additional parameter, because the spectral lines show clear indications of rotational broadening (cfg. Section 2., RM-effect). The resulting effective temperature, surface gravity, and helium abundance for every spectrum are shown in Fig. 3. A projected rotational velocity of ( error) results (see Fig. 2). At first sight the results looks like one would expect from a star in a binary showing a tidal deformation. However, the phase does not match to this image. Also the trend of the effective temperature during the secondary eclipse makes no sense. Why should the temperature suddenly drop about 500 K when the cool companion is, in the line of sight, behind the hot subdwarf?
The developing of the temperature curve reminds someone extremely to the developing of the light curves measured for HW Vir e.g. by Wood, Zhang, & Robinson (1993, Fig. 2). After the primary eclipse the flux is increasing because the visible illuminated surface of the companion is getting bigger and bigger, and more and more light is reflected towards the observer, until the secondary eclipse occurs. During the secondary eclipse the flux suddenly drops because the sdB star covers the illuminated (reflecting) surface of the cool companion. And after the secondary eclipse the flux is again decreasing, because the less and less light is reflected from the surface of the secondary to the observer because the illuminated surface is getting smaller and smaller. The same trend can be seen in the measured temperature curve in Fig. 3. After the primary eclipse increases until the secondary eclipse happens. Here it suddenly drops, and after the eclipse decreases again until the primary eclipse takes place. Therefore, the determined atmospheric parameters are possibly influenced by the reflected light.
To test this theory, I calculated one NLTE model spectrum using the atmospheric parameters derived from the fits close to the primary eclipse: K, , and (cfg. Fig. 3, horizontal lines in the lower 3 panels), because this parameters are least influenced by any reflected light (cfg Fig. 4, left hand panel).
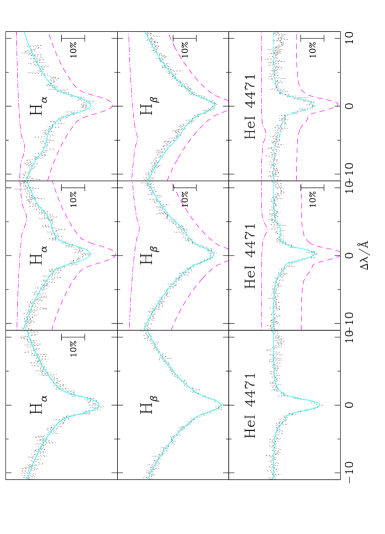
Fig. 4 (center and right hand panel) exemplarily shows for two observed spectra close to the secondary eclipse that the observed line profiles can be matched simply by using the sum of 2 of such identical model spectra only shifted to the corresponding RV values of the sdB and the M dwarf, and convolved by a constant factor (the sum of both factors need to be one, because all spectra have been normalized to unity), respectively. Also all other spectra can be matched using the same method.
I conclude that the varying parameters shown in Fig. 3 are not caused by a tidal deformation of the sdB, but are only due to reflected light from the surface of the secondary.
5. Summary
A set of 16 consecutive optical high-resolution spectra have been obtained to search for a spectral feature from the (so far unseen) companion of HW Vir. Close to the secondary eclipse a series of additional weak Balmer absorption lines can be seen probably due to the heated hemisphere of the secondary. The secondary’s mass of and radius of is consistent with a M type main sequence star. The mass of the primary sdB star could be measured to . The radial velocity measurements of the sdB star show clear indication of a Rossiter-McLaughlin effect. The projected rotational velocity of the sdB star is measured from the observed line profiles to . The additional weak Balmer absorption lines as well as varying atmospheric parameters determined from -fits of the individual spectra are probably due to reflected light on the surface of the cool M type dwarf originating from the hot subdwarf itself.
Acknowledgments.
I would like to thank J. Tomkin, L. Koesterke, S. Ness -linger, U. Heber, and S. Geier for lots of fruitful discussions. I appreciate the help, support, and valuable assistance provided by David Doss at the McDonald observatory, during my visit.
References
- Berger & Fringant (1980) Berger J., & Fringant A.-M., 1980, A&A 85, 367
- Dorman, Nelson & Chau (1989) Dorman B., Nelson L. A., & Chau W. Y., 1989, ApJ 342, 1003
- Edelmann et al. (2005) Edelmann, H., Heber U., Altmann M., Karl C., & Lisker T., 2005, A&A 442, 1023
- Hilditch, Harries & Hill (1996) Hilditch R. W., Harries T. J., & Hill G., 1996, MNRAS 279, 1380
- McLaughlin (924) McLaughlin D. B., 1924, ApJ 60, 22
- Menzies (1986) Menzies J. W., 1986, An. Rep. S. Afr. Astron. Obs., p. 20
- Menzies & Marang (1986) Menzies J. W., & Marang F., 1986, IAUS 118, 305
- Napiwotzki (1997) Napiwotzki R., 1997, A&A 322, 256
- Napiwotzki, Green & Saffer (1999) Napiwotzki R., Green P. J., & Saffer R. A., 1999, ApJ 517, 399
- Rauch & Werner (2003) Rauch T., & Werner K., 2003, A&A 400, 271
- Rossiter (1924) Rossiter R. A., 1924, ApJ 60, 15
- Vučović et al. (2007) Vučović M., Aerts C., Østensen R., Nelemans G., Hu H., Jeffery C. S., Dhillon V. S., & Marsh T. R., 2007, A&A 471, 605
- Włodarczyk & Olszewski P. (1994) Włodarczyk K., & Olszewski P., 1994, Acta Astronomica, v. 44, p. 407
- Wood, Zhang & Robinson (1993) Wood J. H., Zhang E.-H., & Robinson E. L., 1993, MNRAS 261, 103
- Wood & Saffer (1999) Wood, J. H., & Saffer R., 1999, MNRAS 305, 820