The Spitzer View of Low-Metallicity Star Formation: II. Mrk 996, a Blue Compact Dwarf Galaxy with an Extremely Dense Nucleus
Abstract
We present new Spitzer, UKIRT and MMT observations of the blue compact dwarf galaxy (BCD) Mrk 996, with an oxygen abundance of 12log(O/H) = 8.0. This galaxy has the peculiarity of possessing an extraordinarily dense nuclear star-forming region, with a central density of 106 cm-3. The nuclear region of Mrk 996 is characterized by several unusual properties: a very red color = 1.8, broad and narrow emission-line components, and ionizing radiation as hard as 54.9 eV, as implied by the presence of the [O iv] 25.89 µm line. The nucleus is located within an exponential disk with colors consistent with a single stellar population of age 1 Gyr. The infrared morphology of Mrk 996 changes with wavelength. IRAC 4.5 µm images show extended stellar photospheric emission from the body of the galaxy, and an extremely red nuclear point source, indicative of hot dust; IRAC 8 µm images show extended PAH emission from the surrounding ISM and a bright nucleus; MIPS 24 and 70 images consist of bright point sources associated with the warm nuclear dust; and 160 µm images map the cooler extended dust associated with older stellar populations. The IRS spectrum shows strong narrow Polycyclic Aromatic Hydrocarbon (PAH) emission, with narrow line widths and equivalent widths that are high for the metallicity of Mrk 996. Gaseous nebular fine-structure lines are also seen. A CLOUDY model which accounts for both the optical and mid-infrared (MIR) lines requires that they originate in two distinct H ii regions: a very dense H ii region of radius 580 pc with densities declining from 106 at the center to a few hundreds cm-3 at the outer radius, where most of the optical lines arise; and a H ii region with a density of 300 cm-3 that is hidden in the optical but seen in the MIR. We suggest that the infrared lines arise mainly in the optically obscured H ii region while they are strongly suppressed by collisional deexcitation in the optically visible one. The hard ionizing radiation needed to account for the [O iv] 25.89 µm line is most likely due to fast radiative shocks propagating in an interstellar medium. A hidden population of Wolf-Rayet stars of type WNE-w or a hidden AGN as sources of hard ionizing radiation are less likely possibilities.
1 Introduction
Among blue compact dwarf galaxies (BCDs), the dwarf emission-line galaxy Mrk 996 ( = ) occupies a place apart because of the extreme electron density at the center of its star-forming region. HST and images show that the bulk of the star formation occurs in a compact roughly circular high surface brightness nuclear region of radius 340 pc, with evident dust patches to the north of it (Thuan et al., 1996). The nucleus (n) is located within an elliptically (E) shaped low surface brightness (LSB) component, so that Mrk 996 belongs to the relatively rare class of nE BCDs (Loose & Thuan, 1985). The extended envelope shows a distinct asymmetry, being more extended to the northeast side than to the southwest side, perhaps the sign of a past merger. This asymmetry is also seen in the spatial distribution of the globular clusters around Mrk 996, these being seen mainly to the south of the galaxy.
Mrk 996 has a heliocentric radial velocity of 1622 km s-1 which gives it a distance of 21.7 Mpc, adopting a Hubble constant of 75 km s-1 Mpc-2 and including a very small correction for the Virgocentric flow (Thuan et al., 1999). At the adopted distance, 1 arcsec corresponds to a linear size of 105 pc. Thuan et al. (1996) found the extended LSB component to possess an exponential disk structure with a small scale length of 0.42 kpc. While Mrk 996 does not show an obvious spiral structure in the disk, there is a spiral-like pattern in the nuclear star-forming region, which is no larger than 160 pc in radius.
The UV and optical spectra of the nuclear star-forming region of Mrk 996 (Izotov et al., 1992; Thuan et al., 1996) show remarkable features, suggesting very unusual physical conditions. The He i line intensities are some 2 – 4 times larger than those in normal BCDs. In the UV range, the N iii] 1750 and C iii] 1909 are particularly intense. Moreover, the line width depends on the degree of ionization of the ion. Thus low-ionization emission lines such as O+, S+ and N+ have narrow widths, similar to those in other H ii regions, while high-ionization emission lines such as the helium lines, the O++ and Ne++ nebular lines and all auroral lines, show very broad line widths, 500 km s-1. Such correlations of line widths with the degree of excitation suggest different ionization zones with very distinct kinematical properties. Thuan et al. (1996) found that the usual one-zone low-density ionization-bounded H ii region model cannot be applied to the nuclear star-forming region of Mrk 996 without leading to unrealistic helium and heavy-element abundances. Instead, they showed that a two-zone density-bounded H ii region model, including an inner compact region with a central density of 106 cm-3, some 4 orders of magnitude greater than the densities of normal H ii regions, together with an outer region with a lower density of 450 cm-3, comparable to those of other H ii regions, is needed to account for the observed line intensities. The large density gradient is probably caused by a mass outflow driven by the large population of Wolf-Rayet stars present in the galaxy. The gas outflow motions may account for the much broader line widths of the high-ionization lines originating in the dense inner region as compared to the low-ionization lines which originate in the less dense outer region. As for the high N iii] 1750, C iii] 1909 and He i line intensities, they can be understood by collisional excitation of these lines in the high density region. In the context of this model, the oxygen abundance of Mrk 996 is 12+log(O/H) = 8.0. Adopting 12+log(O/H) = 8.65 for the Sun (Asplund et al., 2005), then Mrk 996 has a metallicity of 0.22 solar. Mrk 996 shows enhanced helium and nitrogen abundances, which can be accounted for by local pollution from Wolf-Rayet stars.
We present in this paper Spitzer (Werner et al., 2004) mid-infrared (MIR) observations of Mrk 996. The extraordinary UV and optical properties of this galaxy, along with the evident presence of dust patches in the star-forming region of Mrk 996 on HST optical images, make it a prime candidate for our Cycle 1 (PID 3139: P.I. Thuan) Spitzer observations. Our entire program consists of spectroscopic, photometric and imaging observations of 23 BCDs with metallicities ranging from 1/20 to 1/2 that of the Sun, and its main aim is to study star formation in metal-poor environments and to understand how star formation and dust properties change as a function of metallicity and other physical parameters. This paper is the second of our Spitzer series, the first paper being on Haro 3, the most metal-rich BCD in our sample (Hunt et al., 2006).
We present in §2 our Spitzer IRAC, MIPS and IRS observations of Mrk 996 and their reduction. We discuss in §3 new complementary UKIRT near-infrared (NIR) imaging observations and optical MMT spectroscopic observations. In §4, we discuss our imaging results: the IR morphology of the disk of old stars, and the nature of the very red, bright and dense nuclear IR source in Mrk 996. We also discuss the extended PAH emission. In §5, we present our spectroscopic results: the PAH features and the IR fine-structure lines. In §6, we use the CLOUDY photoionization code (Ferland, 1996; Ferland et al., 1998) to model the observed optical and IR emission-line intensities. We show that it is necessary to postulate two H ii regions: one which is optically visible where the optical lines arise, and one which is optically hidden where the main part of the IR line emission arises. We then discuss possible sources of hard ionizing radiation – fast shocks, WNE-w stars or an AGN – to account for the presence of the [O iv] 25.9m, line. We summarize our conclusions in §7.
2 Spitzer Observations
In the context of our guest-observer program, we acquired Spitzer observations of Mrk 996: IRAC images (Fazio et al., 2004) at 4.5 and 8 µm, MIPS photometry (Rieke et al., 2004) at 24, 70 and 160 µm and low- and high-resolution IRS spectra (Houck et al., 2004). The data were obtained during the period from 16 December, 2004 to 3 January, 2005. As the data reduction procedures have been described in detail in Paper I (Hunt et al., 2006), we give here only a summary.
2.1 IRAC Imaging
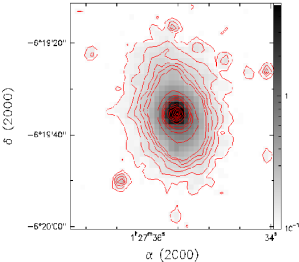
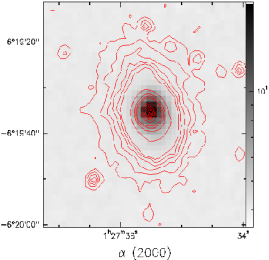
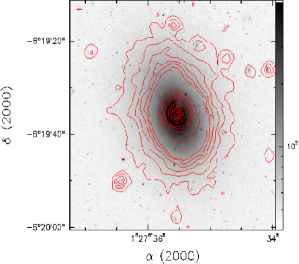
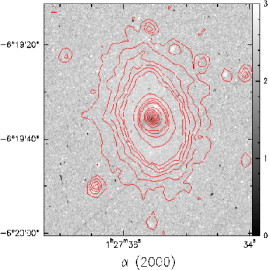
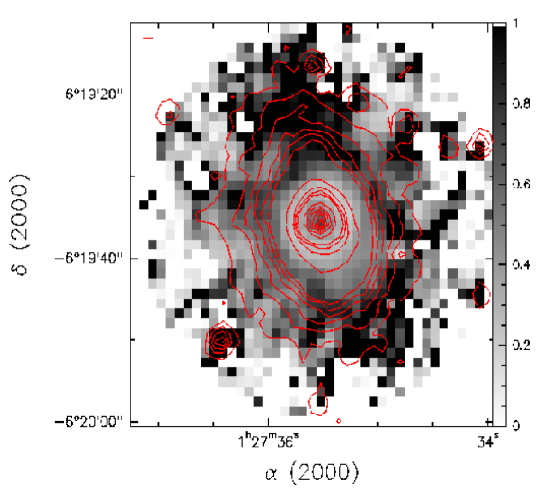
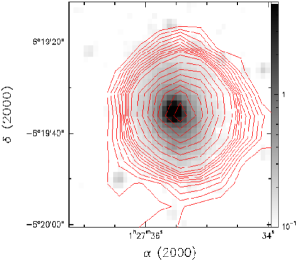
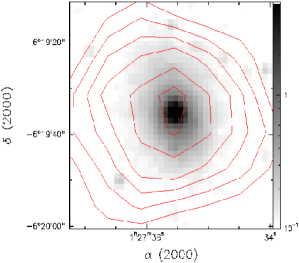
We acquired four IRAC frames, with small-scale dithering in a cycling pattern, giving a total of 120s spent in each of the 4.5 and 8.0 µm channels. The individual bcd frames were processed with the S11.0.1 version of the SSC pipeline which removes the effects of dark current, detector nonlinearity, flat field, multiplexer bleeding, and cosmic rays, and performs flux calibration. The bcd frames were then coadded using MOPEX, the image mosaicing and source-extraction package provided by the SSC (Makovoz & Marleau, 2005). The frames were corrected for geometrical distortion and projected onto a fiducial coordinate system with pixel sizes of 120, roughly equivalent to the original pixels. Standard linear interpolation was used for the mosaics. The final coadded 4.5 and 8.0 µm images are shown respectively in the left and right panels of Fig. 1. Fig. 2 shows 4.5 µm contours superimposed on the HST/WFPC2 F791W optical image of Thuan et al. (1996) (left panel) and on the HST 569W - F791W color image from the same authors (right panel). In Fig. 3, we show the 4.5/8.0µm flux ratio image on which have been overlayed the surface brightness level contours of the 4.5µm image. To construct the flux ratio image, the two IRAC images have been aligned by cross-correlation after sky subtraction.
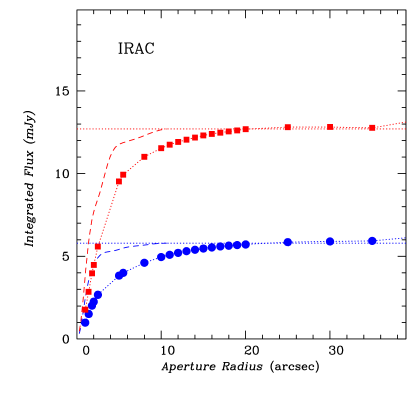
We have performed aperture photometry on the IRAC images with the IRAF111IRAF is distributed by National Optical Astronomy Observatory, which is operated by the Association of Universities for Research in Astronomy, Inc., under cooperative agreement with the National Science Foundation. photometry package APPHOT, taking care to convert the MJy/sr flux units of the images to integrated flux. The background level was determined by averaging several adjacent empty sky regions. We give the growth curve for both IRAC images (filled circles for the 4.5µm image and filled squares for the 8.0µm image) in the left panel of Fig. 4. We have also made photometric measurements of the instrument point response functions (PRFs), provided in the MOPEX package; the dashed lines show the growth curve expected from a point source, normalized to the total flux indicated by horizontal dotted lines in Fig. 4. The 4.5 µm and 8.0 µm total fluxes are listed in Table 1.
We have derived radial surface brightness profiles by fitting ellipses to both IRAC images. The ellipse centers were held fixed, but the ellipse shape and orientation was allowed to vary with radius. The surface brightnesses were put on the Vega magnitude scale by using the photometric calibration of Reach et al. (2005). Figure 5 (left panel) shows the radial profiles in units of [4.5] and [8.0] magnitudes. The average disk color of 1.5 corresponds to a flux ratio 4.5/8.0 of 0.7. The red circumnuclear maximum in the lower panel at a radius of 4″ is an artifact due to the different IRAC point-response functions at the two wavelengths. This effect can also be seen in Fig. 3 where the crowding of the 4.5 µm contours from the point source coincides with a relatively low 4.5/8 flux ratio.
2.2 MIPS Imaging
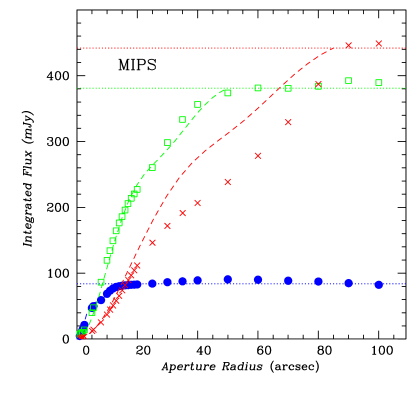
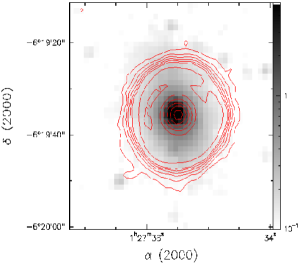
We have obtained for Mrk 996 a total of 24 frames at 24µm, 56 frames at 70µm, and 104 frames at 160µm, using ramp times of 3s, 10s, and 10s respectively, with 1, 2, and 6 cycles in the three channels. The individual bcd frames were processed by the S11.4.0 version of the SSC pipeline, which includes dark current subtraction, flat-fielding, and flux calibration. As for the IRAC images, we processed the dithered bcd frames in the spatial domain with MOPEX. Geometrical distortion was corrected before projecting the frames onto a fiducial coordinate system with pixel sizes of 12 for MIPS-24, roughly half of the original pixel size of 25. Pixel sizes of the final mosaics at 70 and 160µm are also approximately half of the originals, i.e. 495 at 70µm and 80 at 160µm. Unlike the IRAC coadds, we incorporated the sigma-weighting algorithm because we found it gave less noisy MIPS mosaics than without. Standard linear interpolation was used in all cases. In all three channels, our post-pipeline MOPEX mosaics are superior to those provided by the automated post-pipeline reduction. The final coadded images are shown in Fig. 6 as contours superimposed on the IRAC 4.5 µm image. We have performed aperture photometry on the MIPS images in the same way as on the IRAC images. The growth curves for the three bands (filled circles for the 24 µm band, open squares for the 70 µm band and crosses for 160 µm band) are given in the right panel of Fig. 4. The dashed lines represent the point-response function in each band. The 24 µm, 70 µm and 160 µm total fluxes are listed in Table 1.
2.3 IRS Spectra
Spectroscopy was performed in the staring mode with the Short Low module in both orders (SL1, SL2) and with both Short and Long High-resolution modules (SH, LH). The data consist of low-resolution spectra with a wavelength range from 5.2 to 14.5 µm and a spectral resolution of 64-128, and of high-resolution spectra with a wavelength range from 9.6 to 37.2 µm and a spectral resolution of 600. Total integration times of 30s4 cycles were obtained for SH, 14s8 for LH, 6s6 for SL1, and 6s6 for SL2. The central region of Mrk 996 was centered in the slits by peaking up on a nearby 2MASS star. Individual bcd frames have been processed by the S13.2.0 version of the SSC pipeline, which provides ramp fitting, dark current subtraction, droop and linearity corrections, flat-fielding, and wavelength and flux calibrations222See the IRS Data Handbook, http://ssc.spitzer.caltech.edu/irs/dh..
However, the pipeline does not include background subtraction. Hence, for the low-resolution spectra, we constructed a coadded background frame from the bcd observations with the source in the opposing nod and off-order positions (see also Weedman et al., 2005). For the high-resolution SH and LH spectra, a 2D background image could not be constructed because of the small size of the slit. Therefore we subtracted the background from the SH and LH observations using the one-dimensional (1D) spectra. The level of the background was determined by minimizing the difference between the SL and SHLH spectra over their overlap region (1 µm), and the shape of the background was given by Spot.
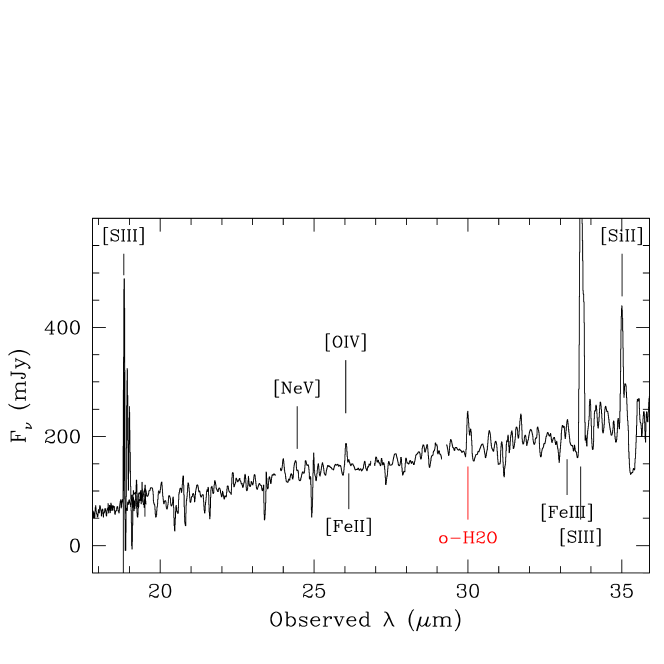
We extracted the source spectra with SPICE, the post-pipeline IRS package provided by the SSC. To maximize the calibration accuracy, the automatic point-source extraction window was used for all modules. For the SL spectra, this gives a 4-pixel (72) length at 6 µm, and an 8-pixel one (144) at 12 µm; the slit width is 36 for both SL modules. At high resolution, the SPICE extraction is performed over the entire slit (47113 SH; 111223 LH). The individual spectra were then box-car smoothed to a resolution element, and clipped in order to eliminate any remaining spikes in the high-resolution data. The spectra were also examined for bad pixel removal. Finally, the two spectra for each module (one for each nod position) were averaged. The final averaged IRS spectra obtained in the short-wavelength low-resolution mode (SL) and in both short and long wavelength high-resolution modes (SH, LH) are shown in Fig. 7. A blow-up of the spectral region around the [O iv] line is shown in Fig. 8.
3 Complementary Observations
3.1 UKIRT Imaging
We have also acquired (1.2 µm), (1.6 µm), and (2.2 µm) images of Mrk 996, with the 3.8 m UKIRT1 equipped with IRCAM3 as part of our ongoing project of NIR imaging and spectroscopy of BCDs. The IRCAM3 plate scale is 028 pixel-1, with a total field of view of 720 720. Source and empty sky positions were alternated, beginning and ending each observing sequence with a sky position. Before the beginning of each sequence, dark exposures were acquired with the same parameters as the subsequent science frames. Total on-source integration times were 1040s in , 480s in , and 240s in . Individual frames were first dark-subtracted and then flat-fielded with the average of adjacent empty sky frames, after editing them for stars (to avoid“holes” in the reduced frames) and applying an average clipping algorithm. The reduced frames were then aligned and averaged. All data reduction was carried out in the IRAF environment.
Photometric calibration was performed by observing standard stars from the UKIRT Faint Standard List (Hawarden et al., 2001) before and after the source observations. Each standard star was measured in several different positions on the array and flat-fielded by dividing the clipped mean of the remaining frames in the sequence. To correct the standard-star photometry for atmospheric extinction, we used the UKIRT mean extinction coefficients of 0.102, 0.059, and 0.088 mag per air mass for , , and , respectively. Formal photometric accuracy, as measured by the dispersion in the standard-star magnitudes, is 0.025 mag in and and 0.04 mag in . Color images were derived by registering the images to a few tenths of a pixel with a cross-correlation algorithm, then subtracting the magnitude images.
As for IRAC, we have fitted ellipses to the , and images of Mrk 996, and , , and elliptically-averaged radial profiles have been derived. The surface brightness profile, which reaches a limiting surface brightness of 24 mag arcsec-2, is shown in the top right panel of Fig. 5. The lower three panels show the , and radial color profiles, constructed from the , and surface brightness profiles. In the last three panels, the dotted line indicates the average color of the underlying disk.
3.2 MMT Optical Observations
As the optical spectra (Thuan et al., 1996) have somewhat low spectral resolution ( 6Å in the blue or 350 km s-1), higher resolution optical spectra are needed to allow for a deconvolution of the line profiles into narrow and broad components and better study the gas motions in the inner and outer regions. A new high signal-to-noise ratio optical spectrum of Mrk 996 was obtained with the 6.5 m MMT on the night of 2006 December 15. Observations were made with the Blue Channel of the MMT spectrograph. We used a 15180″ slit and a 800 grooves/mm grating in first order. The above instrumental set-up gave a spatial scale along the slit of 06 pixel-1, a scale perpendicular to the slit of 0.75Å pixel-1, a spectral range 3200 – 5000Å and a spectral resolution of 3Å (FWHM). The slit was oriented along the parallactic angle and the total exposure time was 25 minutes. The observations were broken up into 3 subexposures to avoid saturation of the brightest lines. The seeing was about 08. The Kitt Peak IRS spectroscopic standard stars Feige 110 and G191B2B were observed for flux calibration. Spectra of He-Ar comparison arcs were obtained after the observations to calibrate the wavelength scale.
The data reduction procedures are the same as described in Thuan & Izotov (2005). The two-dimensional spectra were bias subtracted and flat-field corrected using IRAF. We then use the IRAF software routines IDENTIFY, REIDENTIFY, FITCOORD, TRANSFORM to perform wavelength calibration and correct for distortion and tilt for each frame. Night sky subtraction was performed using the routine BACKGROUND. The level of night sky emission was determined from the closest regions to the galaxy that are free of galaxian stellar and nebular line emission, as well as of emission from foreground and background sources. A one-dimensional spectrum was then extracted from the two-dimensional frame using the APALL routine. Before extraction, the three distinct two-dimensional spectra of Mrk 996 were carefully aligned using the spatial locations of the brightest part in each spectrum, so that spectra were extracted at the same positions in all subexposures. We then summed the individual spectra from each subexposure after manual removal of the cosmic rays hits. The spectra obtained from each subexposure were also checked for cosmic rays hits at the location of strong emission lines, but none were found.
Particular attention was paid to the derivation of the sensitivity curve. It was obtained by fitting with a high-order polynomial the observed spectral energy distribution of the two standard stars. Because the spectra of these stars have only a small number of a relatively weak absorption features, their spectral energy distributions are known with good accuracy ( 1%). Moreover, the response function of the CCD detector is smooth, so we could derive a sensitivity curve with an accuracy better than 1% over the whole blue optical range.
The resulting spectrum of Mrk 996 is shown in Fig. 9. The spectrum is very rich in emission lines, which we have identified and labeled. Because of its higher spectral resolution and signal-to-noise ratio, the MMT spectrum shows many more weak emission lines than the HST spectrum, confirming, strenthening and extending many of the findings of Thuan et al. (1996): 1) the He i line intensities such as that of the He i 4471 emission line are unusually large. There are many weak He i lines that are not ordinarily seen such as the 3820, 4121, 4143 and 4388 lines; 2) the widths of the emission lines of high-ionization stages are broader than those of low-ionization stages; 3) there are strong, broad Wolf-Rayet bumps at 4640 and 4686, suggesting the presence of a large WN stellar population. Thuan et al. (1996) have also detected a C iv WR bump at 5808, indicative of WC stars. In addition, the spectrum shows the presence of numerous weak [Fe ii] and [Fe iii] lines. The spectrum goes far into the blue, which allows us to check for the presence of the [Ne v] 3426 line, an indicator of hard ionizing radiation since its ionization potential is 7.1 Rydberg. It is not seen. The [Fe v] 4227 with an ionization potential of 4 Rydberg is also absent. The He ii 4686, also with an ionization potential of 4 Rydberg, is seen but its broad width suggests that it originates in stellar winds of WR stars, not from the ionized interstellar gas. The Balmer jump, clearly seen at 3646, is useful for determining the temperature of the H+ zone (Guseva, Izotov & Thuan, 2006).
The observed line fluxes () normalized to () and multiplied by 100 and their errors, are given in Table 2. They were measured using the IRAF SPLOT routine. The line flux errors listed include statistical errors derived with SPLOT from non flux-calibrated spectra, in addition to errors introduced in the standard star absolute flux calibration. Since the differences between the response curves derived for the two standard stars are not greater than 1%, we set the errors in flux calibration to 1% of the line fluxes. The line fluxes were corrected for both reddening (Whitford, 1958) and underlying hydrogen stellar absorption derived simultaneously by an iterative procedure as described in Izotov, Thuan & Lipovetsky (1994). The corrected line fluxes 100 ()/() and equivalent widths EW() are also given in Table 2.
Comparison of the relative line intensities given in Table 2 with those measured by Thuan et al. (1996) shows general good agreement. The largest deviation concerns the [O ii] 3727 line which is about 1.5 times larger. We attribute this difference to an aperture effect: the HST aperture is circular with a diameter of 086 while the MMT slit width is 15. Since the low-ionization ions are produced in the outer less dense regions, a larger aperture would have a larger [O ii] to ratio.
4 Imaging Results: The Infrared Morphology of Mrk 996
We now use the UKIRT near-infrared and the Spitzer IRAC and MIPS mid-infrared imaging data to study the origin of the infrared emission in Mrk 996.
4.1 An exponential disk of 1 Gyr old stars
The top left and right panels of Fig. 5 show respectively the IRAC and -band surface brightness profiles of Mrk 996, which are very similar to the and profiles given by Thuan et al. (1996). In the radius range 4″, they can be fit by an exponential law of the form = 17.1 + 0.29 (″), = 16.7 + 0.25 (″), corresponding to scale lengths 0.4 kpc, similar to the and scale lengths. This means that for 4″, there is no color gradient, and hence no stellar population change in the underlying extended low surface brightness component. This is also consistent with the constant (= 0.80) (Thuan et al., 1996), (=0.57) and (=0.14) colors observed for 4″ (panels 2 and 3 of Fig.5). These colors have been corrected for Galactic extinction =0.146 mag (Schlegel et al., 1998) with the Cardelli et al. (1989) interstellar extinction curve.
The colors correspond to a coeval stellar population formed about 1 Gyr ago according to the models of Vázquez & Leitherer (2005). This age is fairly well constrained by the models for the optical colors, but in the NIR, models are still unable to completely predict broadband colors for intermediate-age stellar populations at sub-solar metallicities (e.g., Origlia et al., 1999; Mouhcine & Lançon, 2002; Vázquez & Leitherer, 2005). The influence of red supergiants and asymptotic giant branch stars at ages of 1 Gyr increase with decreasing metallicities, and predicted NIR colors tend to be too blue in and too red in as compared to the observed ones. In any case, the observed NIR colors are clearly not those of old stellar populations in spiral disks, dominated by low-mass giants (e.g., de Jong, 1996; Peletier & Balcells, 1997; Hunt et al., 1997). The oldest stars are probably older than 1 Gyr as the star formation in Mrk 996 is likely more spread out in time as compared to the instantaneous star formation models we have used.
4.2 A very red nucleus
Just like the and surface brightness profiles (Thuan et al., 1996), the profile shows a very steep gradient toward the nucleus. While the profile becomes rather blue, in the near-infrared the striking feature of the nuclear region is its extremely red color, equal to 1.8, as compared to the color of the disk equal only to 0.7. Examination of the lower right panels of Fig. 5 shows that the redness of the nuclear region comes mainly from its color (equal to 1.0 as compared to the = 0.1 of the disk), and less from its color. The red colors cannot be produced by gaseous emission as pure gaseous colors are = 0.0 and = 0.6 (Hunt, Thuan, & Izotov, 2003). The redness is more important at longer wavelengths, suggesting that it may be caused by a very hot dust component in the nucleus of Mrk 996, similar to, although more extreme than, other star-forming galaxies (Hunt et al., 2002).
Since the brightness gradient toward the nucleus is very steep, we have checked whether variable seeing for different exposures can be responsible for the very red colors observed. We found that the red color of 2 shown in the color profile is slightly enhanced because of the better seeing in the band image than in the band image. However, the very red color cannot be attributed to seeing effects. The seeing was 09 (FWHM) during the band observations, and 08 in the band observations. We have convolved the -band image to the -band seeing, and produced a new color image. The nuclear color in this new image is 1.0, just as in the profile shown in Fig. 5. We have also checked the color. The registration process necessary to align the images already degrades the band image to the seeing of the -band image of 10. The resulting nuclear color is 0.8. Thus, the nuclear colors are still very red after correction for seeing effects: = 1.0, and = 0.8.
Fig. 10 shows in a (, ) diagram, as filled rectangles connected by a dotted line and from right to left, the colors of the nucleus, of a circumnuclear location, and of a disk location in Mrk 996, together with those of IR-bright starburst galaxies (Hunt et al., 2002) (open stars), of selected BCDs (asterisks) including NGC 5253, SBS 0335–052 (Hunt et al., 2002), and Haro 3 (Johnson et al., 2004), and of Seyfert galaxies (filled circles) (Alonso-Herrero et al., 2001). We have also shown in Fig. 10 mixing curves that illustrate how adding various physical components to the stellar component modify the colors of the disk of Mrk 996, corrected for the K effect and Galactic extinction. The five solid lines from top to bottom show respectively the effects of dust extinction, of a hot dust component at 600 K and 1000 K, of free-free gas emission and of an A-star population. It can be seen that the colors of the disk of Mrk 996 are similar to the colors of other BCDs, and slightly bluer than those of normal (metal-rich) starbursts, but that the color of the nucleus of Mrk 996 is considerably redder. While other BCDs show a clear contribution from ionized gas, the colors of Mrk 996 show a significant component of hot dust, with a dust temperature between 600 and 1000 K.
What is the appearance of the nucleus at longer wavelengths? Examination of the MIPS images (Fig. 6) shows that it is clearly detected at 24, 70 and 160 µm. The emission at 24 and 70 µm is virtually point-like, as shown by the characteristic Airy rings seen in the top two panels of Fig. 6, and from the growth curves in Fig. 4. However, the emission at 160 µm appears to be more extended, as is also evident from its growth curve, suggesting a significant contribution from the galaxy disk.
4.3 The circumnuclear PAH emission
Examination of Fig. 1 and of the growth curves shows that both the 4.5 and 8.0 µm emissions are more extended than that of a point source. While the 8 µm emission comes mainly from the nuclear and inner-disk regions (out to a radius of 10″ or 1.1 kpc), the 4.5 µm image shows extended emission out to a radius of 20″ or 2.2 kpc, comparable in extent to the optical light (see the left panel of Fig.2). Because of the relative lack of 8 µm emission in the outer disk, the flux ratio map (Fig.3) is very noisy there. Examination of the right panel Fig.2 shows that the 4.5µm peak coincides with the bright blue star-forming nucleus of Mrk 996 rather than with the red dust patch to the northwest (see Fig. 4a of Thuan et al., 1996). This suggests that the MIR emission is mainly associated with the source responsible for the very red nuclear color. Fig. 3 shows that the 4.5/8 flux ratio is relatively constant (0.7) outside the nuclear region (see §2.1), although beyond 18″, the color map becomes too noisy to give reliable colors. This can also be seen in the lower left panel of Fig. 5 where, for radii larger than 6″, the radial color profile shows a relatively constant [4.5][8.0] color of 1.5, corresponding to a 4.5/8 flux ratio of 0.7. The apparent gradient in the circumnuclear region at the radius of 4″ is due to the mismatch of the diffraction-limited IRAC point-response functions at 4.5 m and 8 m. Because the 4.5/8 color of stellar populations is , roughly independently of age and metallicity (Leitherer et al., 1999), it is clear that the infrared emission of Mrk 996 is dominated by the ISM, and not by stars.
If we interpret the 8 µm emission in the usual way and attribute it primarily to PAHs, then the 4.5/8 ratio 0.7 implies a contribution from PAHs in the ISM around the nuclear star-forming region of Mrk 996. This interpretation is indeed supported by the detection of strong PAH features in the IRS spectrum discussed in the next section. These PAHs are probably located in the outer low-density region with 400 pc 1000 pc, since they are likely destroyed by the strong UV radiation field in the nuclear region. However, our observations do not have sufficient spatial resolution to verify this.
5 Spectroscopic results
5.1 PAH features
The IRS spectra (Fig. 7) show clearly PAH features at 5.7, 6.2, 7.7, 8.6, 11.2 and 12.8 µm. The flux, the equivalent width EW and the full width at half maximum FWHM of each PAH feature have been derived by fitting Lorentzian profiles (Gaussian profiles do not give good fits) with the SPLOT task in IRAF. They are given in Table 3. The continuum was linearly interpolated in two sections, one from 6-9 µm, and the other from 10.5-13.9 µm. Standard deviations of repeated measurements are given in parentheses. The relative strengths of the three main PAH emission features can be used as diagnostics to identify PAH sizes and infer the neutral-to-ionized gas ratio (Draine & Li, 2001). According to the models of Draine & Li (2001), the observed PAH flux ratios equal to 0.40 and equal to 0.27 indicate that the PAHs in Mrk 996 are predominantly neutral and small, containing a few hundred carbon atoms, similar to the normal galaxies studied by Helou et al. (2000). In other words, just as Haro 3, Mrk 996 lies in the “normal galaxy” region in the PAH diagnostic diagram rather than in the starburst galaxy region which includes objects such as M 82 and NGC 253, that are dominated by ionized PAHs. This would imply, at face value, that the PAHs in Mrk 996 arise mainly from the normal cold and neutral ISM surrounding the nuclear region, but not from the star-forming region itself. However, the PAH EWs are generally high, m for the 7.7 µm line, which is more typical of starburst galaxies (Brandl et al., 2004) than of BCDs. Wu et al. (2006) found that the EW of the 7.7 µm line of all the BCDs in their sample to be less than 1 µm, considerably smaller than the value of 3.6 µm in Mrk 996. For the metallicity of Mrk 996, the EWs of its 6.2 and 11.2 µm PAH features exceed by more one order of magnitude the values given by the mean EW (PAH) – metallicity relations given by Wu et al. (2006) for their BCD sample.
Just as for Haro 3, we find that the PAH emission features in Mrk 996 are relatively narrow. They are narrower than those predicted by the model for the diffuse Galactic ISM at high latitudes (Li & Draine, 2001). While the 6.2 µm and 7.7 µm features have FWHMs similar to those of the starburst galaxies M 82 and NGC 253, the 8.6 µm feature is about half as wide while the 11.3 µm feature is twice as wide. The best matches to the FWHMs of the PAH features in Mrk 996 appear to be those of the reflection nebulae region NGC 2023. Thus, neither the diffuse Galactic ISM model nor the starburst model of Li & Draine (2001) and Draine & Li (2001) can account fully for all the observed properties of the PAHs in Mrk 996. Even though the IRS spectrum of Mrk 996 may contain a conspicuous ISM component, Galactic ISM spectra are not necessarily good templates for all PAH emission in this object. This suggests that there are many factors that determine the properties of PAH features (e.g., chemical abundance, ISM energetics, etc.) which are not yet taken into account fully in the models. A more definitive observational test of the models, with a fuller exploration of the parameter space, will be possible with our larger sample of 23 BCDs.
5.2 Infrared Fine-Structure Lines
The spectrum in Fig. 7 also shows several fine-structure lines. The [S iv]10.51, [Ne ii]12.81, [Ne iii]15.55, [S iii]18.71, 33.58, and [O iv]25.89 µm are seen. In the same way as for the PAH features, we used SPLOT to fit the IR fine-structure emission lines and obtain fluxes and EWs. A deblending procedure was adopted to accurately measure the emission lines at wavelengths near PAH features (e.g., [Ne ii]). The lines were best fit with Gaussian profiles. A single continuum was linearly interpolated from 10.5 to µm. For the longer wavelengths, the local continuum was fit by linearly interpolating over adjacent line-free regions. The continuum 1 uncertainty in the SH module is W m-2, and W m-2 in LH. The fluxes and other parameters resulting from the fits are given in Table 4.
Several fairly high-ionization lines are detected in Mrk 996. The [O iv]25.89 µm line with an ionization potential of 54.9 eV, just beyond the He ii edge at 54.4 eV, is faint, but present at the 4 level. A blown-up view of the spectral region around the [O iv] line is shown in Fig. 8. However its presence raises a puzzle. As discussed before, the optical spectrum of Mrk 996 does not show the presence of the high-ionization [Fe v] 4227 emission line which also has an ionization potential of 54.4 eV. The He ii 4686 emission line, also with an ionization potential of 54.4 eV, is seen, but its broad width suggests that it originates in WR stellar winds rather than in the ionized interstellar gas. This implies that the ionizing radiation in the optical line-emitting region is less hard than that in the MIR line-emitting region.
We can have some idea of the hardness of the radiation in the MIR-emitting region by using line ratios of different ionic species of the same element, such as [Ne iii] and [Ne ii], since these are sensitive to the shape of the spectrum of the ionizing radiation field. The ratio ([Ne iii])/([Ne ii]) is 2.8, placing Mrk 996 near the high-excitation end of the starbursts studied by Verma et al. (2003), similarly to NGC 5253 and Haro 3. Because PAHs tend to be depleted in hard radiation fields, their EW would be expected to be negatively correlated with the [Ne iii]/[Ne ii] line ratio. Such a trend was indeed found by Wu et al. (2006) for their BCD sample. The anticorrelation between the PAH strength and the hardness and luminosity of the UV radiation field was also discussed by Beirao et al. (2006) in the case the irregular galaxy NGC 5253 and by Lebouteiller et al. (2007) in the case of the massive young cluster NGC 3603. However, as discussed before, compared to the Wu et al. (2006) correlation, the PAHs in Mrk 996 have considerably higher EWs for their metallicity. This may again be due to a significant PAH component from the general ISM in Mrk 996 as compared to the BCDs studied by Wu et al. (2006), as the region of Mrk 996 covered by the IRS slit is relatively large, about 700 pc. The large EWs may also be the results of different measurement techniques, as Wu et al. (2006) fit a spline to the local underlying continuum, while we linearly interpolate over two wide sections of continua.
The long-wavelength IRS spectrum (Fig. 7) shows an emission feature at 29.84 m, the wavelength of one of the strongest H2O lines in this spectral region. Such a detection would not perhaps be surprising, as water can form in shock-heated gas associated with outflows (e.g., Melnick et al., 2008, and references therein). However, we would also expect to detect a wealth of H2 lines which are not clearly seen in our spectrum (Fig. 7). Hence, it is not clear whether this is a real feature or not. We will investigate the frequency of water emission in a future paper on our larger BCD sample.
5.3 The Infrared Spectral Energy Distribution
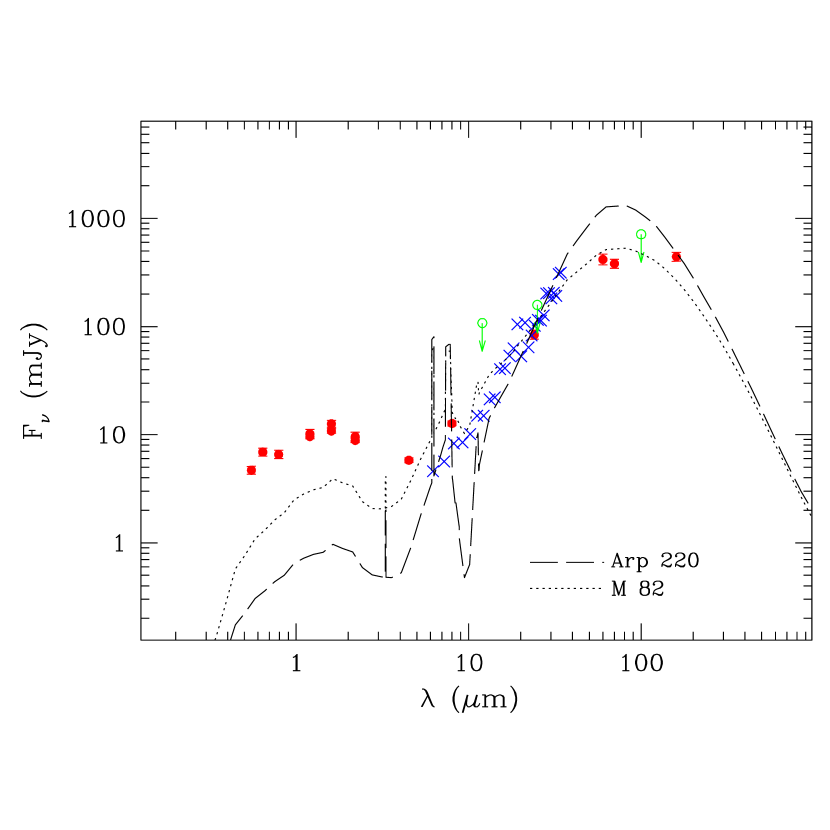
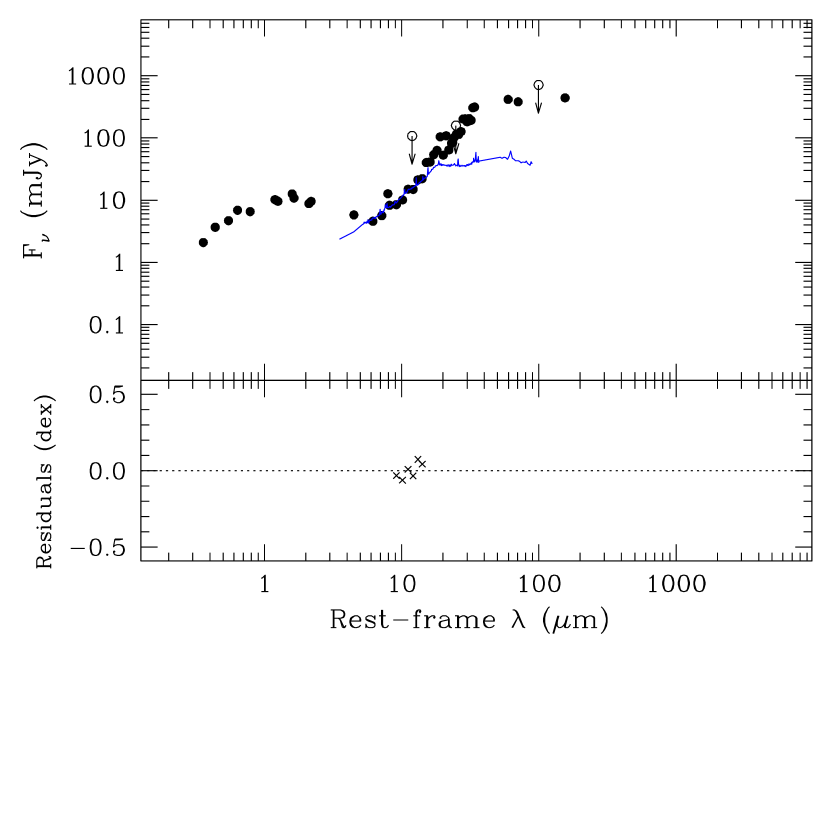
We combine the available photometric and spectroscopic data to construct the IR spectral energy distribution (SED) in Fig. 11. We have used the total emission from Mrk 996, integrated over the entire galaxy including the disk. The 8 µm IRAC point which is higher than the corresponding IRS point suggests that a significant part of the PAH emission in the disk lies in a region more extended than the one covered by the IRS SL slit. The coincidence of the MIPS 24 µm point with the IRS spectral one lends confidence to our data reduction procedures, including background subtraction and flux calibration.
It can be seen that the SED has a broad peak from 80 to 160 µm, implying that the dust in the disk of Mrk 996 must be rather cool, 20 K. Indeed, this broad peak toward longer wavelengths is almost certainly due to the “mixed morphology” of Mrk 996. Up to 70 µm, Mrk 996 is virtually a point source, dominated by the compact nuclear star-forming region; but at longer wavelengths, the disk dominates with its contribution of cooler dust. Hence, the SED does not show a well-defined spectral peak, but rather a smeared-out one, due to the contributions of dust at different temperatures from different regions.
We have compared in Fig. 11 the SED of Mrk 996 with model SEDs of starburst galaxies such as Arp 220 and M 82, taken from Silva et al. (1998). These models, normalized to continuum emission between 20 and 30 µm, clearly do not fit the SED of Mrk 996 (see also the discussion of Hunt et al., 2005): Mrk 996 shows no silicate absorption feature at 10 µm, relatively little PAH emission compared to a luminous solar-metallicity starburst galaxy, and a very different MIR continuum slope. Moreover, in Mrk 996, the unabsorbed emission that emerges at NIR and optical wavelengths is greater relative to the dust emission, when compared to the prototypical starburst galaxies M 82 and Arp 220. This is most probably due to a lower extinction and thus to a lower fraction of dust reprocessing, but could also be due to differing dust content relative to the stars.
We have also compared the SED of Mrk 996 with that of the Seyfert 1 galaxy NGC 4151 (Buchanan et al., 2006), normalized over the 9 -15 m region (Fig. 12). While this SED gives low residuals in the normalization zone, il fails to fit the SED for wavelengths longer than 15 m. Clearly, dust reprocessing of the H ii region radiation dominates the SED of Mrk 996 at longer wavelengths. The surrounding cooler ISM also contributes significantly, resulting in a roughly constant (in flux density) SED from 70 to 160 m.
In summary, like most other star-forming galaxies (see the discussion of the BCD Haro 3 in Hunt et al., 2006), Mrk 996 is a composite entity in the IR; different components and morphologies are seen at different wavelengths. In Mrk 996, at we see the clear signature of a very red nucleus, and the evolved extended underlying stellar population in the disk; similarly, at 4.5 µm we see a nuclear hot dust continuum and the evolved stars in the disk; at 8 µm, we see mostly extended PAH emission in the general ISM; at 24 and 70 µm, we see unresolved emission from warm dust associated with the nucleus; and at 160 µm cooler extended dust emission in the disk.
6 CLOUDY modeling of the emission-line fluxes
6.1 The narrow and broad line components of Mrk 996
Thanks to a higher spectral resolution than that of the IRS spectrum, it can be seen clearly from the MMT optical spectrum (Fig. 9) that some lines have two components: a narrow component at high intensity levels and a broad component at low intensity levels. We have used SPLOT to deconvolve the profiles of these lines into narrow and broad components. The deconvolution results are shown in Table 5. It gives for both components the line flux of each detected line normalized to the flux and its FWHM. The narrow component of the [O iii] 4363 line is negligible. Three facts are to be noticed in Table 5. First, the narrow line component has FWHMs varying between 2.6 and 3.5 Å, comparable to the spectral resolution. It is thus not resolved, giving upper limits of gas velocities between 87 and 135 km s-1. On the other hand, the broad line component has FWHMs varying between 6.1 and 8.5 Å, corresponding to gas velocities between 235 and 330 km s-1. Second, the ratio of the auroral [O iii] 4363 line to that of the nebular [O iii] 4959 line for the broad component, equal to 0.45, is unusually high compared to its usual value of 0.1 for an electron temperature of 20 000 K, suggesting collisional deexcitation of the [O iii] 4959 line. Third, the intensities for the He i lines relative to are different for the narrow and broad line components. For the He i 3889 line, the relative intensity of the broad component is smaller than that of the narrow component by a factor of 1.4, while for the He i 4471 line, the reverse is true, the broad component being more intense by a factor of 2.
Thuan et al. (1996) have suggested that these observational features can be understood if the optical lines arise in two main regions: (1) the broad lines in a very dense inner region ( 100 pc) with large gas mass motions, most likely powered by stellar winds of the Wolf-Rayet stars, the presence of which is clearly indicated by the WR bump in the MMT spectrum (Fig. 9) , and (2) the narrow lines in a considerably less dense outer region ( several hundred pc), with a density more comparable to those in normal H ii regions, and smaller mass motions. In this type of model, the helium lines would arise in the dense inner region: the intensity of the He i 4471 emission line would be enhanced because of collisional excitation, while the intensity of the He i 3889 line which is sensitive to optical depth effects, would be decreased because of the higher optical depth. Thuan et al. (1996) were indeed able to construct an inhomogeneous two-zone CLOUDY model which accounts well for the observed line intensities of the UV and optical lines. Their best model has an inner region with a central electron density equal to 4.5 106 cm-3 and a density decreasing with radius as out to a radius of 100 pc, and an outer region with a constant density = 450 cm-3 for radii between 100 pc and 320 pc.
In addition to the presence of distinct broad and narrow line regions, there is also a trend of increasing line width with ionization potential, similar to Seyfert galaxies (De Robertis & Osterbrock, 1984; Whittle, 1985). However the gas clouds motions and densities in the broad-line region are not as large as in the case of an AGN. Also, the UV and optical spectra show no evidence of the very hard ionizing radiation that is usually present in an AGN. But, as discussed before, the detection of the [O iv] 25.9m emission line in the IRS spectrum (Fig. 7) does imply the presence of hard EUV radiation in the MIR-emitting region. However, hard ionizing radiation, as seen below, can be produced by shocks or by WNE-w stars, not necessarily by an AGN.
6.2 A hidden H ii region
We now use CLOUDY to check whether the two-zone model constructed by Thuan et al. (1996) to account for the UV and optical line fluxes observed by HST can also explain the MIR line fluxes observed by Spitzer.
The parameters of the CLOUDY model used here are very similar to those of model 1 of Thuan et al. (1996) (the one with low nitrogen abundance). The slight differences are due to the updating of the CLOUDY code with new atomic parameters. However, since the Spitzer and MMT spectra have been obtained through significantly larger apertures than the HST aperture, we have increased the radius of the modeled H ii region to 580 pc in order to take into account the total H emission of Mrk 996. This emission extends over an angular radius of 5″ (520 pc) (Gil de Paz et al., 2003), and is covered entirely by the LH IRS slits and mostly by the SH IRS slits. The model gives a luminosity () = 2.341040 erg s-1, corresponding to a number of ionizing photons per second, log (H) = 52.75. At the distance of 21.7 Mpc, this luminosity corresponds to a H flux (H) = 4.1810-16 W m-2. This flux is very similar to the H flux of 4.4010-16 W m-2 derived from the extinction-corrected H flux measured for Mrk 996 by Gil de Paz et al. (2003), adopting an extinction coefficient (H) = 0.53 and a H/H ratio of 2.8. As for the run of the number density with radius , we have also adopted for the inner part (1 pc 100 pc) a -2 law, with a maximum log = 6.66 at the inner boundary ( = 1 pc), and a constant log = 2.645 for 100 pc. The filling factor, log = 4.58, characteristic of a very clumpy interstellar medium, is the same as in Thuan et al. (1996). Hereafter, this model will be referred to as Model I.
6.2.1 Comparison of observed and modeled optical line fluxes
First, we check that Model I is indeed able to reproduce the fluxes of the optical emission lines obtained from the MMT spectrum. Table 6 lists the extinction-corrected observed fluxes and Model I fluxes of several strong optical lines along with their ratios. It is seen that the observed high-ionization [O iii] and [Ne iii] emission lines are well reproduced by the model, but that the observed fluxes of of the lower ionization [O ii] 3727 and H emission lines are significantly smaller (by factors of 2 and 1.7 respectively) than the modeled ones. Evidently, the difference is due to aperture effects because the aperture of the MMT spectrum does not cover all the emission from the H ii region, and the lower-ionization lines are produced further away from the nucleus than the high-ionization ones. Therefore, we have also calculated Model Ia, which has the same parameters as Model I, except that the radius of the modeled H ii region is equal to 410 pc instead of 580 pc. This radius was chosen so that the modeled H flux matches the observed H flux within the MMT aperture. Compared to Model I fluxes, the fluxes of the high-ionization lines in Model Ia remain unchanged, while the flux of the [O ii] 3727 emission line is considerably lower, bringing it into good agreement with the observed one, as shown in the last column of Table 6. Thus, we conclude that CLOUDY models with the parameters adopted above do indeed reproduce well the observed fluxes of the optical lines.
6.2.2 Comparison of observed and modeled MIR line fluxes
We next compare the observed MIR emission line fluxes with those predicted by Model I. Examination of columns 2 and 3 of Table 7 shows that, despite similar observed and modeled fluxes of the optical lines, Model I predicts significantly lower MIR line fluxes, as compared to the observed ones, except for [Ne ii] 12.8 m. There could be at least two explanations of this discrepancy: 1) aperture effects and 2) the presence of an additional obscured H ii region that is not seen in the optical range, but that contributes to the MIR emission.
We consider first the possible role of aperture effects. The angular radius of the optical H ii region of 5″ is significantly greater than half of the slit width used in the optical observations. It is greater than or comparable to half of the slit width used for the IRS spectra. Therefore, aperture effects may be important. In particular, these effects may play a role for the hydrogen lines and the low-ionization forbidden optical [O ii] 3727 and the MIR [Ne ii] 12.8µm lines because a significant fraction of emission in these lines comes from the outer zones of the H ii region. For higher-ionization lines, the aperture effects should be smaller because those lines arise in the inner zones of the H ii region. To check how aperture effects may influence the emission line fluxes, we show in Figure 13 the fluxes predicted by CLOUDY of different optical and MIR lines emitted by a H ii sphere with a varying radius , keeping all other parameters equal to those of Model I. All fluxes are normalized to the fluxes from the sphere with the 580 pc outer radius of the H ii region in Model I. We have also shown by vertical lines the “equivalent” radii of the different apertures used in the optical and MIR observations, defined as , where is the area of the aperture. We also mark the location of the outer radius of the H ii region in Model I. The ratios cannot be used directly for aperture corrections since they are derived for spheres, while the observed emission comes from a cylindric column with equivalent radius . They provide however upper limits to the aperture corrections and Fig. 13 can be used for a qualitative analysis. It is seen from that figure that aperture corrections are important for some optical lines, especially the [O ii] 3727 line, as confirmed by comparison of the HST and MMT fluxes: the MMT flux (Table 2) is 1.5 times larger than the HST flux (Thuan et al., 1996). The HST and MMT H fluxes are respectively 3 and 2 times lower than the one inferred from the H flux by Gil de Paz et al. (2003). On the other hand, the aperture correction is negligible for higher-ionization optical lines, such as [O iii] 5007. The aperture corrections for the MIR lines are significantly lower because of the larger apertures used. Fig. 13 shows that the IRS SH aperture includes nearly all the H ii region emission and the IRS LH aperture includes all of it. Thus, aperture effects cannot account for the large differences between the observed and modeled fluxes of the MIR lines, except perhaps for the [Ne ii]12.8m emission line which has the largest aperture correction. We conclude that, to account for the MIR emission, we need to postulate the existence of a hidden H ii region in Mrk 996 that contributes to the MIR emission, but not to the optical emission.
We have found that the best CLOUDY model of this obscured H ii region (hereafter Model II) is characterized by the following parameters: a number of ionizing photons log (H) = 52.425 – 2 times lower than for Model I –, an effective temperature = 50000 K, – slightly higher than in Model I, suggesting a younger H ii region –, a constant number density of 300 cm-3, a filling factor log = –2, an H ii region radius of 100 pc and the same chemical composition as in Model I. The predicted fluxes of the MIR lines for Model II are shown in Table 7. It is seen that, except for the [Ne ii]12.8m line, the predicted fluxes of the MIR lines in Model II (the hidden H ii region) are all significantly higher than those in Model I (the visible H ii region), despite a number of ionizing photons which is 2 times lower. The main reason is that, in Model I, the infrared fine-structure line fluxes are strongly reduced by collisional deexcitation of the upper levels in the very dense central part of the visible H ii region. At the critical densities, the line ratios will change as some lines will be suppressed less strongly as compared to other lines that will be suppressed more strongly. The critical number densities for collisional deexcitation of the detected MIR lines are in the range 103 – 105 cm-3 (Martín-Hernández et al., 2002), lower than the central number density. Collisional deexcitation is however not important for the [Ne ii]12.8m line because it has a very high critical density of 6.1105 cm-3 and in addition it arises in the outer less dense zones of the H ii region in Model I. Adding the line fluxes from Models I and II (columns 3 and 4 of Table 7), we see that the modeled and observed fluxes of the MIR lines are in general good agreement, their ratios (column 8 of Table 7) being close to unity. How much dust extinction would it take to hide the H ii region of Model II ? If we set the upper limit of its H flux to be 10% that of the visible region, then its would be 4 magnitudes.
6.3 A hidden source of hard ionizing radiation
There is, however, one glaring discrepancy in column 8 of Table 7: the model does not predict any [O iv] 25.9m emission, while this line is clearly detected in the IRS spectrum. The ionization potential of [O iv] is 54.9 eV, just beyond the He ii edge at 54.4 eV. As discussed before, we have searched the optical spectrum of Mrk 996 for the high-ionization [Fe v] 4227 and He ii 4686 nebular emission lines which both have an ionization potential of 54.4 eV, but none were seen. This implies that the hard ionizing radiation comes entirely from a region that is optically hidden, which is not necessarily spatially coincident with the optically hidden H ii region discussed before.
Mrk 996 is not the only BCD to reveal harder ionizing radiation in the MIR than the optical. The same phenomenon occurs in the BCD Haro 3, the most metal-rich [12+log(O/H)= 8.32] BCD of our Spitzer sample. Haro 3 also shows a well detected [O iv] 25.9m emission line in its IRS spectrum, while the [Fe v] 4227 and He ii 4686 nebular emission lines are conspicuously absent from its optical spectrum (Hunt et al., 2006). We will have to wait for the analysis of our whole Spitzer BCD sample to tell whether that is a general property of BCDs, or whether this occurs only in exceptional cases.
What is the origin of the hard ionizing radiation beyond 4 Ryd in Mrk 996? Can stellar radiation be responsible? We have run Costar models by Schaerer & de Koter (1997) with stars having the highest effective temperature (Teff = 53 000 K) and the hardest radiation possible (corresponding to the hottest O3 stars). We failed to reproduce the observed intensity of the [O iv] 25.9m by a factor of several. We have then considered Wolf-Rayet stars of type WNE-w. According to calculations by Crowther et al. (1999), models for WNE-w stars (early nitrogen Wolf-Rayet stars with weak lines) show a strong ionizing flux above 4 Rydberg ( 228 Å), in contrast to the WCE and WNL stars which show negligible fluxes above 3-4 Rydberg. These stars have transparent winds, and therefore their ( 4 Ryd)/ ( 1 Ryd), where is the ionizing flux, is some 100 times higher than the same ratio predicted for the hottest O stars by the Costar models (Schaerer & de Koter, 1997). We have run CLOUDY models with the ionization spectrum of a WNE-w star (Crowther et al., 1999). We found that with a log (H) = 51.425, some 25 times less than that from the bright H ii region, and some 10 times less than the (H) of the hidden H ii region, the observed intensity of the [O iv] line can be reproduced (Table 7). The fraction of WNE-w to O stars is several percent if the same (H) (log (H) 49) is assumed for single O and WNE-w stars. This estimate may be wrong by a factor of 10 because of the uncertainty in the (H) of WNE-w stars. The WNE-w stellar spectrum does not produce much of the lower-ionization species, so that the agreement obtained previously between observations and models for the line intensities of the lower-ionization species is not destroyed. A weak [Ne v] 24.3m line is predicted by CLOUDY, with an intensity some 9 times weaker than that of the [O iv] line intensity, consistent with its non-detection. How plausible is the presence of such a WNE-w stellar population in the central star-forming region of Mrk 996? A ratio (WNE)/(O) of a few percent appears high because, at the metallicity of Mrk 996 it is roughly equal to the number ratio of WR stars of all types to O stars (Guseva, Izotov & Thuan, 2000), and because WNE-w stars are rare among WR stars. Moreover, from the equivalent width of H (106.9 Å), we estimate the age of the bright visible H ii region to be 3-4 Myr. WNE stars are thought to result from mass transfer in close binary systems, so they dominate the stellar population at ages 10 Myr, when O stars and WR stars of other types are gone. Thus the visible H ii region is too young to contain WNE stars. If one wishes to invoke WNE stars as the source of hard radiation, one would have to postulate that these stars are not visible in the optical range. All things considered, we do not consider the WNE-w hypothesis very likely.
We have also considered the case of a non-stellar source of ionizing radiation, that emitted by an accretion disk around an intermediate-mass black hole in the center of Mrk 996. Thus, we have also run CLOUDY models with an ionization spectrum in the form of a power-law: () . We found that, in order to reproduce the line intensity of the [O iv] line, the number of ionizing photons coming from the AGN has to be log Q (H) = 51.125, some 50 times smaller than that coming from the bright H ii region. Again, the previous agreement between models and observations for the lower-ionization species is preserved. The results are also given in Table 7. Again, a weak [Ne v] 24.3m line is predicted, with an intensity some 3 times weaker than that of the [O iv] line intensity. This line can be even weaker if the power-law spectrum has a slope steeper than . In any case, such a low-intensity line would be hard to detect. Because we have to postulate that the AGN is completely invisible in the optical, we do not favor the AGN hypothesis as the most probable one.
Finally, we discuss a third possible source of hard ionizing radiation. Izotov et al. (2001), Izotov et al. (2004) and Thuan & Izotov (2005) have suggested that fast radiative shocks moving through a dense interstellar medium with 100 cm-3 can be possible sources of photons with energy 54 eV, and be responsible for the [Ne v] 3426 (ionization potential of 7.1 ryd), [Fe v] 4227 (ionization potential of 4 ryd), and He ii 4686 (ionization potential of 4 ryd) emission they observed in some BCDs. The ionizing spectrum of such fast shocks has been computed by Dopita & Sutherland (1996) for a gas of solar metallicity and various shock velocities. Recently, this work has been extended to environments with lower metallicities by M. G. Allen et al. 2004 (in preparation). Thus, we have also run CLOUDY models with an ionizing spectrum taken from the “Mapping” III Shock model library (), and characterized by a metallicity equal to that of the Small Magellanic Cloud (closest to the metallicity of Mrk 996) and a shock velocity equal to 250 km s-1. This velocity corresponds to the FWHM of 7 Å observed for the broad component of the emission lines in Table 5. The CLOUDY results are given in Table 7 for the shock model with a number of ionizing photons log (H) = 51.425, the same as that for the model with the WNE-w stars. It can be seen that the predicted line intensities in the shock model are very similar to those in the WNE-w model, and thus can account equally well for the intensity of the [O iv] line. Again a weak [Ne v] 24.3m line is predicted which would be undetectable. We favor the shock hypothesis as the most plausible explanation for the [O iv] line, as Mrk 996 contains many WR stars with outflowing stellar winds and, likely, supernova remnants which will no doubt cause radiative shocks.
7 Summary
We have acquired Spitzer MIR, UKIRT NIR and MMT optical observations of the blue compact dwarf galaxy Mrk 996 to study its gas, dust and stellar content. This BCD, with a metallicity of about 1/5 that of the Sun, has the peculiarity of possessing an extremely dense nuclear star-forming region: its central density is 106 cm-3, some 4 orders of magnitude greater than the densities of normal H ii regions. We have obtained the following results:
(1) The nucleus of Mrk 996 is extremely red, with = 1.8, and = 1.0, probably due to very hot dust with a temperature between 600 and 1000 K. The optical spectrum of the BCD shows the high-ionization lines to have both broad and narrow line components, and a trend of increasing line width with increasing ionization potential.
(2) The colors of the underlying exponential disk are roughly consistent with the colors of a coeval stellar population with age 1 Gyr.
(3) Like most star-forming galaxies, Mrk 996 is a composite entity in the IR. We see extended photospheric emission from evolved stars, compact hot dust continuum coming from the nuclear star-forming region at 4.5 µm, hot dust continuum and extended PAH emission coming mainly from the surrounding less dense ISM at 8 µm, compact small grain warm dust associated with the active star-forming nuclear region at 24 µm and 70 µm, and cooler extended dust emission associated with older stellar populations at 160 µm.
(4) The IRS spectrum (Fig. 7) shows strong Polycyclic Aromatic Hydrocarbon (PAH) molecular emission, with features clearly detected at 5.7, 6.2, 7.7, 8.6, 11.2 and 12.7 µm. The PAHs in Mrk 996 are predominantly neutral and small, similar to those found in normal spiral galaxies, suggesting that they reside in the general ISM and not in the star-forming region. The PAH emission features are relatively narrow and their equivalent widths are generally high for the metallicity of Mrk 996, exceeding by more than one order of magnitude the values given for the mean EW(PAH)-metallicity relation derived by previous investigators.
(5) Gaseous nebular line emission is seen. The IRS spectrum shows several fine-structure forbidden lines, including [S iv] 10.51, [Ne ii] 12.81, [Ne iii] 15.55, [S iii] 18.71, 33.48 and [O iv] 25.90 µm.
(6) We have used CLOUDY to model the line-emitting region. To account for both the optical and MIR lines, two H ii regions are required: a) a very dense H ii region that is seen in the optical range (Model I) and b) an optically obscured H ii region ( 4 mag) with a constant number density of 300 cm-3, typical of other H ii regions (Model II). A two-zone model is required for the non-obscured H ii region (Model I): a) a very dense nuclear region where the broad optical line components arise; from a central value of 106 cm-3, the density decreases with distance as until 100 pc; b) an outer zone for 100 pc 580 pc, with constant number density of 400 cm-3 . The density gradient is probably caused by large scale gas mass motions, powered by the stellar winds of Wolf-Rayet stars.
(7) The UV and optical spectra show no evidence of the very hard ionizing radiation seen in AGN. The IRS spectrum does show however the presence of a faint [O iv] line at 25.89 µm, indicating the presence of radiation as hard as 54.9 eV in Mrk 996. This hard radiation is most likely due to fast radiative shocks in the ISM caused by outflowing stellar winds from WCE and WNL stars and/or by supernova remnants. A hidden AGN, or a population of hidden Wolf-Rayet stars of type WNE-w are are less likely sources of hard ionizing radiation.
References
- Alonso-Herrero et al. (2001) Alonso-Herrero, A., Quillen, A. C., Simpson, C., Efstathiou, A., & Ward, M. J. 2001, AJ, 121, 1369
- Asplund et al. (2005) Asplund, M., Grevesse, N., & Sauval, A. J. 2005, ASP Conf. Ser. 336: Cosmic Abundances as Records of Stellar Evolution and Nucleosynthesis, 336, 25
- Beirao et al. (2006) Beirao, P., Brandl, B. R., Devost, D., Smith, J. D., Hao, L., & Houck, J. R. ApJ, 643, L1
- Brandl et al. (2004) Brandl, B. R., et al. 2004, ApJS, 154, 188
- Buchanan et al. (2006) Buchanan, C. L., Gallimore, J. F., O’Dea, C. P., Baum, S. A., Axon, D. J., Robinson, A., Elitzur, M., & Elvis, M. 2006, AJ, 132, 401
- Cardelli et al. (1989) Cardelli, J. A., Clayton, G. C., & Mathis, J. S. 1989, ApJ, 345, 245
- Crowther et al. (1999) Crowther, P. A., Beck, S. C., Willis, A. J., Conti, P. S., Morris, P. W., & Sutherland, R. S. 1999, MNRAS, 304, 654
- de Jong (1996) de Jong, R. S. 1996, A&A, 313, 377
- De Robertis & Osterbrock (1984) De Robertis, M. M., & Osterbrock, D. E. 1984, ApJ, 286, 171
- Dopita & Sutherland (1996) Dopita, M. A., & Sutherland, R. S. 1996, ApJS, 102, 161
- Draine (2006) Draine, B. T. 2006, private communication
- Draine & Li (2001) Draine, B. T., & Li, A. 2001, ApJ, 551, 807 1
- Enya et al. (2002) Enya, K., Yoshii, Y., Kobayashi, Y., Minezaki, T., Suganuma, M., Tomita, H., & Peterson, B. A., 2002, ApJS, 141, 23
- Fazio et al. (2004) Fazio, G. G., et al. 2004, ApJS, 154, 10
- Ferland (1996) Ferland, G. J. 1996, Hazy: A brief Introduction to CLOUDY (Univ. Kentucky Dept. Phys. Astron. Internal Rep.)
- Ferland et al. (1998) Ferland, G. J., Korista, K. T., Verner, D. A., Ferguson, J. W., Kingdon, J. B., & Verner, E. M. 1998, PASP, 110, 761
- Gil de Paz et al. (2003) Gil de Paz, A., Madore, B. F., & Pevunova, O. 2003, ApJS, 147, 29
- Guseva, Izotov & Thuan (2000) Guseva, N. G., Izotov, Y. I., & Thuan, T. X. 2000, ApJ, 531, 776
- Guseva, Izotov & Thuan (2006) Guseva, N. G., Izotov, Y. I., & Thuan, T. X. 2006, ApJ, 644, 890
- Hawarden et al. (2001) Hawarden, T. G., Leggett, S. K., Letawsky, M. B., Ballantyne, D. R., & Casali, M. M. 2001, MNRAS, 325, 563
- Helou et al. (2000) Helou, G., Lu, N. Y., Werner, M. W., Malhotra, S., & Silbermann, N. 2000, ApJ, 532, L21
- Houck et al. (2004) Houck, J. R., et al. 2004, ApJS, 154, 18
- Hunt & Giovanardi (1992) Hunt, L.K., & Giovanardi, C. 1992, AJ, 104, 1018
- Hunt et al. (2002) Hunt, L. K., Giovanardi, C., & Helou, G. 2002, A&A, 394, 873
- Hunt et al. (1997) Hunt, L. K., Malkan, M. A., Salvati, M., Mandolesi, N., Palazzi, E., & Wade, R. 1997, ApJS, 108, 229
- Hunt, Thuan, & Izotov (2003) Hunt, L.K., Thuan, T. X., & Izotov, Y. I. 2003, ApJ, 588, 281
- Hunt et al. (2005) Hunt, L. K., Bianchi, S., & Maiolino, R. 2005, A&A, 434, 849
- Hunt et al. (2006) Hunt, L. K., Thuan, T. X., Sauvage, M., & Izotov, Y. I. 2006, ApJ, 653, 222
- Ivezić & Elitzur (1997) Ivezić, Z. & Elitzur, M. 1997, MNRAS, 287, 799
- Izotov et al. (1992) Izotov, Y. I., Lipovetsky, V. A., Guseva, N. G., & Kniazev, A. Y. 1992, in The Feedback of Chemical Evolution on the Stellar Content of Galaxies, ed. D. Alloin & G. Stasińska (Paris: Paris Obs. Publ.), p. 138
- Izotov, Thuan & Lipovetsky (1994) Izotov, Y. I., Thuan, T. X., & Lipovetsky, V. A. 1994, ApJ, 435, 647
- Izotov et al. (2001) Izotov, Y. I., Chaffee, F. H., & Schaerer, D. 2001, A&A, 378, L45
- Izotov et al. (2004) Izotov, Y. I., Noeske, K. G., Guseva, N. G., Papaderos, P., Thuan, T. X., & Fricke, K. J. 2004, A&A, 415, L27
- Johnson et al. (2004) Johnson, K. E., Indebetouw, R., Watson, C., & Kobulnicky, H. A. 2004, AJ, 128, 610
- Lebouteiller et al. (2007) Lebouteiller, V., Brandl, B., Bernard-Salas, J., Devost, D., & Houck, J. R. 2007, ApJ, 665, 390
- Leitherer et al. (1999) Leitherer, C., et al. 1999, ApJS, 123, 3
- Li & Draine (2001) Li, A., & Draine, B. T. 2001, ApJ, 554, 778
- Loose & Thuan (1985) Loose, H.-H. & Thuan, T. X. 1985, in Star-Forming Dwarf Galaxies and related objects, eds. D. Kunth, T.X. Thuan & J.T.T. Van (Gif-sur-Yvette: Editions Frontieres), p. 73
- Makovoz & Marleau (2005) Makovoz, D., & Marleau, F. R. 2005, PASP, 117, 1113
- Martín-Hernández et al. (2002) Martín-Hernández, N. L., et al. 2002, A&A, 381, 606
- Melnick et al. (2008) Melnick, G. J., Tolls, V., Neufeld, D. A., Yuan, Y., Sonnentrucker, P., Watson, D. M., Bergin, E. A., & Kaufman, M. J. 2008, ArXiv e-prints, 805, arXiv:0805.0573
- Mouhcine & Lançon (2002) Mouhcine, M., & Lançon, A. 2002, A&A, 393, 149
- Origlia et al. (1999) Origlia, L., Goldader, J. D., Leitherer, C., Schaerer, D., & Oliva, E. 1999, ApJ, 514, 96
- Peletier & Balcells (1997) Peletier, R. F., & Balcells, M. 1997, New Astronomy, 1, 349
- Reach et al. (2005) Reach, W. T., et al. 2005, PASP, 117, 978
- Rieke et al. (2004) Rieke, G. H., et al. 2004, ApJS, 154, 25
- Schaerer & de Koter (1997) Schaerer, D., & de Koter, A. 1997,A&A, 322, 598
- Schlegel et al. (1998) Schlegel, D. J., Finkbeiner, D. P., & Davis, M. 1998, ApJ, 500, 525
- Silva et al. (1998) Silva, L., Granato, G. L., Bressan, A., & Danese, L. 1998, ApJ, 509, 103
- Tantalo et al. (1996) Tantalo, R., Chiosi, C., Bressan, A., & Fagotto, F. 1996, A&A, 311, 361
- Thuan & Izotov (2005) Thuan, T. X., & Izotov, Y. I. 2005, ApJS, 161, 240
- Thuan et al. (1996) Thuan, T. X., Izotov, Y. I., & Lipovetsky, V. A. 1996, ApJ, 463, 120
- Thuan et al. (1999) Thuan, T. X., Lipovetsky, V. A., Martin, J.-M., & Pustilnik, S. A. 1999, A&AS, 139, 1
- Vázquez & Leitherer (2005) Vázquez, G. A., & Leitherer, C. 2005, ApJ, 621, 695
- Verma et al. (2003) Verma, A., Lutz, D., Sturm, E., Sternberg, A., Genzel, R., & Vacca, W. 2003, A&A, 403, 829
- Weedman et al. (2005) Weedman, D. W., et al. 2005, ApJ, 633, 706
- Werner et al. (2004) Werner, M. W., et al. 2004, ApJS, 154, 1
- Whitford (1958) Whitford, A. E. 1958, AJ, 63, 201
- Whittle (1985) Whittle, M. 1985, MNRAS, 216, 817
- Wu et al. (2006) Wu, Y., Charmandaris, V. Hao, L., Brandl, B. R., Bernard-Salas, J., Spoon, H. W. W., & Houck, J. R. 2006, ApJ, 639, 157


| Telescope/Instrument | Wavelength | Total flux |
|---|---|---|
| (m) | (mJy) | |
| Spitzer/IRAC | 4.51 | 5.8 0.29 |
| ” | 7.98 | 12.7 0.64 |
| Spitzer/MIPS | 23.7 | 84 4 |
| ” | 71.0 | 381 10 |
| ” | 156.0 | 442 12 |
| IRASaaFrom NED. | 12 | 108 |
| ” | 25 | 159 |
| ” | 60 | 417 50 |
| ” | 100 | 713 |
| OpticalbbFrom Thuan et al. (1996), with colors defined within a 9″ aperture centered on the nucleus. | 0.36 | 2.1 0.2 |
| ” | 0.44 | 3.7 0.3 |
| ” | 0.55 | 4.7 0.4 |
| ” | 0.64 | 6.9 0.6 |
| ” | 0.79 | 6.6 0.6 |
| IRCAM/UKIRTccIn an aperture of 20″ diameter. | 1.26 | 9.6 0.5 |
| ” | 1.65 | 10.8 0.5 |
| ” | 2.12 | 8.9 0.4 |
| 2MASSaaFrom NED. | 1.2 | 10.2 1 |
| ” | 1.6 | 12.6 1 |
| ” | 2.2 | 9.6 1 |
| Line | 100 | 100 | EW(H) |
|---|---|---|---|
| 3697 H17 | 0.5 0.1 | 0.7 0.1 | 0.4 |
| 3704 H16 | 1.1 0.1 | 1.6 0.1 | 0.9 |
| 3712 H15 | 0.8 0.1 | 1.2 0.3 | 0.7 |
| 3727 [O ii] | 99.1 1.4 | 144.4 1.8 | 86.4 |
| 3750 H12 | 2.0 0.1 | 2.9 0.3 | 1.8 |
| 3771 H11 | 2.5 0.1 | 3.5 0.2 | 2.2 |
| 3797 H10 | 3.3 0.1 | 4.7 0.2 | 2.9 |
| 3820 He i | 1.7 0.1 | 2.4 0.1 | 1.5 |
| 3835 H9 | 5.3 0.1 | 7.3 0.2 | 4.7 |
| 3868 [Ne iii] | 44.7 0.7 | 61.7 0.8 | 38.1 |
| 3889 He i+H8 | 13.8 0.2 | 18.9 0.3 | 11.9 |
| 3968 [Ne iii]+H7 | 24.7 0.4 | 32.9 0.5 | 21.4 |
| 4009 He i | 0.4 0.1 | 0.5 0.1 | 0.3 |
| 4026 He i | 2.4 0.1 | 3.1 0.1 | 2.0 |
| 4038 N ii+N ii | 0.2 0.1 | 0.2 0.1 | 0.2 |
| 4068 [S ii] | 1.4 0.1 | 1.8 0.1 | 1.2 |
| 4076 [S ii] | 0.3 0.1 | 0.3 0.1 | 0.2 |
| 4102 H | 21.8 0.3 | 27.8 0.4 | 19.2 |
| 4121 He i | 0.4 0.1 | 0.4 0.1 | 0.3 |
| 4143 He i | 1.1 0.1 | 1.4 0.1 | 1.0 |
| 4181 N ii | 0.3 0.1 | 0.4 0.1 | 0.3 |
| 4207 ? | 0.7 0.1 | 0.9 0.1 | 0.6 |
| 4232 O i | 0.5 0.1 | 0.6 0.1 | 0.4 |
| 4244 [Fe ii] | 0.7 0.1 | 0.9 0.1 | 0.7 |
| 4267 C ii | 0.4 0.1 | 0.6 0.1 | 0.4 |
| 4276 [Fe ii] | 0.5 0.1 | 0.6 0.1 | 0.5 |
| 4287 [Fe ii] | 0.7 0.1 | 0.9 0.1 | 0.7 |
| 4318 O ii | 0.5 0.1 | 0.6 0.1 | 0.5 |
| 4340 H | 42.7 0.6 | 50.2 0.7 | 40.6 |
| 4363 [O iii] | 14.3 0.2 | 16.7 0.3 | 13.6 |
| 4388 He i | 0.6 0.1 | 0.7 0.1 | 0.6 |
| 4415 [Fe ii] | 1.0 0.1 | 1.2 0.1 | 1.0 |
| 4452 [Fe ii] | 0.5 0.1 | 0.6 0.1 | 0.5 |
| 4471 He i | 6.1 0.1 | 6.8 0.1 | 5.9 |
| 4520 Si ii | 0.4 0.1 | 0.5 0.1 | 0.4 |
| 4658 [Fe iii] | 2.8 0.1 | 3.0 0.1 | 2.6 |
| 4702 [Fe iii] | 0.6 0.1 | 0.7 0.1 | 0.6 |
| 4713 [Ar iv]+He i | 1.2 0.1 | 1.2 0.1 | 1.1 |
| 4734 [Fe ii] | 0.6 0.1 | 0.6 0.1 | 0.6 |
| 4755 [Fe iii] | 0.5 0.1 | 0.5 0.1 | 0.5 |
| 4770 [Fe iii] | 0.2 0.1 | 0.2 0.1 | 0.2 |
| 4778 [Fe iii] | 0.3 0.1 | 0.3 0.1 | 0.3 |
| 4815 [Fe ii] | 0.4 0.1 | 0.4 0.1 | 0.4 |
| 4861 H | 100.0 1.5 | 100.0 1.5 | 106.9 |
| 4881 [Fe ii] | 0.4 0.1 | 0.4 0.1 | 0.4 |
| 4903 [Fe ii]+Si ii | 2.0 0.1 | 2.0 0.1 | 2.2 |
| 4922 He i | 2.2 0.1 | 2.2 0.1 | 2.4 |
| 4959 [O iii] | 100.9 1.5 | 98.2 1.4 | 110.3 |
| 4987 [Fe iii] | 0.5 0.1 | 0.5 0.1 | 0.6 |
| 5007 [O iii] | 300.0 4.3 | 287.9 4.2 | 328.4 |
| WavelengthaaRest wavelength, corrected for . | IntegratedbbStandard deviations of the repeated measurements are given in parentheses. The true uncertainty including calibration is probably 20%. | EquivalentbbStandard deviations of the repeated measurements are given in parentheses. The true uncertainty including calibration is probably 20%. | FWHMbbStandard deviations of the repeated measurements are given in parentheses. The true uncertainty including calibration is probably 20%. |
|---|---|---|---|
| Flux | Width | ||
| (µm) | ( W m-2) | (µm) | (µm) |
| 5.759 | 3.3 (0.1) | 0.245 (0.029) | 0.044 (0.002) |
| 6.225 | 14.8 (0.4) | 1.030 (0.046) | 0.172 (0.005) |
| 7.771 | 54.8 (2.6) | 3.640 (0.427) | 0.837 (0.025) |
| 8.664 | 6.1 (0.4) | 0.415 (0.064) | 0.200 (0.008) |
| 11.278 | 21.9 (1.0) | 1.360 (1.011) | 0.450 (0.260) |
| LineaaBecause [Ar iii] and [Ar ii] are seen only in the low-resolution spectra, we do not give their parameters here. | EionbbIonization potential. | Nominal | FittedccRest wavelength, corrected for . | IntegratedddStandard deviations of repeated measurements are given in parentheses. The true uncertainty including calibration is probably 20%. | EquivalentddStandard deviations of repeated measurements are given in parentheses. The true uncertainty including calibration is probably 20%. | FWHMddStandard deviations of repeated measurements are given in parentheses. The true uncertainty including calibration is probably 20%. |
|---|---|---|---|---|---|---|
| Wavelength | Wavelength | Flux | Width | |||
| (eV) | (µm) | (µm) | ( W m-2) | (µm) | (µm) | |
| [S iv] | 34.8 | 10.511 | 10.512 | 3.4 (0.15) | 0.27 (0.14) | 0.026 (0.0004) |
| [Ne ii] | 21.6 | 12.814 | 12.814 | 3.8 (0.3) | 0.14 (0.04) | 0.082 (0.062) |
| [Ne iii] | 41.0 | 15.555 | 15.556 | 10.77 (0.5) | 0.22 (0.01) | 0.035 (0.005) |
| [S iii] | 23.3 | 18.713 | 18.714 | 7.4 (0.5) | 0.13 (0.01) | 0.039 (0.0006) |
| [O iv] | 54.9 | 25.890 | 25.901 | 1.2 (0.3) | 0.02 (0.01) | 0.026 (0.005) |
| [S iii] | 23.3 | 33.481 | 33.480 | 10.85 (4.8) | 0.24 (0.10) | 0.055 (0.035) |
| Narrow component | Broad component | ||||
|---|---|---|---|---|---|
| Line | 100 | FWHM (Å) | 100 | FWHM (Å) | |
| 3868 [Ne iii] | 38.1 | 3.5 | 52.5 | 8.5 | |
| 3889 He i+H8 | 16.6 | 2.6 | 11.8 | 6.1 | |
| 4102 H | 23.8 | 2.6 | 20.7 | 6.7 | |
| 4340 H | 42.2 | 2.6 | 42.5 | 6.7 | |
| 4363 [O iii] | 31.2 | 7.6 | |||
| 4471 He i | 4.3 | 2.8 | 8.6 | 8.4 | |
| 4686 He ii | 11.4 | 31.7 | |||
| 4861 H | 100.0 | 2.6 | 100.0 | 7.6 | |
| 4959 [O iii] | 126.0 | 2.7 | 69.2 | 6.6 | |
| 5007 [O iii] | 399.6 | 2.9 | 175.9 | 7.5 | |
| CLOUDY ModelsbbFluxes are calculated assuming the distance = 21.7 Mpc. | |||||
|---|---|---|---|---|---|
| Line | Observ. | Model I | Model IaccModel Ia is the same as Model I except that the radius of the modeled H ii region is 410 pc (log = 21.1) instead of 580 pc. | Model I/Obs. | Model Ia/Obs. |
| 3727 [O ii] | 36.7 | 73.3 | 33.8 | 2.00 | 0.92 |
| 3868 [Ne iii] | 15.7 | 15.0 | 14.5 | 0.95 | 0.93 |
| 4363 [O iii] | 4.3 | 5.1 | 5.1 | 1.18 | 1.18 |
| 4861 H | 25.4 | 41.8 | 28.4 | 1.65 | 1.11 |
| 5007 [O iii] | 73.1 | 64.7 | 64.2 | 0.89 | 0.88 |
| CLOUDY ModelsbbFluxes are calculated assuming the distance = 21.7 Mpc. | Model/Observ. | ||||||||||
|---|---|---|---|---|---|---|---|---|---|---|---|
| Line | Obs. | Mod.I | Mod.II | AGN | WNE-w | ShockccShock velocity is 250 km s-1. | AddA=I+II. | BeeB=I+II+AGN. | CffC=I+II+WNE-w. | DggD=I+II+Shock. | |
| 10.5 [S iv] | 3.42 | 0.19 | 2.49 | 0.65 | 0.80 | 0.62 | 0.78 | 0.97 | 1.02 | 0.96 | |
| 12.8 [Ne ii] | 3.81 | 4.21 | 0.54 | 0.39 | 0.03 | 0.05 | 1.25 | 1.35 | 1.25 | 1.26 | |
| 15.6 [Ne iii] | 10.77 | 3.32 | 6.88 | 1.08 | 1.02 | 0.88 | 0.95 | 1.05 | 1.04 | 1.03 | |
| 18.7 [S iii] | 7.39 | 2.90 | 3.66 | 0.66 | 0.38 | 0.39 | 0.89 | 0.98 | 0.94 | 0.94 | |
| 24.3 [Ne v] | … | 0 | 0 | 0.34 | 0.12 | 0.18 | … | … | … | … | |
| 25.9 [O iv] | 1.19 | 0 | 0 | 1.12 | 1.05 | 0.93 | 0 | 0.94 | 0.88 | 0.78 | |
| 33.5 [S iii] | 10.85 | 3.33 | 5.21 | 0.88 | 0.55 | 0.56 | 0.79 | 0.87 | 0.84 | 0.84 | |