Subdiffusion and lateral diffusion coefficient of lipid atoms and molecules in phospholipid bilayers
Abstract
We use a long, all-atom molecular dynamics (MD) simulation combined with theoretical modeling to investigate the dynamics of selected lipid atoms and lipid molecules in a hydrated diyristoyl-phosphatidylcholine (DMPC) lipid bilayer. From the analysis of a s MD trajectory we find that the time evolution of the mean square displacement, , of lipid atoms and molecules exhibits three well separated dynamical regions: (i) ballistic, with for ; (ii) subdiffusive, with with , for ; and (iii) Fickian diffusion, with for . We propose a memory function approach for calculating over the entire time range extending from the ballistic to the Fickian diffusion regimes. The results are in very good agreement with the ones from the MD simulations. We also examine the implications of the presence of the subdiffusive dynamics of lipids on the self-intermediate scattering function and the incoherent dynamics structure factor measured in neutron scattering experiments.
pacs:
87.14.Cc, 87.16.Dg, 83.10.Mj, 83.85.HfI Introduction
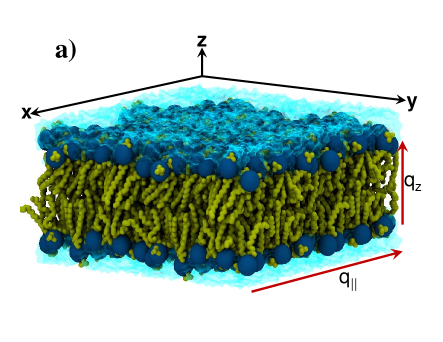
Lipids are polymer molecules composed of hydrophobic acyl chains attached to a hydrophilic polar head group. In the presence of a polar solvent (e.g., water) lipids can spontaneously self-assemble to form a bilayer membrane (Fig. 1). The fluid (Lα) phase of lipid bilayers behaves as a two dimensional (2D) fluid and the lateral 2D self-diffusion coefficient of individual lipids within a leaflet of the bilayer has been determined both experimentally by a variety of methods Pfeiffer et al. (1988); Tabony and Perly (1990); Vaz et al. (1985); Wennerstrom and Lindblom (1977); Kuo and Wade (1979); Shin et al. (1991); König et al. (1995); W.Pfeiffer et al. (1989); König et al. (1992); Almeida and Vaz (1995) and through computer simulations Falck et al. (2008); Wohlert and Edholm (2006); Doxastakis et al. (2007); Lindahl and Edholm (2001); Anezo et al. (2004); Patra et al. (2004); Klauda et al. (2006); Hofsäßet al. (2003); Falck et al. (2004). The experiments suggests that there are at least two relevant length/time scales associated with the lateral diffusion of lipids in a bilayer. Experiments designed to probe motion on picosecond (ps) time scales measure a diffusion coefficient that can be one to two orders of magnitude larger than the diffusion coefficient measured in experiments which probe motion on tens or hundreds of nanosecond (ns) time scales.
There have been several models used to explain the difference in the diffusion coefficients and . Vaz and Almeida Vaz and Almeida (1991) suggested a free-volume jump-diffusion model where the lipid moves in discrete steps when a void forms next to the lipid. After a jump, the lipid can either return to its original position or another lipid can jump into the empty space left behind. In this model, the short time diffusion coefficient is associated with the “rattling” motion of the lipid inside the “cage” created by the surrounding lipids. The jump diffusion mechanism was investigated by Falck et al. Falck et al. (2008) in a simulation of diyristoyl-phosphatidylcholine (DMPC) bilayers, and they did not observe enough jump events to provide evidence for the jump diffusion model. To explain their MD simulation results of a DMPC bilayer, Wohlert and Edholm Wohlert and Edholm (2006) proposed a model where the motion of the lipid in the plane of the bilayer can be regarded as diffusion (with a coefficient ) confined in a circular “cage” whose center undergoes free diffusion (with a coefficient ). The two diffusion coefficients obtained by fitting their simulated data to the analytical solution of this model were in reasonable agreement with the experimental values.
None of the above diffusion models explicitly take into account the microscopic polymeric structure of lipids, but effects of this structure has been observed in simulations. For example, Doxastakis et al. Doxastakis et al. (2007) observed in a MD simulation of 1,2-Dipalmitoyl-sn-Glycero-3-Phosphocholine (DPPC) bilayers that the atoms at the ends of the lipid tails fluctuate more than those in the head group, but the overall diffusion of the lipid is limited by the diffusion of the head group. This observation led them to examine a diffusion in a sphere model where the size of the sphere depends on the position of the chain. However, the authors describe this model as “not particularly accurate”, and the model was extended to include a distribution of spheres at each tail position.
The dynamics of the atoms in lipid molecules are more complex than those in ordinary liquids. In a simple liquid Hansen and McDonald (2006) atoms move ballistically at short times. Thus the mean square displacement (MSD) , which is followed by a crossover to Fickian diffusion, characterized by for long times. In dense fluids a caging effect, where the atoms are trapped by their neighbors, is observed between the ballistic and diffusive regimes, leading to a plateau in . In a lipid bilayer, the motion of lipid atoms is further complicated by the polymeric structure, characterized by connectivity and flexibility, of the lipids.
A more realistic description of the diffusion of lipids should be based on theoretical models designed for polymers. Two such theories are the Rouse model Strobl (2007) and the mode-coupling theory Chong and Fuchs (2002); Chong et al. (2007). In the Rouse model over-damped Brownian motion is assumed for the individual monomers with a harmonic potential connecting adjacent monomers. The motion is subdiffusive with then there is a crossover to diffusive motion at later times. The mode-coupling theory (MCT), generally used to study the dynamics of glass-forming liquids, has recently been extended for flexible macromolecules and polymers Chong and Fuchs (2002); Chong et al. (2007), though it has not been applied to study lipid bilayers to our knowledge. The MCT is a method used to approximately calculate space-time correlation functions (e.g., intermediate scattering function) by solving a set of integro-differential equations obtained from first principles. An important feature of the extended polymer version of the mode coupling theory is the prediction of a sub-diffusive region between the short time ballistic and the long time Fickian diffusion regimes. Specifically, the theory predicts , with typically between 0.5 and 0.65. Besides other parameters, the exponent depends on the length of the polymer chain and approaches 0.5, the Rouse limit, for an infinite chain of identical monomersChong and Fuchs (2002); Chong et al. (2007). Since the only input to the theory is the static structure, the subdiffusion predicted by the extended MCT is due to the polymeric structure and not to the specifics of the interactions. Thus, one expects that the dynamics of the atoms in a lipid bilayer should exhibit a pronounced sub-diffusive regime before it crosses over to normal Fickian diffusion. We argue that the extended sub-diffusive region in the MSD is the cause of the difference between the experimentally measured diffusion coefficients and .
In this paper, we report an extensive computational investigation of the complex dynamics of both individual lipid atoms and entire lipid molecules in the fluid phase of a hydrated DMPC bilayer by employing a microscopic description of the system. Our study is based on a s long all atom molecular dynamics (MD) simulation of the DMPC bilayer. By calculating the time evolution of the mean square displacement of lipid atoms in the plane of the bilayer for a time interval ranging from s to s, we identify the short time ( ps) ballistic region, the long time ( ns) Fickian diffusion region, and in between an extended subdiffusive region characterized by a power law , with . We find that depends on the atom type and, most importantly, on its position within the lipid molecule. The dynamics is different for atoms in the lipid tail versus atoms in the head group. We also examine the implications of the heterogeneous subdiffusion of the individual atoms on the diffusion of the lipid molecule as a whole, and on the interpretation of neutron scattering experiments.
This paper is organized as follows. In Sec. II we describe our MD study of a solvated DMPC lipid bilayer. In Sec. III we provide a detailed numerical and theoretical study of the mean square displacement of lipid atoms and lipid molecules. In Sec. IV we examine the implications of this study for the incoherent intermediate scattering function, and the dynamic structure factor that is measured in neutron scattering experiments. Lastly, in Sec. V we present a discussion and our conclusions.
II MD Simulation of DMPC Bilayer
To investigate the dynamics of selected lipid atoms and of entire lipid molecules, we performed a s long all atom MD simulation of a fully solvated DMPC lipid bilayer (Fig. 1). The pre-equilibrated structure of the bilayer was obtained from Mikko Karttunen’s web site (www.apmaths.uwo.ca/mkarttu/downloads.shtml) Gurtovenko et al. (2004) and contained 128 lipid molecules. The system was solvated by adding two 11 Å thick layers of water to each side of the membrane using the Solvate plugin in VMD Humphrey et al. (1996). The final system contained a total of 2577 TIP3 Jorgensen et al. (1983) water molecules. The MD simulation was performed with NAMD-2.6 Phillips et al. (2005) using the CHARMM27 Feller and MacKerell (2000) force field. The equations of motion were integrated with a multiple time step algorithm with time steps of 1 fs for bonding interaction, 2 fs for non-bonding interactions, and 4 fs for long-range electrostatic interactions. The non-bonded interactions were cutoff at 12 Å with a smooth switching function starting at 10 Å. Long-range electrostatic interactions were computed by employing the smooth Particle Mesh Ewald method Essmann et al. (1995) with a grid spacing of 1 Å.
The system was brought to K and normal pressure ( atm) through several stages of equilibration. First, the system was subjected to energy minimization steps by harmonically restraining the phosphorous (P) atoms of the lipid headgroups along the normal direction to the surface of the membrane. Next, the system was gradually heated to the desired temperature K during a 0.5 ns period. After removing all the restraints, the system was equilibrated through a 75 ns long NpT simulation. At the end of this process the area per lipid (APL) was 56.2 Å2. To increase the APL to the desired value of Å2, we performed NVT simulations and gradually increased the size of the system in the -plane of the membrane. The final system size was Å3, with an APL of Å2. The equilibration process was concluded with an additional 10 ns NVT simulation.
A production run of s was performed in the NVT ensemble. We employed a Langevin thermostat with a coupling constant of 0.05 ps-1. The coordinates of all the atoms were stored every 2 fs for the first 100 ps, then saved every 20 fs for the next 10 ns, then every 100 fs for the next 90 ns. This allowed us to study the short, intermediate, and long time dynamics of the individual atoms and lipids. A snapshot of the lipid bilayer system is shown in Fig. 1a. The MD simulations were carried out on 40 CPUs of a dual core 2.8GHz Intel Xeon EM64T cluster with a performance of around 0.2 days/ns.
III Mean Square Displacement
In this section we examine the time dependence of the lateral mean square displacement (MSD) of selected atoms within a lipid, and of entire lipids within the bilayer. We compare the results with the general predictions of the extended MCT for polymers Chong and Fuchs (2002); Chong et al. (2007), and we propose a memory function method capable of describing the time dependence of MSD in lipid bilayers.
We begin by outlining some of the qualitative predictions of the extended MCT for polymers. To derive the extended mode coupling equations, one first applies the Mori-Zwanzig projection operator formalism in the so called site-site formalism. This leads to a set of coupled integro-differential equations for monomer density fluctuations. The MCT is a set of approximations of the memory kernel that permits the corresponding integro-differential equations to be numerically solved with the only input being the static structure. The monomer and the polymer center of mass MSD can be computed from the solution of the mode-coupling equations from the small wave-vector, , limit (see Ref. Chong et al., 2007 for details). For the MSD for monomer , the MCT predicts an initial ballistic region where . After the ballistic regime, the growth of the mean square displacement is suppressed due to a local caging effect caused by the trapping of the polymer by its neighbors. At larger times there is a crossover to Fickian diffusion with , where is the dimension of the system and is the long time self diffusion coefficient for the monomer. In this crossover region there is a sub-diffusive region where with . The value of is smaller for longer chains and has a limiting value of 0.5 for an infinitely long chain. Note that the sub-diffusive region is absent for simple liquids, and is a polymer specific feature.
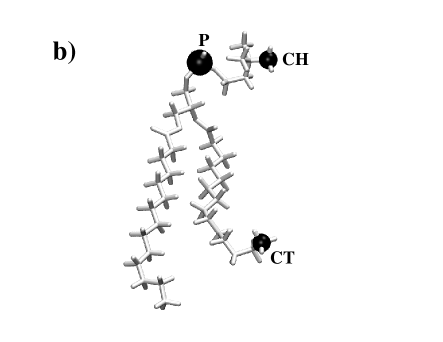
To test the MCT predictions for the lipids, we examined the motion of three representative atoms in the lipid (see Fig. 1b), namely the phosphorous (P), the carbon C15 (CH) atoms in the lipid head group, and the carbon atom C214 (CT) located at the end of one of the lipid tails. Because the surroundings of the head group atoms is different from those in the lipid tails, we expect that the MSD of the P and CH atoms will show distinctive features from that of the CT atoms. Shown in Fig. 2 is the time evolution of the lateral MSD of the P atom (squares) on a log-log scale, which follows the qualitative predictions of the MCT. Specifically, an initial ballistic region is followed by a narrow caging region that gradually crossover to linear diffusion through an extended sub-diffusive region characterized by , with .

Also plotted in Fig. 2 is the MSD for the CH (triangle) and CT (circles) atoms. The ballistic, the sub-diffusive, and the diffusive time scales are identifiable for all the atoms. The MSD in the ballistic regime is the same for CH and CT since they have the same mass and are at the same temperature, but their mean square displacements differ starting in the caging region. The MSD for CT is larger than that of CH, which indicates that the size of the cage is larger for atoms at the end of the tail than atoms close to the head group. This difference is a direct consequence of the structure of the lipid bilayer, and has been observed in previous simulations Doxastakis et al. (2007); Wohlert and Edholm (2006).
For all the atoms the crossover to Fickian diffusion begins around 10 ns and Å2, which approximately corresponds to the nearest neighbor distance of the lipids ( Å). Thus the linear diffusion can be observed only after the lipid has moved around one lipid diameter.
To determine the power-law exponent for atom in the sub-diffusive region, we calculated
| (1) |
and averaged the result from ns to ns, the region where is approximately constant. The result for for the center of mass (CM) of the lipids is shown in the inset to Fig. 2. The horizontal lines in the inset correspond to the ballistic (), sub-diffusive () and Fickian diffusion () regimes. The value of depends on the atom type and ranged from for the CM to for CT, the carbon atom at the end of the tail. The dynamics in the ps time scale strongly depends on the position of the atom within the lipid. The atoms at the end of the lipid tails have more freedom to move, and hence a larger cage. However, these atoms are connected to those within the head group, which ultimately determine their diffusion on long time scales.
For ns, for each of the individual atoms ( P, CH, CT) and the center of mass, thus the lipids appear to be undergoing Fickian diffusion. We calculated the diffusion coefficient by fitting for ns to a straight line. The diffusion coefficients (-msd) are shown in Table 1, and their values range between cm2s-1 and cm2s-1. These values are within statistical error and are close to the diffusion coefficient of the CM. However, these diffusion coefficients are almost a factor of two larger than the value of cm2s-1 obtained from FRAP measurement Almeida and Vaz (1995) of DMPC at 34∘C. This difference may be due to a combination of several factors, e.g., imperfection of the empirical CHARMM27 force field used in the MD simulations, discrepancy between the APL of the experimental and the simulated systems, finite size of the DMPC bilayer system and insufficient sampling. However, the fact that we have obtained similar long time diffusion coefficient for all lipid atoms indicates that our MD trajectory is sufficiently long to capture the linear diffusion regime.
| atom | -msd | -theory |
|---|---|---|
| CT | 1.67 cm2 s-1 | 1.25 cm2 s-1 |
| CH | 1.27 cm2 s-1 | 1.15 cm2 s-1 |
| P | 1.30 cm2 s-1 | 1.07 cm2 s-1 |
| CM | 1.46 cm2 s-1 | 1.06 cm2 s-1 |
We propose an approach based on the Zwanzig-Mori projection operator method to model the MSD, , for a lipid atom in terms of five fitting parameters. We start from the equation of motion for the density, , autocorrelation function of a tagged atom at wave-vector Hansen and McDonald (2006)
| (2) |
Here , is the Boltzmann’s constant, is the temperature, is the mass of atom , and is the memory kernel. In general, MCT refers to an approximation for . The equation of motion for the MSD in 2D can be obtained from which gives
| (3) |
where .
We propose the following ansatz for the memory function
| (4) |
where is the Dirac delta function. The physical meaning of the fitting parameters , , , and are clarified next.
If , then Eqs. (3)-(4) describe the free diffusion of a Brownian particle with a diffusion coefficient . Indeed, when , Eq. (3) can be solved analytically and . For , corresponding to the ballistic regime, while for corresponding to the Fickian diffusion regime. To illustrate the crossover between these two limiting cases we plotted defined by Eq. (1), Fig. 3. For free diffusion changes smoothly from (ballistic dynamics) to (Fickian diffusion) as shown in Fig. 3 (dot-dashed line) for fs.
By neglecting the power-law term in the memory kernel and setting , can be calculated analytically, though the expression is too cumbersome to be shown here. In this case, first the MSD crosses over from the ballistic regime (for ) to a caging region (for ) characterized by a plateau in (with ) as shown in Fig. 3 (dashed curve). Then there is a crossover from the caging to the Fickian regimes that takes place around . The extent of the caging region is determined by the difference between the two time scales and .
The power-law term in the memory kernel, Eq. (4), is responsible for the anomalous subdiffusion in the MSD. To illustrate we have numerically calculated the MSD and the corresponding for . As shown in Fig. 3 (long-dashed curve), in a broad time interval centered around ps and extending over four decades, the dynamics slowly crosses over from ballistic to sub-diffusive (with ) behavior.
To capture all the features of the mean square displacement of lipid atoms in a bilayer membrane one needs to consider the full kernel (4) with all three time scales. A representative result for obtained with the proposed memory function method is shown in Fig. 3 (solid line).
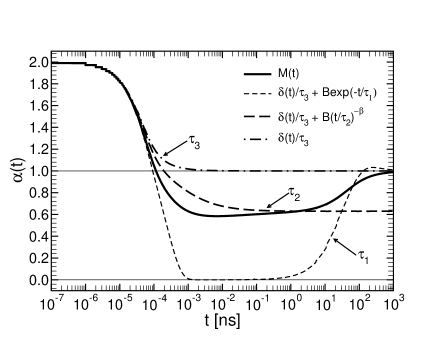
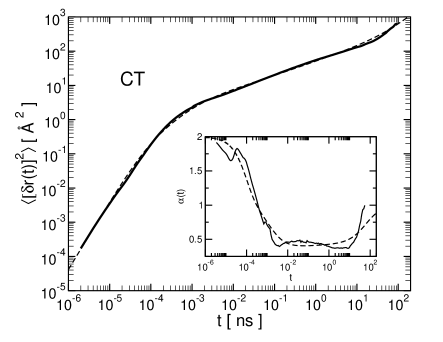
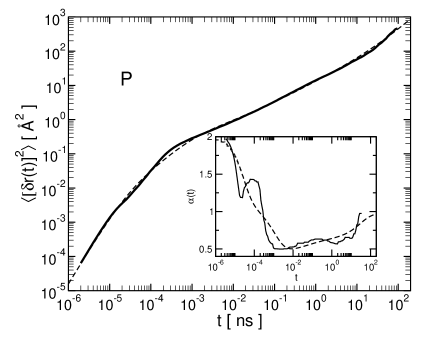
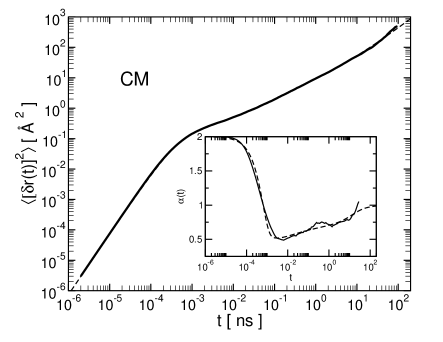
Based on the above analysis, one can identify , , and as the characteristic time scales for the crossover from the subdiffusion to Fickian diffusion region, the onset of the subdiffusion regime, and the crossover from ballistic to caging region, respectively. To determine the times , , and we performed a least squares fit using Eqs. (3) and (4) to . The fits are shown in Fig. 4 and the fit parameters are given in Table 2. The inset to the figures show the corresponding for the fits and calculated from the MD simulation. For all the individual atoms there are features in for ps that are not captured by our memory function method. The crossover to Fickian diffusion also appears to be sharper in the simulations than predicted by the theory. However, the memory function theory fits the MSD from MD simulation well for over eight decades in time.
The three time scales are separated by at least an order of magnitude, and define three clearly separated dynamical regimes of the lipid bilayer system. The short time scale characterizes the crossover between the ballistic and caging regions. The intermediate time scale defines the onset of the sub-diffusive region. Finally, the long time scale identifies the crossover from subdiffusion to Fickian diffusion.
| Atom | B (ps-2) | (ns) | (ps) | (fs) | |
|---|---|---|---|---|---|
| P | 83.2 | 19.99 | 2.16 | 5.62 | 0.70 |
| CH | 217 | 38.26 | 0.411 | 6.64 | 0.60 |
| CT | 42.9 | 47.02 | 0.335 | 18.1 | 0.44 |
| CM | 10.4 | 9.38 | 1.14 | 91.4 | 0.75 |
We conclude this section by noting that the memory function approach provides another means to calculate the diffusion coefficient . Inserting (valid in the Fickian diffusion regime) into Eq. (3), one finds that
| (5) |
The diffusion coefficient should be independent of the atom used in the calculations. The diffusion coefficients (-theory) for the P, CH, CT atoms and the center of mass calculated using Eq. (5) are given in Table 1. These values are in good agreement with those determined directly from the MD simulation, but are systematically smaller. Furthermore, like the fits to the asymptotic behavior of the MSD, they are nearly equal. Note that the fitting parameters differ by an order of magnitude for different atoms in the lipid, but the long time diffusion coefficient is the same for all the atoms.
IV Incoherent Intermediate Scattering Functions
To understand the implications of the large sub-diffusive region in the analysis of neutron scattering experiments, we examined the self (incoherent) intermediate scattering function (SISF) for different atoms in the lipid and the lipid center of mass. We start this section with some theoretical background that relates the moments of atomic displacements with the SISF in terms of a cumulant expansion. Next, we examine the viability of the second (Gaussian) and fourth order cumulant approximations for calculating the SISF for the selected atoms studied in Sec. III. This will allow us to quantitatively relate the MSD to the SISF and the interpretation of neutron scattering data. Finally, we perform the same analysis for the lipid hydrogens, which dominate the incoherent neutron signal.
IV.1 Background and Theory
The differential cross section of the quasi-elastic scattering of neutrons in a solid angle with an energy transfer can be expressed as Lovesey (1984)
| (6) |
where are atom-type indices, while [] and [] are, respectively, the incoherent [coherent] scattering length and dynamic structure factor. contains information about the single particle motion of nuclei of type , and in principle it can be used to determine the self diffusion coefficient .
In a computer simulation, is obtained from the Fourier transform of the SISF
| (7) |
where the summation goes over all atoms of type in the system. Note that the only difference between and , discussed in Sec. III, is that is defined for a subset of atoms with the same scattering length, while is defined for a single tagged atom. The fourth order cumulant expansion of Eq. (7) reads
| (8) |
where
| (9) |
Equations (IV.1) and (9) express the SISF is terms of the MSD and the non-Gaussian parameter . If the distribution of lateral displacements of the lipid atoms is Gaussian in space, then
| (10) |
For 2D Fickian diffusion , is Gaussian in space, and
| (11) |
Note that, while the distribution function of the displacements of atoms that undergo Fickian diffusion is Gaussian (having a width that increases as the square root of time), the converse in not true in general.
The dynamic structure factor corresponding to the SISF given by Eq. (11) is a Lorentzian Hansen and McDonald (2006)
| (12) |
which is the basis of evaluating the diffusion coefficient from neutron scattering experiments. To determine the diffusion coefficient, it is generally assumed that the translational motion of the lipid is decoupled from other motions of the atoms within the lipid (e.g., vibrations, rotations, conformational changes, etc.). The resulting is a convolution of these other motions with Eq. (12). From the above discussion, however, it should be clear that the reliable experimental determination of the diffusion coefficient based on Eq. (12) is possible only when the MSD of the lipid atoms and/or the lipid center of mass increases linearly in time.
IV.2 Individual Atoms
In this sub-section we calculate the SISF for the P, CH and CT atoms in the lipid, and examine the validity of the expansion given by Eq. (IV.1) for these atoms. This analysis will give insight into the different dynamics along the lipid and aid in the analysis of the dynamics of the hydrogen atoms discussed in the next sub-section.
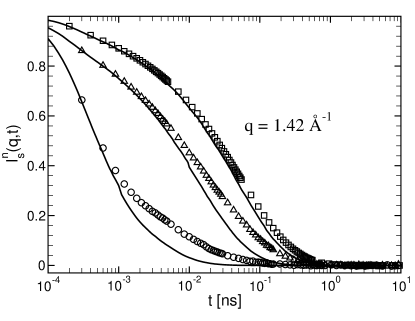
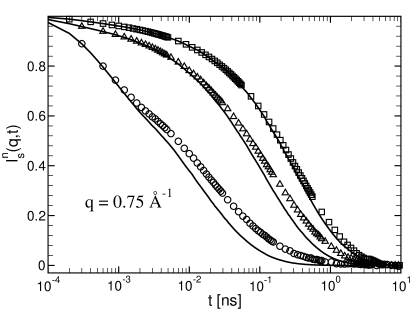
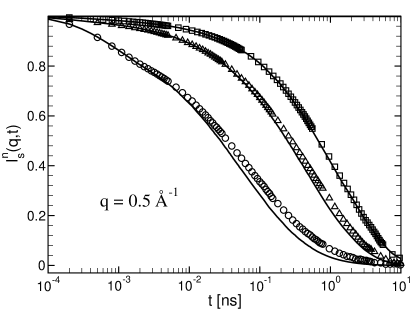
Shown as symbols in Fig. 5 is for Å-1 calculated for the selected P, CH and CT atoms. The peak in the static structure factor for the lipid tails (head groups) occurs around Å-1 (Å-1). The Gaussian approximation (solid lines), Eq. (10), of the SISF appears to be excellent for the P atoms (open squares) for all values considered, but noticeable deviations are present for the carbon (CH and CT) atoms. Note, however, that as decreases the Gaussian approximation becomes increasingly better for the carbon atoms as well.
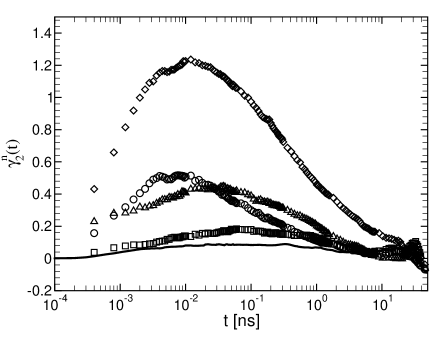
In order to quantify how well the distribution function of the lateral displacements of lipid atoms of type can be approximated by a Gaussian, we calculate the non-Gaussian parameter given in Eq. (9). Shown in Fig. 6 are for the atoms P, CH, CT, for all the carbon atoms within the lipid, and for the center of mass of the lipids. For the carbon atoms, there is a peak in around the beginning of the sub-diffusive region in the MSD, (i.e., ps). The peak heights for CH and CT atoms are at least a factor of three smaller than when the displacements are averaged over all the carbon atoms. For times when is small, Eq. (10) is a good approximation, which can be seen by comparing Figs. 5 and 6. Furthermore, it is evident that the approximation given by Eq. (10) is very poor when applied to the average of the displacements of all the carbon atoms within the lipid. Notice that when ns for all , which is the time scale for the crossover to the linear region in the MSD ( in Table 2) found in Sec. III.
We examined the approximation given by Eq. (IV.1) for CT, the atom with the largest value of . Note that for short and long times is approximately Gaussian is space, which is evident by the small values of the non-Gaussian parameter for these times (see Fig. 6). For intermediate times that correspond to the subdiffusion dynamics, is finite (especially for the carbon atoms) and, according to Eq. (IV.1), one expects noticeable deviation from the Gaussian approximation, Eq. (10). A comparison between the direct calculation, the Gaussian approximation given by Eq. (10), and the first non-Gaussian correction given by Eq. (IV.1) of the SISF for the CT atoms is shown in Fig. 7 for two scattering vectors Å-1 and Å-1. The figure shows that the first correction term matches very well the direct calculation of for all and both values, while the Gaussian approximation is rather poor for intermediate times.
Because of the relationship between the MSD and the SISF given by Eq. IV.1, one may conclude that the stretched exponential form of is an intrinsic property originating from the polymer nature of the lipid molecules. For values when is close to a Gaussian, the SISF for lipid atoms can be well approximated by Eq. (10). This agreement, combined with the behavior of the MSD from Sec. III and the small values of for all , suggests that the decay of the SISF for the phosphorus (P) atoms should be well described by a Kohlraush-William-Watt (KWW) function . The parameters and have a nontrivial dependence. Larger corresponds to smaller displacements and, hence, a shorter time scale. Smaller probes displacements over larger length scales, thus it corresponds to dynamics on longer time scales. From Eq. (10) and the fits to from Section III, we expect that for a range of values, and we determine this range later in this section. For the SISF crosses over to the simple exponential form characterized by . However, this Fickian diffusion regime can be observed only for small values, which computationally are quite expensive to reach due to the long MD simulation time required to calculate the decay of the SISF. Thus, in most all-atom MD simulations the mainly explored dynamic region is the sub-diffusive one.
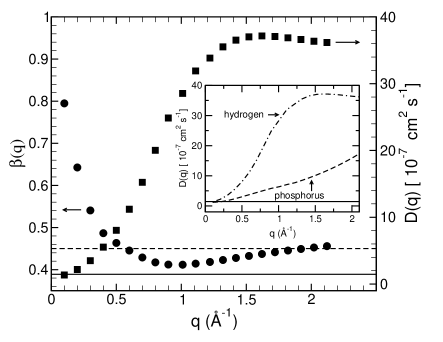
To examine the dependence of , and we fit the SISF calculated for the P atoms for to . Shown in Fig. 8 is (circles and left axis). For Å-1, we found (dashed line), which is in agreement with the exponent calculated from Eq. (1) (i.e., the sub-diffusive exponent of the MSD). For smaller values, increases sharply towards the value . Note that the diffraction peak for the lipid head groups has been observed to be around Å-1, which corresponds to the lipids being separated by approximately Å. However, the stretched exponential fits yield only for Å-1, which corresponds to a length scale of Å, around nine DMPC lipid diameters. Notice that is approximately equal to the exponent for the sub-diffusive dynamics of the lipids for values around the diffraction peak for the lipid head group.
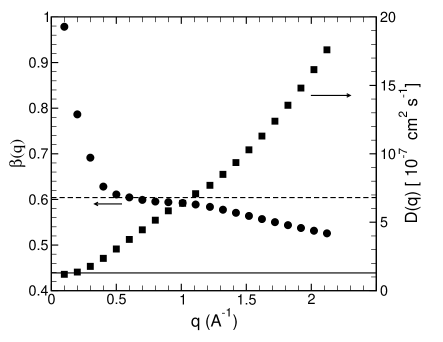
In the limit, is equal to the lateral self-diffusion coefficient obtained from the asymptotic behavior of the MSD. is also shown in Fig. 8 (squares and right axis) from the results of the fits to for the P atoms. Shown as a solid line in Fig 8 is the value of the diffusion coefficient -msd given in Table 1 for the atoms. It should be noted that, after a steep decrease with , in Fig 8 seems to level off for Å-1 and is close to the value obtained from the linear fit to the MSD for the Phosphorus atom and the center of mass.
IV.3 Lipid Hydrogen Atoms
According to Eq. (6) the quasi-elastic scattering signal is modulated by the scattering cross-sections and . To determine one has to measure the incoherent dynamic structure factor, which is dominated by the hydrogen atoms in the lipids. Therefore, we examine calculated for all the hydrogen atoms in the lipids.
The light hydrogen (H) atoms follow the motion of the heavy atoms. However, being covalently bound to the heavy atoms in the lipid, the H-atoms also perform vibrations and rotations about these atoms. Thus, one expects that deviates (especially at shorter times) noticeably from for the carbon, phosphorus, or oxygen atoms. Nevertheless, should have similar characteristics in that stretched exponential relaxation is expected for and there should be a crossover to exponential relaxation for small enough . Furthermore, we found that on ps time scales the dynamics of the lipid atoms depend on the location of the atom in the lipid . Thus, the motion of the hydrogen atoms will also depend on the location of the atom within the lipid in the ps time scale. In this section we examine what can be learned from the SISF about the dynamics of the hydrogens and the lipids.
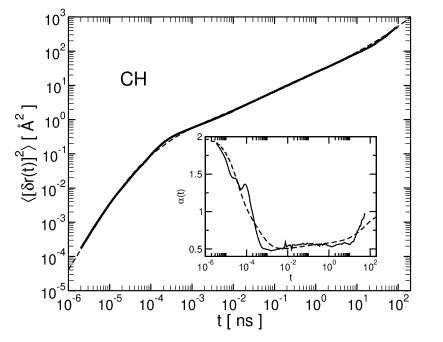
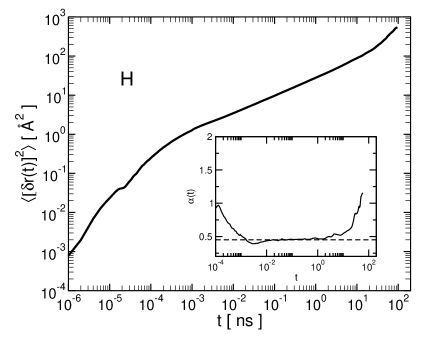
Shown in Fig. 9 is the MSD calculated using all the lipid hydrogens. The short time ballistic, the sub-diffusive region, and the diffusive region are clearly seen. Also shown in the figure is given by Eq. (1), and we find (dashed line in the inset). It is important to realize that this value of is much different than for the center of mass.
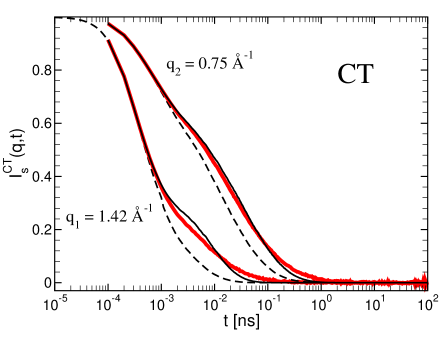
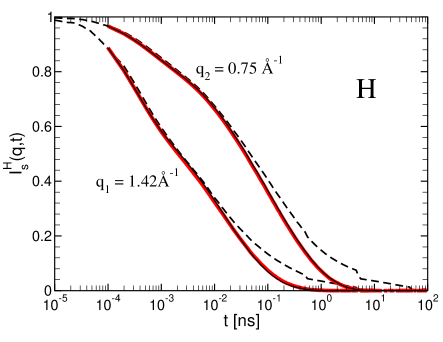
Shown in Fig. 10 is the direct calculation of (solid line), the Gaussian approximation given by Eq. (10) (dashed line), and the expansion given by Eq. (IV.1) (red line) for wave-vectors around the diffraction peak for the lipid tails ( Å-1) and for the lipid head group ( Å-1). For the H-atoms the Gaussian approximation, Eq. (10), is rather poor in the to range, but the first non-Gaussian correction, Eq. (IV.1), is a very good approximation for all times.
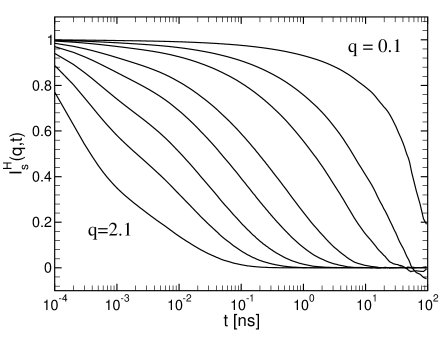
Shown in Fig. 11 is for several values of . For large there appears to be two stages to the decay of , namely an initial faster decay that is very nearly exponential, and a slower decay that is best described by a stretched exponential for ps, i.e., when the sub-diffusive behavior begins in the MSD (see Fig. 9). For this analysis we will focus on the slower decay. Again, we fit , for , to and the results for and are shown in Fig. 12.
For Å-1 (the peak value for the static structure factor for carbon atoms in the lipid tails) we found , which is close to but lower than the value of obtained from the MSD through Eq. (1) (dashed line). For the distances corresponding to these values, the lipid is undergoing sub-diffusive motion, Fig. 2. For , rapidly increases to a value close to one, and appears to be leveling off, but our simulations are to short to accurately obtain the asymptotic value. The solid line in the figure corresponds to -msd cm2 s-1 obtained from a linear fit to the MSD for the center of mass. increases faster with for the calculation using all the hydrogens than for the P atoms (see inset to Fig. 12), but, as expected, the two approach the same value for smaller . For small , is independent of the atoms used in the calculation, and it is from these values of where the diffusion coefficient should be obtained.
By looking at for the phosphorus and hydrogen atoms a clear pattern emerges. The diffusion coefficient obtained from the relaxation time would appear to be larger when determined from larger values of and for shorter times. We examined the literature to determine if this observation is compatible with experimental findings, and some indicative results are shown in Table 3 for 1,2-Dipalmitoyl-sn-Glycero-3-Phosphocholine (DPPC). DMPC and DPPC are often used as model systems. While DPPC has slightly larger acyl chains, as compared to DMPC (16 to 14 C atoms), our results for DMPC should be comparable to those for DPPC, showing the same trends. By comparing experiments that differ by only the range (experiments 2 and 3) we see that the larger is found for the larger . If we compare experiments that differ by basically the time scale involved (experiments 1 and 2) the associated is larger for the shorter time scale. While the listed are not comparable with our calculated , the experiments are in qualitative agreement with our analysis.
| Experiment | Technique | T | length scale | time scale | |
|---|---|---|---|---|---|
| 1 König et al. (1995) | QENS (IN5) | 45-55 ∘C | 0.2-1.6 Å-1 | 66 ps (63 eV) | cm2/s |
| 2 W.Pfeiffer et al. (1989) | QENS (IN10) | 41 ∘C | 0.07-2 Å-1 | 5 ns (0.8 eV) | 1.8 cm2/s |
| 3 König et al. (1992) | QENS (IN10) | 41 ∘C | 1-2 Å-1 | 5 ns (0.8 eV) | 1.6 cm2/s |
V Conclusions
In spite of extensive literature dealing with the experimental and computational study of the dynamics of lipid bilayers, the determination of the lateral self-diffusion coefficient of lipid molecules in the membrane remains a controversial problem. The results for appear to depend significantly on the time and length scales probed by the employed measurement or computational method. This observation prompted researchers to propose different models that have been predominantly influenced by models of diffusion in dense fluids. However, lipid molecules are polymers, characterized by flexibility and connectivity, and their lateral diffusion in the leaflets of lipid bilayers is qualitatively different from the diffusion of molecules in dense fluids. This difference is reflected in the time dependence of the MSD. We observe a broad sub-diffusive region, not present in simple fluids, between the short time ballistic region and the long time Fickian diffusion region.
Here we developed a phenomenological memory function approach, which can be used to describe the behavior of the MSD of lipid atoms and molecules over the whole time interval spanning from the ballistic regime (t ) to the Fickian diffusion regime (t ). By fitting the mean square displacement, we were able to identify three clearly separated time scales that correspond to three different dynamic regimes in the lipid system. Overall, our memory function fits to the MSD matched remarkably well from the MD simulation. However, some features in the fairly broad crossover region between the ballistic and sub-diffusive regimes are missed by our approximation. Our memory function approach allows us to calculate the lateral self-diffusion coefficient of lipid atoms and molecules through Eq. (5), and shows that, while the dynamics of the different atoms are very different at ps time scales, the motion at is best described by simple diffusion.
We also investigated the consequence of the sub-diffusive behavior of the MSD by examining the first two terms in the cumulant expansion of the SISF. The first term is referred to as the Gaussian approximation and is exact if the probability distribution of the displacements is Gaussian. By calculating the first non-Gaussian correction, characterized by the parameter (Eq. 9), we found that is nearly Gaussian outside the sub-diffusive region. While for the P atoms and the center of mass of individual lipid molecules remained nearly Gaussian even in the sub-diffusive region, for the carbon and hydrogen atoms showed significant deviation from Gaussian in this region. Interestingly, a Gaussian distribution for the center of mass, whose width did not increase as the square root of time, for lipid displacements has been observed in previous simulations Lindahl and Edholm (2001); Wohlert and Edholm (2006).
When is Gaussian, the SISF (e.g., measured in inelastic neutron scattering (INS) experiments of protonated lipid membrane samples) can be expressed in terms of the MSD, Eq. (10). The sub-diffusive dynamics strongly influences the scattering from the lipids whenever the probing scattering vector, , and frequency, , correspond to lengths and times in the sub-diffusive regime of the lipid atoms and molecules. In this case the SISF can be fairly well fitted with a stretched exponential (KWW) function, . Note, however, that for a given the stretched exponential will not be able to reproduce the short (ballistic) and long (Fickian diffusion) time regimes. We examined the dependence of and . For the phosphorus atoms we find that for , which agrees with the exponent determined from the MSD.
We emphasize that in most INS experiments on lipid bilayers primarily one explores the sub-diffusive region and not the long time Fickian diffusion region, thus making the use of Eq. (12) inadequate. Therefore, it should come as no surprise that the values of the lipid lateral self-diffusion coefficient extracted from INS experiments using Eq. (12) have a strong dependence and generally overestimate the real obtained by other (e.g., FRAP) experiments.
Furthermore, it would be interesting to investigate the temperature dependence of the analysis presented in this paper. In some liquids, it has been observed that activated events become more pronounced as the temperature is lowered. It would be reasonable to expect a similar behavior in lipid membranes, thus the diffusion could change character at lower temperatures and in the gel phase. It is also unknown how the picture presented in this work would change in the gel phase of the lipid membrane. Since the tails of the lipids are aligned, do the lipids behave as if they are more rigid? This may change the sub-diffusive region dramatically. The addition of cholesterol or proteins to the lipids may also change the nature of the sub-diffusive region and dramatically change the dynamics of the lipids.
Acknowledgments
We gratefully acknowledge the computer time that was generously provided by the University of Missouri Bioinformatics Consortium. E.F. acknowledges partial support of NSF Grant No. CHE 0517709.
References
- Pfeiffer et al. (1988) W. Pfeiffer, G. Sclossbauer, W. Knoll, B. Farago, A. Steyer, and E. Sackmann, J. Phys. (France) 49, 1077 (1988).
- Tabony and Perly (1990) J. Tabony and B. Perly, Biochim. Biophys. Acta 1063, 67 (1990).
- Vaz et al. (1985) W. Vaz, R. Clegg, and D. Hallmann, Biochemistry 24, 781 (1985).
- Wennerstrom and Lindblom (1977) H. Wennerstrom and G. Lindblom, Quart. Rev. Biophys. 10, 67 (1977).
- Kuo and Wade (1979) A. Kuo and C. Wade, Bichemistry 18, 2300 (1979).
- Shin et al. (1991) Y. Shin, U. Ewert, D. Budil, and J. Freed, Biophys. J. 59, 950 (1991).
- König et al. (1995) S. König, T. Bayerl, G. Coddens, D. Richter, and E. Sackmann, Biophys. J. 68, 1871 (1995).
- W.Pfeiffer et al. (1989) W.Pfeiffer, T. Henkel, E. Sackmann, and W. Knorr, Europhys. Lett. 8, 201 (1989).
- König et al. (1992) S. König, W. Pfeiffer, T. Bayerl, D. Richter, and E. Sackmann, J. Phys. II France 2, 1589 (1992).
- Almeida and Vaz (1995) P. F. F. Almeida and W. L. C. Vaz, Handbook of Biological Physics (Elsevier Science, New York, 1995).
- Falck et al. (2008) E. Falck, T. Rog, M. Karttunen, and I. Vattulainen, J. Am. Chem. Soc. 130, 44 (2008).
- Wohlert and Edholm (2006) J. Wohlert and O. Edholm, J. Chem. Phys. 125, 204703 (2006).
- Doxastakis et al. (2007) M. Doxastakis, V. Garcia Sakai, S. Ohtake, J. Maranas, and J. de Pablo, Biophysical Journal 92, 147 (2007).
- Lindahl and Edholm (2001) E. Lindahl and O. Edholm, J. Chem. Phys. 115, 4938 (2001).
- Anezo et al. (2004) C. Anezo, H. de Vries, H.-D. Holtje, D. Tieleman, and S.-J. Marrink, J. Phys. Chem. B 107, 9424 (2004).
- Patra et al. (2004) M. Patra, M. Karttunen, M. Hyvonen, and I. Vattulainen, J. Phys. Chem. B 108, 4485 (2004).
- Klauda et al. (2006) J. Klauda, B. Brooks, and R. Pastor, J. Chem. Phys. 125, 144710 (2006).
- Hofsäßet al. (2003) C. Hofsäß, E. Lindahl, and O. Edholm, Biophys. J. 84, 2192 (2003).
- Falck et al. (2004) E. Falck, M. Patra, M. Karttunen, M. Hyvonen, and I. Vattulainen, Biophys. J. 87, 1076 (2004).
- Vaz and Almeida (1991) W. Vaz and P. Almeida, Biophys. J. 60, 1553 (1991).
- Hansen and McDonald (2006) J. Hansen and I. McDonald, Theory of Simple Liquids (Elsevier, 2006).
- Strobl (2007) G. Strobl, The Physics of Polymers (Springer-Verlag, Berlin, 2007).
- Chong and Fuchs (2002) S. Chong and M. Fuchs, Phys. Rev. Lett. 88, 185702 (2002).
- Chong et al. (2007) S. Chong, M. Aichele, H. Meyer, M. Fuchs, and J. Baschnagel, Phys. Rev. E 76, 051806 (2007).
- Humphrey et al. (1996) W. Humphrey, A. Dalke, and K. Schulten, J. Mol. Graphics 14, 33 (1996).
- Gurtovenko et al. (2004) A. A. Gurtovenko, M. Patra, M. Karttunen, and I. Vattulainen, Biophys J 86, 3461 (2004).
- Jorgensen et al. (1983) W. Jorgensen, J. Chandrasekhar, J. Madura, R. Impey, and M. Klein, J. Chem. Phys. 79, 926 (1983).
- Phillips et al. (2005) J. Phillips, R. Braun, W. Wang, J. Gumbart, E. Tajkhorshid, E. Villa, C. Chipot, R. Skeel, L. Kale, and K. Schulten, J Comput Chem 26, 1781 (2005).
- Feller and MacKerell (2000) S. Feller and J. MacKerell, J. Phys. Chem. B 104, 7510 (2000).
- Essmann et al. (1995) U. Essmann, L. Perera, M. L. Berkowitz, T. Darden, H. Lee, and L. G. Pedersen, J. Chem. Phys. 103, 8577 (1995).
- Lovesey (1984) S. Lovesey, Theory of Neutron Scattering from Condensed Matter (Clarendon Press, Oxford, 1984).