Colored extrinsic fluctuations and stochastic gene expression
Centre for Non-linear Dynamics, Dept. of Physiology, McGill University, 3655 Promenade Sir William Osler, Montreal, Quebec H3G 1Y6, Canada
Abstract
Stochasticity is both exploited and controlled by cells. Although the intrinsic stochasticity inherent in biochemistry is relatively well understood, cellular variation is predominantly generated by interactions of the system of interest with other stochastic systems in the cell or its environment. Such extrinsic fluctuations are non-specific, affecting many system components, and have a substantial lifetime comparable to the cell cycle (they are ‘colored’). Here we extend the standard stochastic simulation algorithm to include extrinsic fluctuations. We show that these fluctuations affect mean protein numbers and intrinsic noise, can speed up typical network response times, and explain trends in high-throughput measurements of variation. If extrinsic fluctuations in two components of the network are correlated, they may combine constructively (amplifying each other) or destructively (attenuating each other). Consequently, we predict that incoherent feedforward loops attenuate stochasticity, while coherent feedforwards amplify it. Our results demonstrate that both the timescales of extrinsic fluctuations and their non-specificity substantially affect the function and performance of biochemical networks.
Keywords
biochemical networks / extrinsic noise / intrinsic noise / stochastic simulation algorithm
Subject category
Computational methods / Metabolic and regulatory networks
Journal reference
Molecular Systems Biology 4:196 (6 May 2008). Supplementary information is available at the Molecular Systems Biology website (www.nature.com/msb).
Introduction
Biochemical networks are stochastic: fluctuations in numbers of molecules are generated intrinsically by the dynamics of the network and extrinsically by interactions of the network with other stochastic systems [Elowitz et al., 2002, Swain et al., 2002]. Stochastic effects in protein numbers can drive developmental decisions [Arkin et al., 1998, Suel et al., 2007, Maamar et al., 2007, Nachman et al., 2007], be inherited for several generations [Rosenfeld et al., 2005, Kaufmann et al., 2007], and have perhaps influenced the organization of the genome [Swain, 2004, Becskei et al., 2005]. Intrinsic fluctuations are generated by thermal fluctuations affecting the timing of individual reactions. Their magnitude is increased by low copy numbers. The source of extrinsic fluctuations, however, is mostly unknown [Kaern et al., 2005], although cell cycle effects [Rosenfeld et al., 2005, Volfson et al., 2006] and upstream networks [Volfson et al., 2006] contribute. Yet extrinsic fluctuations dominate cellular variation in both prokaryotes [Elowitz et al., 2002] and eukaryotes [Raser and O’Shea, 2004]. They are colored, having a lifetime that is not negligible but comparable to the cell cycle [Rosenfeld et al., 2005], and they are non-specific, potentially affecting equally all molecules in the system [Pedraza and van Oudenaarden, 2005]. They are thus difficult to model and their effects hard to predict [Volfson et al., 2006, Sigal et al., 2006, Geva-Zatorsky et al., 2006, Austin et al., 2006, Cox et al., 2006, Tsimring et al., 2006, Scott et al., 2006, Tanase-Nicola et al., 2006].
Intrinsic and extrinsic stochasticity can be measured by creating a copy of the network of interest in the same cellular environment as the original network [Elowitz et al., 2002]. We can then define intrinsic and extrinsic variables, and their fluctuations generate intrinsic and extrinsic stochasticity, or noise [Swain et al., 2002]. Intrinsic variables typically specify the copy numbers of the molecular components of the network. Their values differ for each copy of the network. Extrinsic variables often describe molecules that equally affect each copy of the network. Their values are therefore the same for each copy. Considering gene expression, the number of transcribing RNA polymerases is an intrinsic variable (it is different for each copy of the network), whereas the number of cytosolic RNA polymerases is an extrinsic variable (both copies of the network are exposed to the same cytosolic RNA polymerases).
Noise is quantified by measuring an intrinsic variable, for example, the number of proteins, for both copies of the network. Fluctuations of the intrinsic variable will have intrinsic and extrinsic components: intrinsic variables are themselves part of a stochastic system and that system interacts with other stochastic systems. Throughout we will use the term ‘noise’ to exclusively mean a measure of stochasticity, usually the coefficient of variation. Experimentally, the relative number of proteins can be quantified in living cells using fluorescent proteins [Elowitz et al., 2002, Raser and O’Shea, 2004, Ozbudak et al., 2002, Blake et al., 2003]. Denoting as the intrinsic variable (the number of proteins) for the first copy of the system and the equivalent for the second copy, then intrinsic noise is determined by a measure of the difference between and because intrinsic fluctuations cause variation in to be uncorrelated with that of . Extrinsic fluctuations, however, cause variation in and to be correlated because they equally affect both copies of the system. Extrinsic noise is a measure of this correlation and is determined by the cross-correlation function of and . The squares of the intrinsic and the extrinsic noise sum to give the square of the total noise of the intrinsic variable, which is defined as its coefficient of variation [Swain et al., 2002].
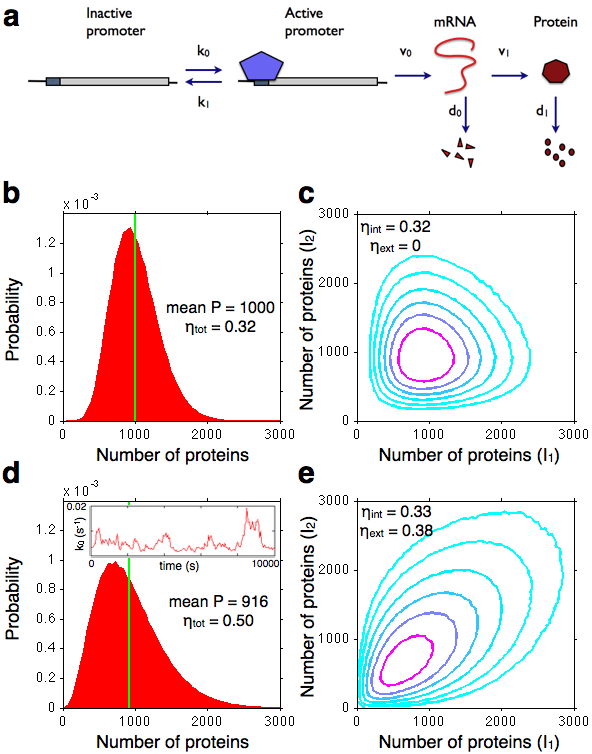
Here we consider the effects of extrinsic fluctuations on biochemical networks. Extrinsic fluctuations typically cause fluctuations in the parameters of a network [Paulsson, 2004]. For example, Fig. 1a shows a model of gene expression that includes promoter activation, transcription, translation, and degradation [Kepler and Elston, 2001, Kaern et al., 2005, Raser and O’Shea, 2004, Golding et al., 2005]. In this model, is the rate of translation. It is a function of the number of free ribosomes, an extrinsic variable, and will fluctuate as the number of free ribosomes changes. Extrinsic fluctuations have an average lifetime that is not zero (they are ‘colored’) [Rosenfeld et al., 2005]. We will show that this extrinsic timescale can profoundly affect the system’s dynamics and stochastic properties. It can determine the lifetime of protein fluctuations and change mean protein numbers. Extrinsic fluctuations being non-specific can act simultaneously on many parameters of the network. This non-specificity can cause fluctuations to combine constructively or destructively, dramatically altering the network’s output. For our simulations, we designed a novel extension of the standard algorithm for simulating intrinsic fluctuations [Gillespie, 1976] that includes discontinuous, time-varying parameters and therefore can simulate extrinsic fluctuations with any desired properties (Materials and methods).
Results
Extrinsic fluctuations alter mean protein numbers and intrinsic noise
Extrinsic fluctuations can substantially change the distribution of protein numbers. Fig. 1b shows the steady-state distribution of protein numbers for the model of Fig. 1a with no extrinsic fluctuations. It is slightly asymmetric and is expected to approximate a gamma distribution [Friedman et al., 2006]. Fig. 1c shows the corresponding joint probability distribution of and . Although the system is generally described by a probability distribution that includes all the intrinsic variables for the first copy of the network, all the intrinsic variables for the second copy, and all the extrinsic variables, a projection of this distribution onto and is sufficient for calculating noise [Elowitz et al., 2002]. With no extrinsic fluctuations, the distribution spreads parallel to the and axes (Fig. 1c): and are independent and have no correlation (). With extrinsic fluctuations, the mode and mean of the distribution of protein numbers can decrease, its variance increases, and there can be a longer tail at high numbers (Fig. 1d). Correspondingly, the probability distribution for and spreads along the line : and are now correlated through fluctuations in the extrinsic variable (here, the rate : Fig. 1d inset). Higher extrinsic noise would cause the distribution to spread along and tighten around the line . Higher intrinsic noise would cause the distribution to expand away from the line.
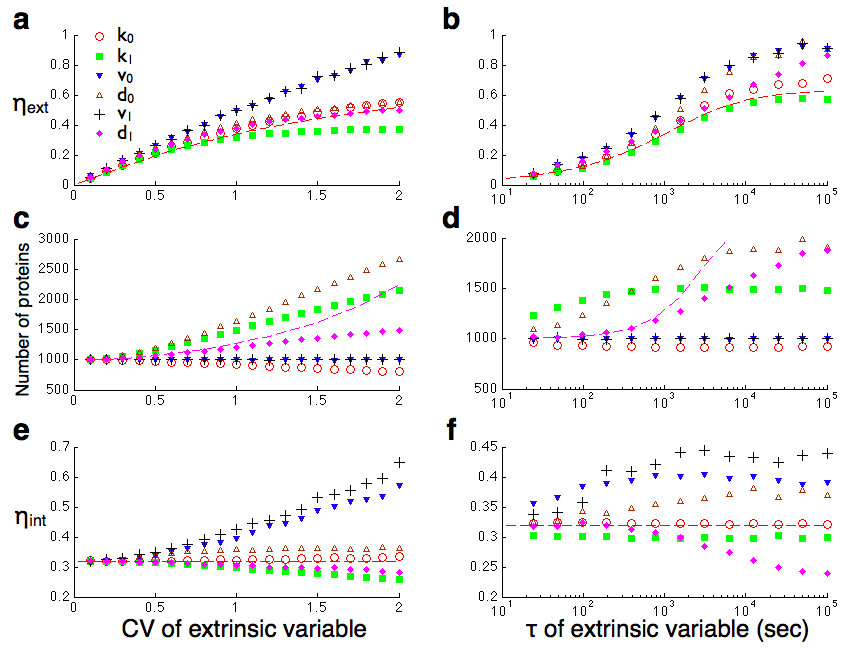
Changing the properties of extrinsic noise, its source, its magnitude and the typical lifetime of an extrinsic fluctuation (), can alter mean protein numbers and the intrinsic noise. The effect of extrinsic fluctuations is determined by both their coefficient of variation and their lifetime. As the coefficient of variation of any parameter in Fig. 1a increases, the extrinsic noise in protein numbers increases (Fig. 2a). Similarly, as the lifetime of extrinsic fluctuations increases, the extrinsic noise increases: extrinsic fluctuations that are fast compared to intrinsic fluctuations are averaged away and contribute little extrinsic noise (Fig. 2b). If the extrinsic fluctuations occur in a parameter that determines the lifetime of fluctuations in protein numbers, such as the protein degradation rate, then the extrinsic timescale mixes with the intrinsic timescales and the mean (and the mode) of the protein distribution can shift (Fig. 2c and 2d). Although this change in mean protein numbers implies that extrinsic fluctuations can change intrinsic noise, the change we observe is more than expected (Fig. 2e and 2f): if the translation rate, , fluctuates, the mean protein number changes little, but there is over a twofold increase in intrinsic noise. To understand this behavior, consider only the measured intrinsic variables and one extrinsic variable, say, then the system can be described by the probability distribution . Changing the properties of the extrinsic variable will change the shape of this three dimensional distribution and consequently its projection onto the and plane (Supplementary information). The intrinsic noise, which is determined by the and projection, can therefore vary with extrinsic fluctuations. We mathematically verified these conclusions for the model of Fig. 1a (Fig. 2 and Supplementary information).
Our approach also provides a general technique for stochastic sensitivity analysis because we apply fluctuations to parameters of the system [Stelling et al., 2004]. We can therefore determine, for example, the robustness of the concentration of the network output or any other network property to changes in parameter values. Sensitive parameters generate both a high intrinsic and a high extrinsic noise (a high total noise) in the property under investigation. Within our model, we predict that protein levels are most sensitive to fluctuations in the transcription and translation rates, and (Fig. 2a and Fig. 2e).
Extrinsic fluctuations can describe trends in high-throughput measurements
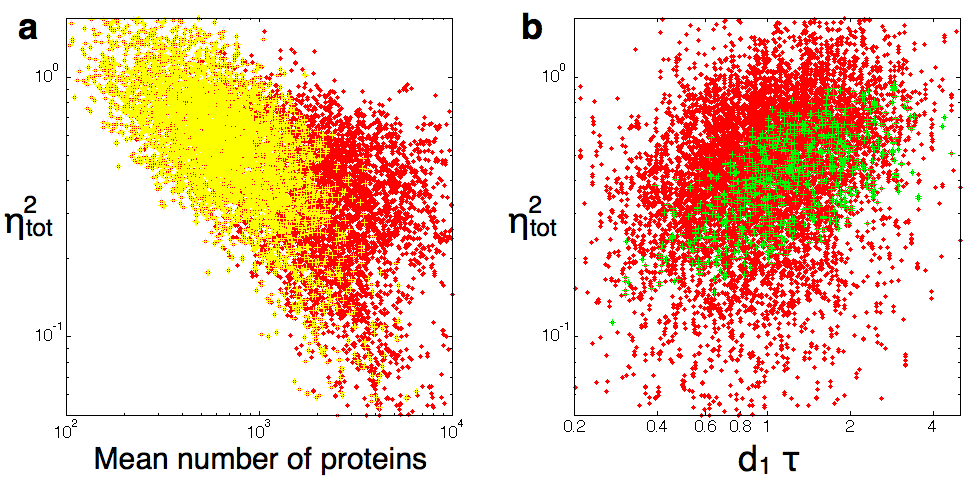
We can use these properties of extrinsic fluctuations to explain high-throughput measurements of stochasticity. Total noise in protein numbers scales with the inverse square root of mean protein number [Bar-Even et al., 2006, Newman et al., 2006]. Bar-Even et al. neglected extrinsic noise to explain this relationship, which is expected for intrinsic noise [Bar-Even et al., 2006]. We generated many models from the scheme of Fig. 1a by log-normally sampling its parameter set (Materials and methods). We simulated these models with substantial extrinsic fluctuations and found that the scaling is still apparent, because extrinsic fluctuations can change mean protein numbers and intrinsic noise (Fig. 3a). Our results imply that the high throughout measurements are consistent with other work which shows extrinsic noise to be dominant [Elowitz et al., 2002, Raser and O’Shea, 2004].
Extrinsic fluctuations can cause correlations between the lifetime of protein fluctuations and the extrinsic noise in protein levels, if they have the longest timescale in the system. The lifetime of protein fluctuations will then be determined by the lifetime of the extrinsic fluctuations. With the same simulations, we measure a significant correlation between the timescale of protein fluctuations and total noise (Fig. 3b). It arises because many of the models we simulate have extrinsic noise greater than intrinsic noise. The correlation is also evident in Fig. 2b. Indeed, time series studies in human cells have shown that the total noise to be correlated with the autocorrelation time of protein levels [Sigal et al., 2006].
Extrinsic fluctuations can affect the performance of genetic networks
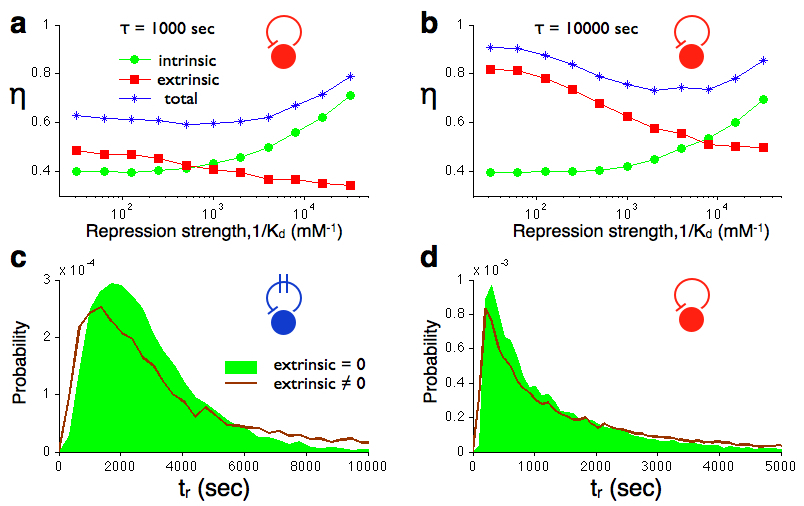
We next considered the effect of extrinsic fluctuations on one of the simplest regulatory networks: a negatively auto-regulated loop. Experiments suggest that total noise is attenuated by negative auto-regulation, at least for a plasmid-borne system [Becskei and Serrano, 2000]. Negative feedback reduces noise by increasing expression when protein numbers are low and decreasing expression when protein numbers are high. It also, however, reduces mean protein numbers. This reduction in protein copy numbers amplifies intrinsic noise and may surpass any attenuating effects (Fig. 4a and 4b). Extrinsic noise is mostly independent of protein numbers. It will therefore decrease with the addition of negative feedback. Consequently, the total noise of a constitutive system to which auto-negative feedback is added can either increase or decrease if intrinsic or extrinsic noise is larger (Fig. 4a and 4b). Consistently, experiments show a range of auto-repression strength for which noise minimization is optimal, although this observation was attributed to plasmid variation [Dublanche et al., 2006]. Our results suggest extrinsic fluctuations in any parameter of the system should create the same effect. We also predict that negative feedback is more likely to evolve as a noise attenuator in systems dominated by extrinsic noise [Paulsson, 2004, Hooshangi and Weiss, 2006]. Alternatively, intrinsic fluctuations could be reduced by an additional positive feedback loop to maintain high protein copy numbers despite the negative feedback needed to attenuate extrinsic fluctuations. For example, positive and negative feedbacks occur in the GAL regulon in budding yeast and have been shown to reduce fluctuations [Ramsey et al., 2006].
Negative auto-regulation also reduces response times [Savageau, 1974, Rosenfeld et al., 2002]. The mean time for an auto-negative system to reach half of its steady-state number of proteins from the initiation of transcription, , is reduced by at least a factor of two by negative feedback (Fig. 4c and 4d). This reduction occurs because negative feedback decreases the timescales of the system and so shifts the power spectrum of a constitutively expressed gene to higher frequencies [Austin et al., 2006]. More intuitively, negative feedback both reduces steady-state protein numbers from constitutive levels and initially allows expression at the higher constitutive rate while the first repressors are synthesized [Rosenfeld et al., 2002]. Stochastic fluctuations can cause significant variation in timing [Amir et al., 2007], and we observe that the probability distribution of is asymmetric and the asymmetry is enhanced by extrinsic noise (Fig. 4c and 4d). An extrinsic fluctuation can either aid or inhibit gene expression, and its substantial lifetime ensures that such effects contribute significantly to . Despite increasing the mean response time, extrinsic noise enables cells to typically respond faster, irrespective of negative feedback, because the most probable decreases (Fig. 4c and 4d). Yet, a population of cells can better ‘hedges its bets’ [Kussell and Leibler, 2005] because a greater number will rarely respond: the distribution has a longer tail for high response times.
Extrinsic fluctuations can combine destructively and constructively
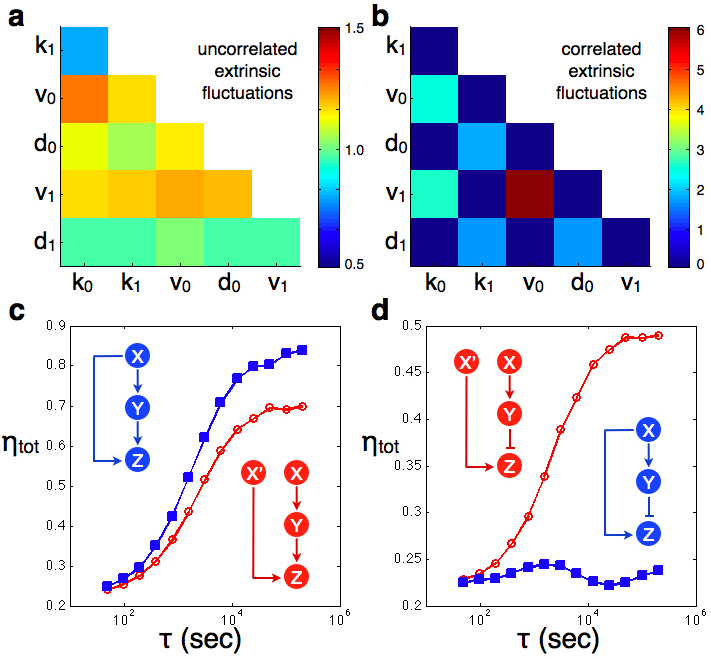
Extrinsic fluctuations are non-specific: they can act simultaneously on many parameters of a network [Pedraza and van Oudenaarden, 2005]. We added extrinsic fluctuations to all pairs of parameters in the model of Fig. 1a. These fluctuations were either uncorrelated, and generated by individual noise sources, or identical, and generated by the same noise source (Fig. 5a and 5b). For uncorrelated extrinsic fluctuations, the extrinsic noise in each parameter combines constructively: the extrinsic noise is approximately the sum of the extrinsic noises generated when each parameter fluctuates alone (Fig. 5a). For identical or, more generally, correlated extrinsic fluctuations, the extrinsic noise in each parameter also combines constructively if both parameters affect protein numbers similarly (protein numbers are proportional or inversely proportional to both parameters). Extrinsic fluctuations can be destructive, however, if both parameters have opposing effects on protein numbers (protein numbers are proportional to one parameter and inversely proportional to the other). Fluctuations in the two extrinsic variables then have little effect on extrinsic noise because a fluctuation in the variable that acts to increase protein numbers is counteracted by the same, or a similar, fluctuation in the variable that acts to decrease protein numbers (Fig. 5b). A network architecture that channels extrinsic noise into two parameters with opposing effects on protein numbers can therefore attenuate noise, and one that channels extrinsic noise into two parameters with similar effects on protein numbers can be a noise amplifier. We confirmed these results using a Langevin calculation (Supplementary information).
Constructive and destructive extrinsic fluctuations occur in feedforward loops, one of the most common motifs in genetic networks [Milo et al., 2002]. Fig. 5c and 5d illustrate two feedforwards, where gene is activated by genes and , and gene is either activated by gene X (coherent feedforward) or repressed by gene (incoherent feedforward) [Mangan and Alon, 2003]. Extrinsic fluctuations in can combine constructively or destructively with those in because the feedforward correlates the fluctuations of with the extrinsic fluctuations in . If the timescale of the extrinsic fluctuations is less than intrinsic timescales, however, extrinsic fluctuations are averaged away and such effects are no longer seen [Ghosh et al., 2005, Hayot and Jayaprakash, 2005]. In the coherent feedforward loop, the extrinsic fluctuations are constructive because and affect gene expression of similarly (Fig. 5c). In the incoherent feedforward loop, and having opposing affects on gene expression and their extrinsic fluctuations are destructive (Fig. 5d). As well as being sign-sensitive delays and accelerators [Mangan and Alon, 2003], feedforward loops may therefore also have been selected to amplify (coherent) or attenuate (incoherent) extrinsic fluctuations.
Discussion
Here we have extended the standard stochastic simulation algorithm for simulating intrinsic fluctuations in biochemical networks [Gillespie, 1976] to include extrinsic fluctuations (Materials and methods). Although extrinsic fluctuations have been modeled previously [Volfson et al., 2006, Sigal et al., 2006, Geva-Zatorsky et al., 2006, Austin et al., 2006, Cox et al., 2006, Tsimring et al., 2006, Scott et al., 2006, Tanase-Nicola et al., 2006], our approach is more general: we can simulate extrinsic fluctuations with any desired properties; we can vary many parameters with correlated or uncorrelated fluctuations; and we are able to average over intrinsic fluctuations by repeating simulations with the same trajectory of extrinsic variation. In the Supplementary information, we show that time-varying extrinsic fluctuations lead to a generalization of the original definitions of intrinsic and extrinsic noise [Swain et al., 2002].
Both the magnitude and the timescales of fluctuations are necessary to predict the effects of one stochastic system interacting with another. The mixing of the timescales of the two systems through their interaction can lead to so-called deviant effects [Samoilov and Arkin, 2006], such as a shifting of the mean and asymmetries in the distribution of protein numbers. Extrinsic fluctuations can even decrease intrinsic noise in protein levels. We predict that deviant effects will be common in biochemical networks because these networks typically have substantial extrinsic fluctuations and the timescale of these fluctuations can be the longest timescale in the system. Indeed, such effects are present in high-throughput measurements of cellular variation [Bar-Even et al., 2006, Newman et al., 2006, Sigal et al., 2006].
We can use our simulation method to investigate the source of extrinsic fluctuations. Interpreting our results as a stochastic sensitivity analysis, we predict that variation in transcription and translation rates to be the most significant sources. Such variation is likely to arise from fluctuations in the numbers of ribosomes and RNA polymerases. Being based on the parameter set of Fig. 1a, this prediction is model-specific, but we expect it to hold for other genes in E. coli.
Extrinsic fluctuations can create stochasticity in the output of a network of a magnitude that is substantially different from the magnitude of the extrinsic fluctuations themselves. If correlated, fluctuations in two parameters of a network can combine constructively to create extrinsic noise in the protein output that is many times the extrinsic noise for each parameter fluctuating independently. A different network architecture, however, can cause correlated extrinsic fluctuations to almost entirely negate each other. Both effects are likely to be present in cells.
Extrinsic fluctuations, through their timescales and non-specificity, are thus an important component of the intracellular environment. To function in this environment, biochemical networks are likely to have evolved to control or exploit these fluctuations. Our stochastic simulation algorithm and mathematical analysis should therefore help to quantitatively understand endogenous networks and to design effective synthetic ones.
Materials and methods
To simulate extrinsic noise, we extend Gillespie’s first reaction algorithm [Gillespie, 1976] to include discontinuous, time-dependent reaction rates. In the first reaction algorithm, a putative time for each potential reaction in the system is calculated, and the reaction whose putative time is first is implemented. Simulation time is then incremented by this reaction time. Each putative reaction time is calculated from the propensity of the reaction: the probability of the reaction per unit time multiplied by all ways of selecting the reactants [Gillespie, 1976]. The propensity, , is a function of time if the probability of the reaction per unit time is not constant.
For a time-varying propensity, we can show (Supplementary information) that the putative reaction time, , obeys
| (1) |
where is a uniform random number between 0 and 1. Eq. 1 is general, but it may be difficult to analytically find for a complex . Consequently, we approximate by a series of step functions or a piecewise-linear function. If we sample every seconds and use the more accurate piece-wise linear approximation, then for within a interval. Here and are constants defined by the Taylor series of and will change discontinuously from one interval to the next. We can use Eq. 1 to exactly implement discontinuous changes in a propensity (Supplementary information). Briefly, if the next predicted reaction would bring the simulation time into the next interval, we do not implement this reaction, but instead change the time-dependent propensity to the new functional form valid for the new interval. We set the simulation time to the start of the new interval and re-calculate the putative reaction times for all the reactions.
To calculate the putative reaction time within each interval when , we again use Eq. 1 which implies
| (2) |
where obeys . If and , then the reaction cannot occur ().
By generating a time series for an extrinsic noise source before running our algorithm, we can then use this time series to change reaction rates appropriately to simulate extrinsic fluctuations. We use the Ornstein-Uhlenbeck process to generate the time series [Fox et al., 1988, Gillespie, 1992]. This process, , has a positive autocorrelation time and is normally distributed. Consequently, when added to a parameter so that , can become negative. Exponentiating , however, and letting generates a log-normal stochastic process for . Such a process is suitable for modeling fluctuations in extrinsic variables [Rosenfeld et al., 2005]: has a fixed mean, a finite auto-correlation time, and is always positive.
We simulate with the Gibson-Bruck version of the Gillespie method [Gibson and Bruck, 2000] using the Facile network complier and its stochastic simulator [Siso-Nadal et al., 2007]. Both are freely available. All reactions and kinetic rates are included in the Supplementary information. When simulating two copies of the system, we define and where is the number of proteins for the first copy and the number of proteins for the second copy. We use because both copies have the same mean. In our simulations, averages are time averages taken over many times the longest timescale of the system.
For Fig. 3, we generated parameter sets for our model of gene expression from log-normal distributions with means given by the parameter values in Fig. 1a and a variance in log-space of of the mean. We choose , however, by sampling the probability of the promoter being in the active state from a log-normal distribution with a mean given by the parameters in Fig. 1a and with a variance of of this mean. We let extrinsic fluctuations act on a randomly chosen parameter in each model. These fluctuations have a coefficient of variation of 1. For each model, we sample from a log-normal distribution with a mean of 2500s, the mean protein lifetime, and with a variance of of this mean.
Acknowledgments
We thank M. Chacron, M. Elowitz, D. Gillespie, and N. Rosenfeld for useful conversations. In particular, we thank T.J. Perkins for showing us the derivation of Eq. 1. P.S.S. holds a Tier II Canada Research Chair. V.S., J.F.O. and P.S.S. are supported by N.S.E.R.C. and the M.I.T.A.C.S. National Centre of Excellence.
References
- [Amir et al., 2007] Amir, A., Kobiler, O., Rokney, A., Oppenheim, A. B. and Stavans, J. (2007). Noise in timing and precision of gene activities in a genetic cascade. Mol. Syst. Biol. 3, 71.
- [Arkin et al., 1998] Arkin, A., Ross, J. and McAdams, H. H. (1998). Stochastic kinetic analysis of developmental pathway bifurcation in phage lambda-infected Escherichia coli cells. Genetics 149, 1633–1648.
- [Austin et al., 2006] Austin, D. W., Allen, M. S., McCollum, J. M., Dar, R. D., Wilgus, J. R., Sayler, G. S., Samatova, N. F., Cox, C. D. and Simpson, M. L. (2006). Gene network shaping of inherent noise spectra. Nature 439, 608–611.
- [Bar-Even et al., 2006] Bar-Even, A., Paulsson, J., Maheshri, N., Carmi, M., O’Shea, E., Pilpel, Y. and Barkai, N. (2006). Noise in protein expression scales with natural protein abundance. Nat. Genet. 38, 636–643.
- [Becskei et al., 2005] Becskei, A., Kaufmann, B. B. and van Oudenaarden, A. (2005). Contributions of low molecule number and chromosomal positioning to stochastic gene expression. Nat. Genet. 37, 937–944.
- [Becskei and Serrano, 2000] Becskei, A. and Serrano, L. (2000). Engineering stability in gene networks by autoregulation. Nature 405, 590–593.
- [Blake et al., 2003] Blake, W. J., Kaern, M., Cantor, C. R. and Collins, J. J. (2003). Noise in eukaryotic gene expression. Nature 422, 633–637.
- [Cox et al., 2006] Cox, C. D., McCollum, J. M., Austin, D. W., Allen, M. S., Dar, R. D. and Simpson, M. L. (2006). Frequency domain analysis of noise in simple gene circuits. Chaos 16, 026102.
- [Dublanche et al., 2006] Dublanche, Y., Michalodimitrakis, K., Kummerer, N., Foglierini, M. and Serrano, L. (2006). Noise in transcription negative feedback loops: simulation and experimental analysis. Mol. Sys. Biol. 2, 41.
- [Elowitz et al., 2002] Elowitz, M. B., Levine, A. J., Siggia, E. D. and Swain, P. S. (2002). Stochastic gene expression in a single cell. Science 297, 1183–1186.
- [Fox et al., 1988] Fox, R. F., Gatland, I. R., Roy, R. and Vemuri, G. (1988). Fast, accurate algorithm for numerical simulation of exponentially correlated colored noise. Phys. Rev. A 38, 5938–5940.
- [Friedman et al., 2006] Friedman, N., Cai, L. and Xie, X. S. (2006). Linking stochastic dynamics to population distribution: an analytical framework of gene expression. Phys. Rev. Lett. 97, 16830.
- [Geva-Zatorsky et al., 2006] Geva-Zatorsky, N., Rosenfeld, N., Itzkovitz, S., Milo, R., Sigal, A., Dekel, E., Yarnitzky, T., Liron, Y., Polak, P., Lahav, G. and Alon, U. (2006). Oscillations and variability in the p53 system. Mol. Syst. Biol. 2, 32.
- [Ghosh et al., 2005] Ghosh, B., Karmakar, R. and Bose, I. (2005). Noise characteristics of feedforward loops. Phys. Biol. 2, 36–45.
- [Gibson and Bruck, 2000] Gibson, M. A. and Bruck, J. (2000). Efficient exact stochastic simulation of chemical systems with many species and many channels. J. Phys. Chem. A 104, 1876–1889.
- [Gillespie, 1976] Gillespie, D. T. (1976). A general method for numerically simulating the stochastic time evolution of coupled chemical reactions. J. Comput. Phys. 22, 403–434.
- [Gillespie, 1992] Gillespie, D. T. (1992). Markov Processes: An Introduction for Physical Scientists. Academic Press, San Diego, CA.
- [Golding et al., 2005] Golding, I., Paulsson, J., Zawilski, S. M. and Cox, E. C. (2005). Real-time kinetics of gene activity in individual bacteria. Cell 123, 1025–1036.
- [Hayot and Jayaprakash, 2005] Hayot, F. and Jayaprakash, C. (2005). A feedforward loop motif in transcriptional regulation: induction and repression. J. Theor. Biol. 234, 133–143.
- [Hooshangi and Weiss, 2006] Hooshangi, S. and Weiss, R. (2006). The effect of negative feedback on noise propagation in transcriptional gene networks. Chaos 16, 026108.
- [Jung and Hanggi, 1987] Jung, P. and Hanggi, P. (1987). Dynamical systems: A unified colored-noise approximation. Phys. Rev. A 35, 4464–4466.
- [Kaern et al., 2005] Kaern, M., Elston, T. C., Blake, W. J. and Collins, J. J. (2005). Stochasticity in gene expression: from theories to phenotypes. Nat. Rev. Genet. 6, 451–464.
- [Kaufmann et al., 2007] Kaufmann, B. B., Yang, Q., Mettetal, J. T. and van Oudenaarden, A. (2007). Heritable stochastic switching revealed by single-cell genealogy. PLoS Biol. 5, e239.
- [Kepler and Elston, 2001] Kepler, T. B. and Elston, T. C. (2001). Stochasticity in transcriptional regulation: origins, consequences, and mathematical representations. Biophys. J. 81, 3116–3136.
- [Kussell and Leibler, 2005] Kussell, E. and Leibler, S. (2005). Phenotypic diversity, population growth, and information in fluctuating environments. Science 309, 2075–2078.
- [Maamar et al., 2007] Maamar, H., Raj, A. and Dubnau, D. (2007). Noise in gene expression determines cell fate in Bacillus subtilis. Science 317, 526–529.
- [Mangan and Alon, 2003] Mangan, S. and Alon, U. (2003). Structure and function of the feed-forward loop network motif. Proc. Natl. Acad. Sci. U. S. A. 100, 11980–11985.
- [Milo et al., 2002] Milo, R., Shen-Orr, S., Itzkovitz, S., Kashtan, N., Chklovskii, D. and Alon, U. (2002). Network motifs: simple building blocks of complex networks. Science 298, 824–827.
- [Nachman et al., 2007] Nachman, I., Regev, A. and Ramanathan, S. (2007). Dissecting timing variability in yeast meiosis. Cell 131, 544–556.
- [Newman et al., 2006] Newman, J. R., Ghaemmaghami, S., Ihmels, J., Breslow, D. K., Noble, M., DeRisi, J. L. and Weissman, J. S. (2006). Single-cell proteomic analysis of S. cerevisiae reveals the architecture of biological noise. Nature 441, 840–846.
- [Ozbudak et al., 2002] Ozbudak, E. M., Thattai, M., Kurtser, I., Grossman, A. D. and van Oudenaarden, A. (2002). Regulation of noise in the expression of a single gene. Nat. Genet. 31, 69–73.
- [Paulsson, 2004] Paulsson, J. (2004). Summing up the noise in gene networks. Nature 427, 415–418.
- [Pedraza and van Oudenaarden, 2005] Pedraza, J. M. and van Oudenaarden, A. (2005). Noise propagation in gene networks. Science 307, 1965–1969.
- [Ramsey et al., 2006] Ramsey, S. A., Smith, J. J., Orrell, D., Marelli, M., Petersen, T. W., de Atauri, P., Bolouri, H. and Aitchison, J. D. (2006). Dual feedback loops in the GAL regulon suppress cellular heterogeneity in yeast. Nat. Genet. 38, 1082–1087.
- [Raser and O’Shea, 2004] Raser, J. M. and O’Shea, E. K. (2004). Control of stochasticity in eukaryotic gene expression. Science 304, 1811–1814.
- [Rosenfeld et al., 2002] Rosenfeld, N., Elowitz, M. B. and Alon, U. (2002). Negative autoregulation speeds the response times of transcription networks. J. Mol. Biol. 323, 785–793.
- [Rosenfeld et al., 2005] Rosenfeld, N., Young, J. W., Alon, U., Swain, P. S. and Elowitz, M. B. (2005). Gene regulation at the single-cell level. Science 307, 1962–1965.
- [Samoilov and Arkin, 2006] Samoilov, M. S. and Arkin, A. P. (2006). Deviant effects in molecular reaction pathways. Nat. Biotechnol. 24, 1235–1240.
- [Savageau, 1974] Savageau, M. A. (1974). Comparison of classical and autogenous systems of regulation in inducible operons. Nature 252, 546–549.
- [Scott et al., 2006] Scott, M., Ingalls, B. and Kaern, M. (2006). Estimations of intrinsic and extrinsic noise in models of nonlinear genetic networks. Chaos 16, 026107.
- [Sigal et al., 2006] Sigal, A., Milo, R., Cohen, A., Geva-Zatorsky, N., Klein, Y., Liron, Y., Rosenfeld, N., Danon, T., Perzov, N. and Alon, U. (2006). Variability and memory of protein levels in human cells. Nature 444, 643–646.
- [Siso-Nadal et al., 2007] Siso-Nadal, F., Ollivier, J. F. and Swain, P. S. (2007). Facile: a command-line network compiler for systems biology. BMC Syst. Biol. 1, 36.
- [Stelling et al., 2004] Stelling, J., Sauer, U., Szallasi, Z., Doyle, F. J. and Doyle, J. (2004). Robustness of cellular functions. Cell 118, 675–685.
- [Suel et al., 2007] Suel, G. M., Kulkarni, R. P., Dworkin, J., Garcia-Ojalvo, J. and Elowitz, M. B. (2007). Tunability and noise dependence in differentiation dynamics. Science 315, 1716–1719.
- [Swain, 2004] Swain, P. S. (2004). Efficient attenuation of stochasticity in gene expression through post-transcriptional control. J. Mol. Biol. 344, 965–976.
- [Swain et al., 2002] Swain, P. S., Elowitz, M. B. and Siggia, E. D. (2002). Intrinsic and extrinsic contributions to stochasticity in gene expression. Proc. Natl. Acad. Sci. U. S. A. 99, 12795–12800.
- [Tanase-Nicola et al., 2006] Tanase-Nicola, S., Warren, P. B. and ten Wolde, P. R. (2006). Signal detection, modularity, and the correlation between extrinsic and intrinsic noise in biochemical networks. Phys. Rev. Lett. 97, 68102.
- [Tsimring et al., 2006] Tsimring, L. S., Volfson, D. and Hasty, J. (2006). Stochastically driven genetic circuits. Chaos 16, 026103.
- [van Kampen, 1990] van Kampen, N. G. (1990). Stochastic Processes in Physics and Chemistry. Elsevier, New York, New York.
- [Volfson et al., 2006] Volfson, D., Marciniak, J., Blake, W. J., Ostroff, N., Tsimring, L. S. and Hasty, J. (2006). Origins of extrinsic variability in eukaryotic gene expression. Nature 439, 861–864.