Fermi Surface Evolution Across Multiple Charge Density Wave Transitions in ErTe3
Abstract
The Fermi surface (FS) of ErTe3 is investigated using angle-resolved photoemission spectroscopy (ARPES). Low temperature measurements reveal two incommensurate charge density wave (CDW) gaps created by perpendicular FS nesting vectors. A large meV gap arising from a CDW with is in good agreement with the expected value. A second, smaller meV gap is due to a second CDW with . The temperature dependence of the FS, the two gaps and possible interaction between the CDWs are examined.
pacs:
71.45.Lr, 79.60.-i, 71.18.+yCharge density wave systems have been studied for many decades Grüner (1994). CDWs and spin density waves, the spin analog, exist in all dimensions. However, enhanced electron interactions in systems with reduced dimensionality increases the susceptibility for CDW formation, also known as a Peierls distortion in one dimension Grioni et al. (1999); Dardel et al. (1991); Perfetti et al. (2002); Fawcett (1988); Schäfer et al. (2003); Gweon et al. (1998); Brouet et al. (2004). In ideal 1D systems the FS topology determines the susceptibility for CDW formation via electron-phonon coupling Grüner (1994). If the FS can be nested with one q-vector of a particular phonon mode, the ground state energy can be reduced by electron-phonon coupling resulting in gaps opening at the Fermi level. Real systems are never perfectly 1D, resulting in imperfect FS nesting with a partially gapped FS and residual metallic pockets Schäfer et al. (2003); Gweon et al. (1998); Brouet et al. (2004). While a great wealth of information has been learned from CDW systems, microscopic models explaining CDW mechanisms have been elusive and debated Yao et al. (2006); Johannes et al. (2006); Johannes and Mazin (2008); Malliakas et al. (2005). It has even been proposed that the idea of FS nesting is insufficient to explain the nesting vectors realized in the family of rare earth tritelluride (RTe3) compounds Johannes and Mazin (2008). The RTe3 family offers a unique opportunity to systematically study CDW formation over a wide range of tunable parameters via rare earth substitution DiMasi et al. (1995); Ru and Fisher (2006); Ru et al. (2008); Brouet et al. (2008); Malliakas et al. (2005). In addition, the simple electronic structure makes RTe3 more tractable for theoretical modeling to gain a deeper understanding of the CDW phenomena and electron correlations in general Brouet et al. (2004); Yao et al. (2006); Laverock et al. (2005).
The CDW properties for several members of the RTe3 family have been well characterized previously Gweon et al. (1998); Brouet et al. (2004); Ru and Fisher (2006); Ru et al. (2008); Brouet et al. (2008); DiMasi et al. (1995). RTe3 has a layered, weakly orthorhombic crystal structure (space group ) consisting of two planar Te nets sandwiched between buckled RTe slabs. X-ray analysis reveals an incommensurate lattice modulation characterized by a single wave vector () Ru and Fisher (2006); Ru et al. (2008). Previous ARPES studies show a partially gapped FS with the gap maximum occurring along the -axis (i.e. or since the -axis is the long axis) Gweon et al. (1998); Brouet et al. (2004, 2008); Komoda et al. (2004). The gap evolution as a function of R is consistent with a FS nesting driven sinusoidal CDW with the bandwidth and density of states at the Fermi level () tuned by a shrinking unit cell Ru et al. (2008); Brouet et al. (2008); Laverock et al. (2005).
The recent discovery of a second CDW transition in heavier members of RTe3 is a rare display of the riches in CDW formation and a unique opportunity to further test the concept of a FS driven CDW. The second CDW was first discovered by transport measurements Ru et al. (2008). It has further been confirmed by x-ray scattering displaying a second lattice modulation perpendicular to the first, parallel to the -axis with Ru et al. (2008). We have performed ARPES investigations of ErTe3, specifically chosen since it has two well separated CDW transitions at K and K. Our finding further strengthens the notions of FS nesting driven CDW formation in this particular compound. Data suggest that as the rare earth ion is varied, the second CDW is formed only when the first CDW weakens with the decreasing lattice parameter, making larger FS segments available for the new nesting condition to form Ru et al. (2008); Brouet et al. (2008). While the result can be qualitatively explained by a simple tight binding (TB) model, the data contain rich subtleties suggesting a dynamic interplay of the two CDWs. Our finding establish ErTe3 as an excellent model system to study the evolution and entanglement of two many-body states existing within the same atomic plane.
Single crystals used in this study were grown by slow cooling a binary melt and have been well characterized elsewhere Ru et al. (2008). All ARPES data were taken at the Stanford Synchrotron Radiation Laboratory beamline 5-4 with an energy resolution of meV and angular resolution of .
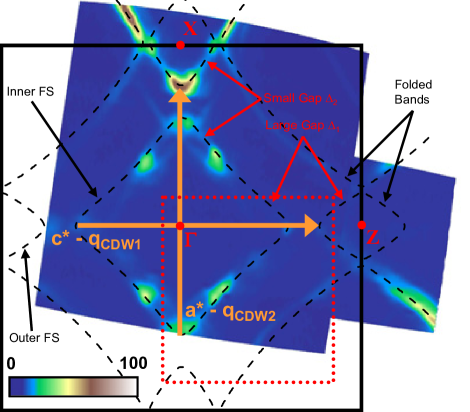
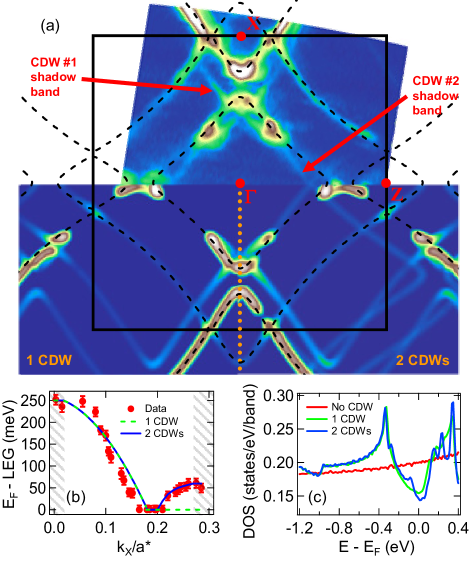
The FS determined from ARPES is shown in Fig. 1. A large gapped region in the vicinity of the axis is consistent with previous studies of RTe3 members with a single CDW. While x-ray data shows to be parallel to the -axis, the FS along () is not completely gapped at K as shown in Fig. 1. The intensity is weak along the inner FS, but the outer FS retains significant spectral weight. Further inspection slightly off the axis () reveals a second gap does appear in both the inner and outer FS pieces. In addition, several weaker features are evident in the regions around the large and small gaps just below . Fig. 2a is of the same data as Fig. 1, but with a logarithmic intensity scale and slightly larger integration window to emphasize the weaker features near . As shown later, the weaker features provide crucial evidence for the induced FS from both CDWs. Given the complexity, there is amazing degree of agreement between data and the expected FS pieces.
While ARPES exposes distinct differences between the FS of lighter RTe3 members with a single CDW and the FS of ErTe3 Gweon et al. (1998); Brouet et al. (2004, 2008), differences in the theoretical FS are subtle Ru et al. (2008). Linear muffin tin orbital (LMTO) calculations suggest the electronic structure near is still dominated by the and orbitals of the two Te planes Laverock et al. (2005); Ru et al. (2008); Laverock and Dugdale . Hence, one would expect that the TB model of a single Te plane which so accurately describes other rare earth members would also accurately describe ErTe3. Details of the TB model are described elsewhere Brouet et al. (2004, 2008). A square net of Te atoms is assumed with perpendicular chains created by the in-plane and orbitals ( orbitals are assumed to be filled). The model parameters consist of electron hopping terms along a particular chain () and perpendicular to the chain (). The Fermi velocity, the slope of the bands traversing , is primarily determined by while a FS curvature is introduced proportional to /. In this work the TB model is expanded to not only include effects of the reduced 3D Brillouin zone on a 2D Te plane and as used previously, but includes the second CDW with the addition of / bands translated by .
To further understand the implications of two transverse CDWs on the FS, the TB model is further extended to include interactions between various bands. An electron-phonon coupled Hamiltonian is used to model the band interactions in a perturbative fashion Grüner (1994); Brouet et al. (2008). Interactions arising due to the 3D crystal structure and both CDWs are included in the Hamiltonian, however, only first order interactions due to band crossings arising from a single -vector translation are included. While higher order terms are expected to exist due to the incommensurate nature of the CDWs, the intensity is expected to be extremely weak and thus can be neglected Brouet et al. (2004, 2008); Voit et al. (2000). The lattice parameters (Å assuming a square Te net) are taken from x-ray results and all other model parameters are estimated from the data, both from the FS and band crossings occurring below . Since the intensity appearing in the reconstructed FS originates from the original and bare bands, the color scale in the model FS is proportional to the sum of the square of the resulting and eigenvector amplitudes from the interacting Hamiltonian Brouet et al. (2008). The resulting reconstructed FS from the interacting TB model is shown in Fig. 2a. The spectral intensity existing near the FS corners at both and are now explained by the electron-phonon coupled TB model of the CDW. Shadow bands, bare and bands translated by CDW -vectors, correspond to weak features observed in the data revealing the two transverse CDWs.
Due to the agreement between the model FS and the observed one, the extended interacting TB model is used to characterize the CDW properties in a similar manner to previous studies of lighter RTe3 members Brouet et al. (2008). The gap evolution along for the inner FS square is shown in Fig. 2b, demonstrating the effects of multiple CDWs. The excellent agreement between the model and experimental data suggests the observed FS is consistent with a nesting driven CDW, however, quantitative discrepancies exist which must be discussed. The model intensity at the corners of the inner FS square do not match the experimental data. This discrepancy is observed both along the and directions, but is most pronounced along . This discrepancy is most likely due to the simplicity of the model, neglecting effects from higher order CDW terms, interactions beyond the nearest neighbor in-plane -orbitals, a bi-layer splitting arising from neighboring Te planes and orthorhombicity of the unit cell Brouet et al. (2008). Despite these discrepancies, the agreement justifies using such a simple model for illustration purposes. The density of states is calculated for the interacting TB model and shown in Fig. 2c. The onset of a single CDW suppresses to of the unmodulated value while the second CDW further suppresses to . Although the gains due to the second CDW are modest, mean field transition temperatures depend exponentially on . In addition, estimations of the Te bandwidth for GdTe3 (Å) is eV Brouet et al. (2008) while for ErTe3 (Å) it is eV. While ErTe3 ARPES data is the first in the RTe3 family to show multiple gaps in the FS, the increasing bandwidth proportional to the shrinking lattice agrees with the general RTe3 trend.
Studies of lighter RTe3 members with a single CDW suggest a shrinking gap accompanies the shrinking lattice parameter, allowing a larger portion of the FS to remain intact. In addition, the gap maximum always appears along the -axis Brouet et al. (2008). Perfectly nesting the corners of the FS along each axis (i.e. ) will pin the center of the CDW gap at Brouet et al. (2008). However, observed nesting vectors and hybridization of and bands effectively pushes the center of the gap below . This effect is most pronounced at the corners of the inner and outer FS allowing intensity to be observed in these regions. The gap magnitudes ( meV and meV) are smaller in ErTe3 than the lighter rare earth family members (for CeTe3 meV Brouet et al. (2004)) and the observed FS curvature () is greater in ErTe3. These differences account for the large intensity observed along as one might expect this region to be gapped at based on previous RTe3 studies. With smaller gaps and larger FS curvature, the downward shift of the CDW gaps due to the length of the CDW -vectors and hybridization allows intensity from the top of the CDW gaps to be observed at .
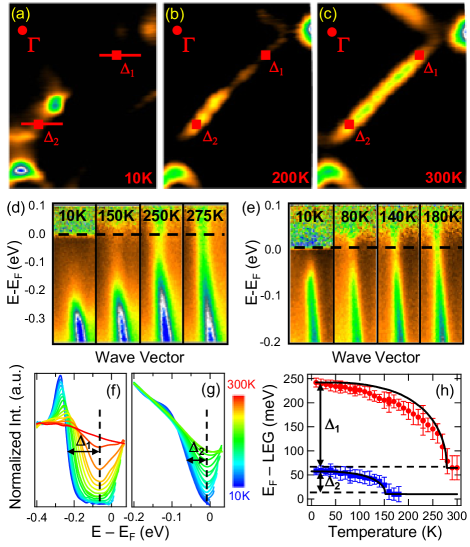
To further illustrate the implications of CDW formation on the FS, temperature dependent FS data are taken. One significant advantage of ErTe3 is the fact that the room temperature structure is free from any CDW Ru et al. (2008). Thus this system provides a unique opportunity to observe the FS evolution across multiple CDW transitions. The large gaps observed at low temperatures for this family allow us to observe the gap opening despite thermal broadening effects. Fig. 3a-c show the FS data taken at different temperatures for one side of the inner FS and Fig. 3d-g show the temperature dependence of bands near the large and small gaps with a CDW and without. At K only one gap is evident, while at K the inner FS square is fully closed as expected from a structure unmodulated by any CDW Laverock et al. (2005). To track the temperature evolution of the leading edge gap, the spectra were first divided by the temperature dependent Fermi-Dirac function convoluted with an energy resolution function Lee et al. (2007). Such a procedure allows the determination of the center of the energy gap ensuring accurate measurements of gap values. In addition, since the center of the energy gap is observed below , CDW -vectors used in the TB model can be determined directly from the data resulting in and . The CDW wave vectors determined from ARPES are in excellent agreement with the lattice modulation vectors observed in x-ray data Ru et al. (2008). The leading edge gap was then determined by fitting momentum distribution curve peaks with Lorentz functions and tracking the point of inflection in the fitted band dispersion after denoising via wavelet shrinkage. Instead of tracking the gaps at and , temperature dependent data were taken at -points where the gap maxima with no FS intensity are observed. Fig. 3h summarizes the temperature dependent data showing both gaps closing. A mean-field order parameter curve scaled to the maximum observed gap is also plotted for comparison. The smaller and larger gaps are observed to close at K and K, respectively, in good agreement with the transport and x-ray data Ru et al. (2008). The development of the gaps appears to be second order within the experimental uncertainty as no hysteresis has been observed. While the closing of the gaps is suggestive of a mean-field type behavior, is somewhat suppressed from the mean-field curve. In addition, it should be noted that is while the area of the FS gapped by is times the area gapped by .
The observed -vectors, the observation of CDW gaps below the Fermi-level and the use of an electron-phonon coupled model Hamiltonian may suggest the FS plays little role in the formation of the CDWs Johannes and Mazin (2008). However, caution is advised as the model FS in Fig. 2a is not the one electron eigenvalues resulting from the mixing of the different bands. To accurately model the FS, the calculated spectral weight ( and eigenvectors) had to be used. The FS in Fig. 3c is also a poor match for the model FS eigenvalues with no CDWs because the bare bands folded back into the reduced 3D Brillouin zone are too weak to be observed. Lowering of the ground state energy is achieved by gapping the FS and the model spectral weight suggest the shape of the FS could still play a significant role in the CDW formation.
Both CDWs exist within the same Te plane Ru et al. (2008), thus both CDWs modulate the positions of the same Te atoms. Hence, ErTe3 offers a unique opportunity to directly study the crossover from quasi-1D to quasi-2D behavior. Upon initial inspection, each CDW appears uni-directional and completely decoupled. However, suppression of from the mean-field curve, the discrepancy between and still need to be explained. Such discrepancies may arise due to the interplay between the two many body states. Subtle complexities arising from the crystal structure could interfere with the delicate balance between the lattice and electronic energies, allowing for interactions between the two CDWs to arise. More experimental and theoretical work is required to explore such possibilities.
Acknowledgements.
We thank S. Kivelson, H. Yao, E. -A. Kim, J. Laverock and S. B. Dugdale for insightful discussions regarding our data and model. SSRL is operated by the DOE Office of Basic Energy Science, Division of Chemical Science and Material Science. This work is supported by DOE Office of Science, Division of Materials Sciences, with contract DE-FG03-01ER45929-A001 and DE-AC02-76SF00515.References
- Grüner (1994) G. Grüner, Density waves in solids (Addison-Wesley, Reading, MA, 1994).
- Grioni et al. (1999) M. Grioni, I. Vobornik, F. Zwick, and G. Margaritondo, J. of Elec. Spec. and Related Phenom. 100, 313 (1999).
- Dardel et al. (1991) B. Dardel et al., Phys. Rev. Lett. 67, 3144 (1991).
- Perfetti et al. (2002) L. Perfetti et al., Phys. Rev. B 66, 075107 (2002).
- Fawcett (1988) E. Fawcett, Rev. Mod. Phys. 60, 209 (1988).
- Schäfer et al. (2003) J. Schäfer et al., Phys. Rev. Lett. 91, 066401 (2003).
- Gweon et al. (1998) G. H. Gweon et al., Phys. Rev. Lett. 81, 886 (1998).
- Brouet et al. (2004) V. Brouet et al., Phys. Rev. Lett. 93, 126405 (2004).
- Yao et al. (2006) H. Yao, J. A. Robertson, E.-A. Kim, and S. A. Kivelson, Phys. Rev. B 74, 245126 (2006).
- Johannes et al. (2006) M. D. Johannes, I. I. Mazin, and C. A. Howells, Phys. Rev. B 73, 205102 (2006).
- Johannes and Mazin (2008) M. D. Johannes and I. I. Mazin, Phys. Rev. B 77, 165135 (2008).
- Malliakas et al. (2005) C. Malliakas et al., J. Am. Chem. Soc. 127, 6510 (2005).
- DiMasi et al. (1995) E. DiMasi et al., Phys. Rev. B 52, 14516 (1995).
- Ru and Fisher (2006) N. Ru and I. R. Fisher, Phys. Rev. B 73, 033101 (2006).
- Ru et al. (2008) N. Ru et al., Phys. Rev. B 77, 035114 (2008).
- Brouet et al. (2008) V. Brouet et al., Phys. Rev. B 77, 235104 (2008).
- Laverock et al. (2005) J. Laverock et al., Phys. Rev. B 71, 085114 (2005).
- Komoda et al. (2004) H. Komoda et al., Phys. Rev. B 70, 195101 (2004).
- (19) J. Laverock and S. B. Dugdale, private communication.
- Voit et al. (2000) J. Voit et al., Science 290, 501 (2000).
- Lee et al. (2007) W. S. Lee et al., Nature 450, 81 (2007).