Survey of ortho-(11,0–11,1) in dense cloud cores
Abstract
Aims. We present a survey of the ortho–(11,0–11,1) line toward a sample of 10 starless cores and 6 protostellar cores, carried out at the Caltech Submillimeter Observatory. The high diagnostic power of this line is revealed for the study of the chemistry, and the evolutionary and dynamical status of low-mass dense cores.
Methods. The derived ortho– column densities () are compared with predictions from simple chemical models of centrally concentrated cloud cores.
Results. The line is detected in 7 starless cores and in 4 protostellar cores. ranges between 2 and 401012 cm-2 in starless cores and between 2 and 91012 cm-2 in protostellar cores. The brightest lines are detected toward the densest and most centrally concentrated starless cores, where the CO depletion factor and the deuterium fractionation are also largest. The large scatter observed in plots of vs. the observed deuterium fractionation and vs. the CO depletion factor is likely to be due to variations in the ortho–to–para (o/p) ratio of from 0.5 for 10 K gas in pre–stellar cores to 0.03 (consistent with 15 K for protostellar cores). The two Ophiuchus cores in our sample also require a relatively low o/p ratio ( 0.3). Other parameters, including the cosmic-ray ionization rate, the CO depletion factor (or, more in general, the depletion factor of neutral species), the volume density, the fraction of dust grains and PAHs also largely affect the ortho– abundance. In particular, gas temperatures above 15 K, low CO depletion factors and large abundance of negatively charged small dust grains or PAHs drastically reduce the deuterium fractionations to values inconsistent with those observed toward pre–stellar and protostellar cores. The most deuterated and –rich objects (L 429, L 1544, L 694-2 and L 183) are reproduced by chemical models of centrally concentrated (central densties 106 cm-3) cores with chemical ages between 104 and 106 yr. Upper limits of the para-(1–2) and para–(11,0–10,1) lines are also given. The upper limit to the para- fractional abundance is 10-8 and we find an upper limit to the para–/ortho– column density ratio equal to 1, consistent with chemical model predictions of high density (2106 cm-3) and low temperature ( 10 K) clouds.
Conclusions. Our results point out the need for better determinations of temperature and density profiles in dense cores as well as for observations of para-.
Key Words.:
astrochemistry — stars: formation — ISM: clouds, molecules — radio lines: ISM — submillimeter1 Introduction
In the past decade, astrochemistry has become more and more crucial in understanding the structure and evolution of star forming regions. There are no doubts that stars like our Sun form in gas and dust condensations within molecular clouds and that the process of star formation can only be understood by means of detailed observations of the dust (good probe of the most abundant and elusive molecule, ) and molecular lines (unique tools to study kinematics and the chemical composition).
Millimeter and submillimeter continuum dust emission observations (see Ward-Thompson et al. 2007, for a detailed review of this topic) have provided a very good probe of the density structure of dense cores, although uncertainties are still present regarding the dust opacity and temperature, both likely to change within centrally concentrated objects (but such variations have so far been hard to quantify observationally, see e.g. Bianchi et al. 2003; Pagani et al. 2003, 2004). Stellar counts in the near-infrared provide an alternative way of measuring the dust (and ) column and cloud structure (Lada et al. 1994), independent of any variation in dust properties, but they cannot probe regions with extinctions above about 40-50 mag (Alves et al. 1998), i.e. the central zone of very dense cores, such as L 1544, where 100 mag within 11″ (Ward-Thompson et al. 1999). It appears that many starless cores can be approximated as Bonnor–Ebert spheres (Ebert 1955; Bonnor 1956), with values of the central densities ranging from about 105 (as in the case of B 68; Alves et al. 2001) to 106 (for e.g., L 1544, L 183, and L 694-2; Ward-Thompson et al. 1999, Pagani et al. 2003, Harvey et al. 2003). At the lower end of the central density range, dense cores appear to be isothermal, with gas temperatures close to 10 K (Galli et al. 2002; Tafalla et al. 2004), whereas higher density cores have clear evidences of temperature drops in the central few thousand AU, with dust temperatures approaching about 7 K (Evans et al. 2001; Pagani et al. 2003, 2004; Schnee & Goodman 2005; Pagani et al. 2007; Crapsi et al. 2007, see also Bergin & Tafalla 2007 for a comprehensive review on starless cores)
Keto & Field (2005) have proposed that the ”shallower” cores (such as B 68) are in approximate equilibrium and will not evolve to form protostars, whereas the centrally concentrated ones (such as L 1544) are unstable cores that are proceeding toward gravitational collapse and the formation of protostars. Indeed, this is in agreement with the findings of Lada et al. (2002), who claim that B 68 is oscillating around an equilibrium state, and those of Caselli et al. (2002a) and van der Tak et al. (2005), who studied the kinematic structure of L 1544 and found that it is consistent with contraction in the core nucleus (or central contraction).
To trace the gas properties, and have been extensively used for several years (Benson & Myers 1989) and they seem to trace quite similar conditions, having comparable morphologies and line widths (Benson et al. 1998; Caselli et al. 2002c; Tafalla et al. 2002, 2004), despite of the (two orders of magnitude) difference in the critical densities of the most frequently observed transitions ((1,1) and (1-0), see Pagani et al. 2007). This is quite lucky for astronomers considering that only relatively recently it has been realized that these two species are among the few that are left in the gas phase at volume densities above 105 . In fact, CO, CS and, in general, all the carbon bearing species so far observed (with the exception of CN; Hily-Blant et al. 2008) are heavily affected by freeze-out in the central parts of dense starless cores (Kuiper et al. 1996; Willacy et al. 1998; Caselli et al. 1999; Bergin et al. 2001; Bacmann et al. 2002; Bergin et al. 2002; Caselli et al. 2002b; Tafalla et al. 2002; Bacmann et al. 2003; Crapsi et al. 2004; Tafalla et al. 2004; Pagani et al. 2005; Crapsi et al. 2005; Tafalla et al. 2006; Pagani et al. 2007). The freeze-out of neutral species (in particular of CO, Dalgarno & Lepp 1984; Roberts & Millar 2000a, b), boosts the deuterium fractionation in species such as , , H2CO , and (see e.g. Butner et al. 1995; Tiné et al. 2000; Caselli et al. 2002b; Bacmann et al. 2003; Crapsi et al. 2005; Lis et al. 2006; Gerin et al. 2006). Also in star forming cores, in particular in the direction of Class 0 sources, the first protostellar stage (e.g. André et al. 2000), right after the pre-stellar phase, the deuterium fractionation is found to be very large (Ceccarelli et al. 1998; Loinard et al. 2002; Lis et al. 2002a, b; van der Tak et al. 2002; Parise et al. 2002; Vastel et al. 2003; Parise et al. 2004; Crapsi et al. 2004; Marcelino et al. 2005; Parise et al. 2006; Ceccarelli et al. 2007). This is thought to be the signature of a (recent) past in which the star forming cloud core experienced the low temperature and high density conditions typical of the most centrally concentrated starless cores, where some deuterated molecules (e.g. deuterated ammonia) are formed in the gas phase (and stored on dust surfaces) whereas others (such as deuterated methanol and formaldehyde) are likely formed onto dust surfaces and then released to the gas phase partially upon formation (Garrod et al. 2006, 2007) as well as via the interaction with the newly born protostar, which can (i) heat dust grains, leading to mantle evaporation (as in Hot Cores and Corinos; Turner 1990; Cazaux et al. 2003; Bottinelli et al. 2004a, b, 2007), and/or (ii) ”erode” dust mantles via sputtering in shocks produced by the associated energetic outflows (e.g. Lis et al. 2002a).
Questions that are still open are: (1) are , and their deuterated forms really tracing the inner portions of centrally concentrated cores on the verge of star formation? Although Bergin et al. (2002), Pagani et al. (2005, 2007) found evidences of depletion in the center of B 68 and L 183, respectively, there are no signs of freeze–out for NH3 in L 1544 (Crapsi et al. 2007) and for both nitrogen bearing species in L 1517B and L 1498 (Tafalla et al. 2004). At densities above 106 , the freeze–out time scale is quite short (1,000 yr) and all heavy species are expected to condense onto grain mantles. Moreover, recent laboratory measurements clearly show that , the parent species of both and , should freeze–out at the same rate as CO (having similar binding energies and sticking probabilities; Öberg et al. 2005; Bisschop et al. 2006). (2) For how long the high degree of deuterium fractionation observed in starless cores is maintained after the formation of a protostellar object?
The detection of strong ortho-) emission in the direction of L 1544 (Caselli et al. 2003), and the conclusion that , with its deuterated counterparts, is one of the most abundant molecular ions in core centers, have opened a new way to study the chemical evolution (Roberts et al. 2003, 2004; Walmsley et al. 2004; Flower et al. 2004, 2005, 2006a, 2006b; Aikawa et al. 2005) and the kinematics (van der Tak et al. 2005) of the central few thousand AU of starless cores. Thus, is an important tool to understand the chemical and physical properties of the material out of which protoplanetary disks and ultimately planetary systems form.
In the gas phase at temperatures below 20 K, the deuterium fractionation is mostly regulated by the proton–deuteron exchange reaction:
| (1) |
where E (= 230 K, Millar et al. 1989) prevents the reverse reaction to be fast in cold regions, unless a significant fraction of is in ortho form (Gerlich et al. 2002; Walmsley et al. 2004). Flower et al. (2006a) showed that values of the ortho–to–para (o/p) ratio much higher than 0.03 are inconsistent with the observed high levels of deuteration of the gas (see their Fig. 6). The above reaction, together with the freeze–out of neutral species (which boosts up the production rate of compared to ; e.g. Aikawa et al. 2001), allows the / ratio to overcome the cosmic D/H ratio by several orders of magnitude. In fact, not only ortho–) has been found to be 1 K strong in L 1544, but also has been detected toward another starless condensation (16293E, in Ophiuchus; Vastel et al. 2004). The ortho–) line has also recently been mapped in L 1544 (Vastel et al. 2006a), finding that the emitting region has a radius of about 5000 AU, comparable to the size of the (2-1) map made in the same region by Caselli et al. (2002a).
In this paper we present new ortho–) observations, carried out at the Caltech Submillimeter Observatory (CSO) antenna, in the direction of 10 starless cores and 6 cores associated with very young protostellar objects. As it will be shown, the line has been detected in 7 of the 10 starless cores and in 4 out of 6 star forming cores. In Sect. 2 the observational details are given. Results and ortho– spectra are shown in Sect. 3, together with a brief discussion on the upper limits of the para-(11,0-10,1) lines (para-(1–2) upper limits can be found in the on-line appendix). column densities are derived in Sect. 4. A chemical discussion, aimed at interpreting the observations, is described in Sect. 5 and conclusions are in Sect. 6.
2 Observations
2.1 Technical details
Observations of the ortho–) line ( = 372.421385(10) GHz; Amano & Hirao 2005) were carried out at the Caltech Submillimeter Observatory (CSO) on Mauna Kea (Hawaii), between October 2002 and April 2005. The spectra were taken in wobbler switching mode, with a chop throw of 300″. The backend used was an acousto-optical spectrometer (AOS) with 50 MHz bandwidth. The velocity resolution, as measured from a frequency comb scan, is 0.1 . The beam efficiency () at = 372 GHz was measured on Saturn, Mars and Jupiter and is listed in Tab. 2. Measurements for extended sources were made for only few sources (L 1544, L 183, NGC 1333–DCO+, B 1, NGC 2264G-VLA2) and found to be 70%, compared to 60% on planets measurements. is likely to be extended (e.g. L 1544: Vastel et al. 2006a; L 183: Vastel et al. 2006b). Consequently, we used the extended source beam efficiency whenever available. However note that the difference cannot be much significant. At 372 GHz, the CSO 10.4-m antenna has a half power beamwidth of about 22″.
Similar setups were used for the para–(1-2) line at 307.1924100 GHz (JPL catalogue to be found at http://spec.jpl.nasa.gov/), which was observed at CSO in October 2002 and June 2003. Tab. 6 present the beam efficiencies that were used for H3O+ data. Pointing was measured every two hours and found to be better than 3″.
Observations of the para-D2H+ (11,0-10,1) line ( = 691.660483(20) GHz; Amano & Hirao 2005) were carried out at CSO between April 2003 and April 2005 under very good weather conditions (225 GHz zenith opacity less than 0.065). We used the 50 MHz AOS with a spectral resolution better than 0.04 km s-1. The observations were performed using the wobbler with a chop throw between 150 and 180 according to its stability. The beam efficiency was carefully and regularly checked on Mars, Venus, Saturn and Jupiter, and found to be 40%. For more extended sources, the beam efficiency has been measured to be 60%. This value has been adopted for 16293E, the only source where D2H+ has been detected, assuming that in this case the emission covers an area not significantly smaller than the beam. For the other sources, we use = 40% (Tab. 4) and consider a factor of 1.5 uncertainty in the column density upper limit value due to the unknown source size. Pointing was monitored every 1.5 hours and found to be better than 3″. At 692 GHz, the CSO 10.4-m antenna has a half power beamwidth of about 11″.
2.2 Source Selection
The source list is in Tab. 1, which reports the coordinates, the Local Standard of Rest velocity () at which we centered our spectra, and the distance to the source.
| Source | RA(J2000) | Dec(J2000) | Distance | |
| Name | [h m s] | [ ′ ″] | () | (pc) |
| Starless Cores | ||||
| L 1498 | 04 10 53.67 | +25 10 18.12 | 7.80 | 140 |
| TMC–2 | 04 32 44.03 | +24 23 32.56 | 6.10 | 140 |
| TMC–1C | 04 41 38.81 | +26 00 21.98 | 5.20 | 140 |
| L 1517B | 04 55 18.00 | +30 37 43.84 | 5.80 | 140 |
| L 1544 | 05 04 17.23 | +25 10 42.70 | 7.14 | 140 |
| L 183 | 15 54 08.56 | -02 52 48.99 | 2.50 | 110 |
| Oph D | 16 28 28.56 | -24 19 25.03 | 3.40 | 165 |
| B 68 | 17 22 38.64 | -23 49 46.03 | 3.40 | 125 |
| L 429 | 18 17 05.53 | -08 13 29.94 | 6.82 | 200 |
| L 694-2 | 19 41 05.03 | +10 57 01.99 | 9.60 | 250 |
| Protostellar Cores | ||||
| NGC 1333 DCO+ | 03 29 12.10 | +31 13 26.30 | 6.00 | 350 |
| B 1 | 03 33 20.84 | +31 07 34.27 | 6.00 | 350 |
| IRAM 04191 | 04 21 56.91 | +15 29 46.10 | 6.60 | 140 |
| L 1521Fa | 04 28 39.80 | +26 51 35.00 | 6.48 | 140 |
| Ori B9 | 05 43 08.17 | -01 15 11.76 | 9.10 | 450 |
| NGC 2264G–VLA2 | 06 41 11.09 | +09 55 59.01 | 8.00 | 800 |
-
a
Embedded low luminosity object recently detected by Spitzer (Bourke et al. 2006).
The selection criteria for starless cores is similar to that described in Crapsi et al. (2005), where sources with bright continuum and emission have been selected to include chemically evolved cores, where CO is significantly frozen onto dust grains and where is thus expected to be more abundant. The sample consists of ”shallow” cores, with central densities of 105 (L 1498, TMC–2, L 1517B, B 68) and more centrally concentrated ones, with central densities of 106 (TMC–1C, L 1544, L 183, Oph D, L 429 and L 694-2).
The star forming regions observed have been selected as being representative
of the early phases of protostellar evolution, so that any detection of
will be interesting to compare with starless cores and see if
any evolutionary trend can be highlighted. Among the protostellar cores we
selected:
(1) NGC 1333 , close to IRAS 4A, in Perseus, where large
abundances of deuterated species have been observed (ND3, van der Tak et al. 2002;
NH2D, Hatchell 2003; D2S, Vastel et al. 2003;
ND2H, Roueff et al. 2005).
(2) B 1 is one of the highest column
density cores in the Perseus Complex, with active low–mass star formation
going on (e.g. Hirano et al. 1999) and with large deuterium fractionations,
as shown by the detection of triply deuterated ammonia (ND3, Lis et al. 2002b, 2006),
doubly deuterated hydrogen sulfide (D2S, Vastel et al. 2003),
and doubly deuterated thioformaldehyde (D2CS, Marcelino et al. 2005).
(3) IRAM 04191, a very low luminosity Class 0 source in Taurus,
driving a powerful outflow, but embedded in a dense core which appears to
maintain many of the starless core characteristics (Belloche & André 2004).
(4) L 1521F, initially selected as a starless core with chemical and physical
structure similar to L 1544 (but different kinematics; Crapsi et al. 2004),
and recently found associated with a 0.07 L⊙ protostellar
object thanks to the high sensitivity of the Spitzer Space Telescope
(Bourke et al. 2006).
(5) Ori B9, a massive dense core in Orion B,
with peculiarly narrow molecular line widths and low gas temperature
(Lada et al. 1991; Harju et al. 1993; Caselli & Myers 1995), thus an ideal target (among massive cores) to detect deuterated species.
(6) NGC2264–VLA2, studied by, e.g., Ward-Thompson et al. (1995),
who found the Class 0 driving source of the bipolar outflows,
Girart et al. (2000), who determined the gas temperature and volume density of
the surrounding core, and by Loinard et al. (2002), who observed
D2CO and found an extremely large deuterium fractionation
([D2CO]/[H2CO] = 0.4, equivalent to an enrichment over the
cosmic D/H ratio of more than 9 orders of magnitude).
3 Results
3.1 ortho-
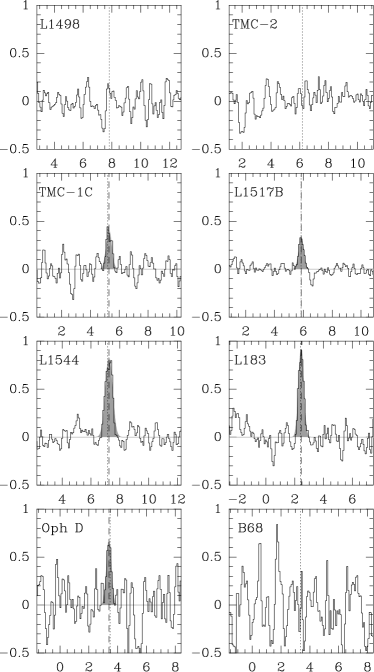
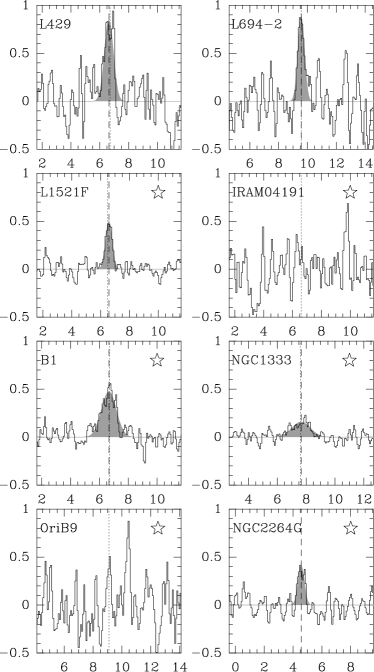
The ortho–) spectra are shown in Fig. 1, whereas the results of Gaussian fits to the lines are listed in Tab. 2. One striking thing which stands out from the figure and the table is the large variation in intensity (factor of 5) and linewidths (factor of 4), and not just between starless cores and protostellar cores. In column 5 of Tab. 2 we also report the non-thermal line width, defined as (see Myers et al. 1991):
| (2) |
where ( in Tab. 2) is the observed line width and is the thermal linewidth of the observed molecule, calculated assuming the kinetic temperatures listed in column 3 of Tab. 3. It is interesting to note that the ortho–) non-thermal line width is on average two times larger than that derived from the (2-1) data of Crapsi et al. (2005) (using the same kinetic temperature), the only exception being B 68, where both the (2-1) and ortho–) lines are totally thermally broadened. The larger non-thermal line widths (and the moderate optical depths, see Sect. 4) indicate that the ortho– lines are tracing a region within the cores with more prominent internal motions than the (2–1) lines, even in L 1544, where the emission of these two lines has the same morphology and extension (Vastel et al. 2006a).
| Source | a | ||||||
|---|---|---|---|---|---|---|---|
| Name | (K ) | () | () | () | (K) | (K) | |
| Starless Cores | |||||||
| L 1498 | … | … | … | … | … | 0.6 | 0.13 |
| TMC–2 | … | … | … | … | … | 0.6 | 0.13 |
| TMC–1C | 0.190.02 | 5.290.03 | 0.440.06 | 0.340.09 | 0.41 | 0.5 | 0.12 |
| L 1517B | 0.140.01 | 5.850.02 | 0.400.04 | 0.290.05 | 0.33 | 0.5 | 0.06 |
| L 1544b | 0.500.03 | 7.280.02 | 0.500.03 | 0.410.03 | 0.93 | 0.7 | 0.11 |
| L 183 | 0.400.02 | 2.450.01 | 0.410.03 | 0.300.04 | 0.92 | 0.7 | 0.12 |
| Oph D | 0.280.05 | 3.400.03 | 0.390.09 | 0.270.11 | 0.67 | 0.4 | 0.26 |
| B 68 | … | … | … | … | … | 0.4 | 0.32 |
| B 68c | 0.0780.015 | 3.360.05 | 0.330.10 | 0.00.1 | 0.22 | 0.08 | |
| L 429 | 0.650.05 | 6.640.03 | 0.730.06 | 0.670.07 | 0.85 | 0.4 | 0.21 |
| L 694-2 | 0.500.05 | 9.560.03 | 0.530.07 | 0.450.08 | 0.88 | 0.45 | 0.24 |
| Protostellar Cores | |||||||
| NGC 1333 DCO+ | 0.250.02 | 7.650.06 | 1.490.12 | 1.440.12 | 0.16 | 0.7 | 0.05 |
| B 1 | 0.600.03 | 6.660.03 | 1.200.08 | 1.140.08 | 0.47 | 0.7 | 0.09 |
| IRAM 04191 | … | … | … | … | … | 0.65 | 0.23 |
| L 1521F | 0.280.02 | 6.580.02 | 0.530.03 | 0.410.04 | 0.50 | 0.6 | 0.07 |
| Ori B9 | … | … | … | … | … | 0.5 | 0.25 |
| Ori B9d | 0.070.03 | 9.200.06 | 0.420.15 | 0.250.25 | 0.16 | 0.04 | |
| NGC 2264G–VLA2 | 0.220.02 | 4.560.03 | 0.510.04 | 0.290.07 | 0.41 | 0.7 | 0.11 |
| Source | Ref.a | b | Ref. | c | c | (ortho–)c | ||
| Name | () | (K) | (1022 ) | (K) | (1013 ) | |||
| Starless Cores | ||||||||
| L 1498 | 1105 | 10 | 4 | 3.2 | 7 | 7.5,5.5 | 0.3,0.9 | 0.7,2 |
| TMC–2 | 3105 | 10d | 7 | 6.0 | 7 | 8.7,5.9 | 0.2,0.6 | 0.5,1.5 |
| TMC–1C | 1106 | 7 | 8,9 | 8.5 | 9 | 6.8,6.0 | 0.4,0.6 | 0.9,1.4 |
| L 1517B | 2105 | 9.5 | 4 | 3.7 | 7 | 8.0,5.6 | 0.2,0.9 | 0.4,1.8 |
| L 1544 | 2106 | 7 | 21 | 13 | 7i | 6.9,6.5 | 1.2,1.7 | 3.2,4.5 |
| L 183 | 2106 | 7 | 12,22 | 14 | 12 | 6.9,6.5 | 1.1,1.6 | 2.5,3.5 |
| Oph D | 5105 | 7 | 23 | 11 | 23 | 6.7,5.8 | 0.8,2.0 | 1.6,4.0 |
| B 68e | 3105 | 10 | 24,13 | 1.4 | 7 | 8.7,5.9 | 0.1,0.3 | 0.2,0.5 |
| L 429 | 6105 | 7d | 7 | 12 | 7i | 6.8,6.3 | 1.1,1.8 | 4.1,6.7 |
| L 694-2 | 9105 | 7d | 7 | 11 | 7i | 6.9,6.3 | 1.1,2.0 | 3.2,5.7 |
| 16293Ef | 2106 | 12 | 19 | 50 | 19 | 12,10 | 0.5,0.7 | 1.2,1.7 |
| Protostellar Cores | ||||||||
| NGC 1333 DCO+ | 1106d | 13 | 1 | 31 | 14 | 12,8.7 | 0.03,0.1 | 0.35,0.59 |
| B 1 | 3106 | 12 | 2,3 | 21 | 15 | 12,10 | 0.1,0.1 | 0.9,1.1 |
| IRAM 04191 | 5105 | 10 | 5 | 17 | 16 | 9.2,6.8 | ||
| L 1521F | 1106 | 9.3 | 6,20 | 14 | 7 | 8.9,7.3 | 0.2,0.4 | 0.7,1.1 |
| Ori B9g | 7104 | 10 | 10 | 4.0 | 10 | 6.8,4.2 | 0.1,0.4 | 0.2,0.9 |
| NGC 2264G–VLA2 | 8105 | 15 | 11 | 10 | 17 | 14,9.2 | 0.1,0.2 | 0.3,0.5 |
| NGC 1333 IRAS 4Ah | 2106 | 13 | 18 | 31 | 18 | 13,10 | 0.03,0.04 | 0.2,0.3 |
-
a
When more than one reference is listed, the first number refers to the source paper for the volume density and the second number refers to the source paper for the kinetic temperature. In the case of L 183, both parameters can be found in the two listed papers.
-
b
Values of have been estimated assuming a constant gas temperature of 10 K along the line of sight, except for those objects with central temperatures of 7 K (see item ”i” below).
-
c
The first value is calculated assuming a critical density =105 , whereas the second value is for = 106 .
-
d
Assumed value.
-
e
ortho- data from Hogerheijde et al. (2006), but method described in the text.
-
f
ortho-data from Vastel et al. (2004), but method described in the text.
-
g
Estimates of , and based on APEX data from Harju et al. (2006), but using the method described in the text.
-
h
Data from Stark et al. (1999), but method described in the text.
- i
References: (1) Hatchell (2003); (2) Lis et al. (2006); (3) Marcelino et al. (2005); (4) Tafalla et al. (2004); (5) Belloche & André (2004); (6) Crapsi et al. (2004); (7) Crapsi et al. (2005), in a 11″ beam; (8) Schnee & Goodman (2005); (9) Schnee et al. (2007); (10) Harju et al. (1993), in a 40″ beam; (11) Girart et al. (2000); (12) Pagani et al. (2004); (13) Hotzel et al. (2002); (14) van der Tak et al. (2002), in a 13″ beam; (15) Hatchell et al. (2005), in a 14″ beam; (16) Belloche et al. (2002), in a 11″ beam; (17) Gomez et al. (1994), within 20″; (18) Stark et al. (1999) ( measured in a 13″ beam); (19) Vastel et al. (2004) ( measured in a 13″ beam using Lis et al. 2002a data); (20) Kirk et al. (2007); (21) Crapsi et al. (2007); (22) Pagani et al. (2007); (23) Stamatellos et al. (2007); (24) Bergin et al. (2006).
In the category of ”shallow” cores, we have 3 non detections among 4 objects. The only shallow core detected in our survey is L 1517B, which is in fact the most compact and centrally concentrated of its class and has one of the narrowest lines observed so far (together with the denser core Oph D): 0.4 , only 1.2 times larger than the thermal linewidth at 10 K, as measured with observations (Tafalla et al. 2004). Recent observations carried out with the APEX telescope have actually revealed a probable ortho- emission in one of our non–detected shallow cores, B 68 (Hogerheijde et al. 2006). The detected line is indeed relatively faint ( = 0.2 K), very narrow (0.3 , practically thermal), and consistent with our non–detection ( = 0.3 K, see Tab. 2). The observations of the other two objects in this group (L 1498, TMC–2) have better sensitivities ( 0.13 K), but they may still hide the line if its intensity is similar to the one in B 68.
Among the five most centrally concentrated objects in the starless core sample, four show strong ( = 0.7 – 0.9 K) emission, whereas TMC–1C has 0.4 K. The line widths span the range between 0.4 (for Oph D) and 0.7 (for L 429), maybe reflecting contraction motions in different stages of core evolution or large optical depths (although simple analysis seems to discard this last hypothesis; see Sect. 4).
Also in the six (young) protostellar cores, the detection rate is quite large, with four lines detected. L 1521F has a line shape quite similar to that in L 1544 ( = 0.5 ), but the brightness temperature is 1.7 times lower, in agreement with the two times lower deuterium fractionation observed ( = 0.1 and 0.2, in L 1521F and L 1544, respectively; Crapsi et al. 2004; Caselli et al. 2002a). B 1 and NGC 1333– present the largest linewidth in the sample, suggesting that the active star formation is probably injecting energy in form of non–thermal motions and turbulence. We are confident that the broad line in NGC 1333– is not a baseline artifact, in particular because both the centroid velocity and the linewidth are coincident (within the errors) with those observed in D2S by Vastel et al. (2003) (but not with the ND3 line observed by van der Tak et al. 2002, which remains a puzzle). The line in NGC 2264G is narrower than in B 1 and NGC 1333– and more similar to L 1521F, probably indicating that the circumstellar environment is still quite pristine.
3.2 para-
The para-(11,0-10,1) line has been searched for in four sources (B 1, NGC 1333–, NGC 2264G–VLA2, and L 183). Tab. 4 lists the spectral resolution (, column 2), the system temperature (, column 3) and the integration time (, column 4) of the observations. The rms noise and the upper limits of the radiation temperature (or brightness temperature, assuming a unity filling factor) are in columns 5 and 6, respectively. From these data, we calculated the corresponding upper limits of the para- column density in each source, applying the same method as for ortho- (see Sect. 4) and assuming a critical density for the transition of 105 , a line width equal to that measured for the line (Tab. 2), except for 16293E (for which we used the para- line width observed by Vastel et al. 2003), the kinetic temperature and volume densities listed in Tab. 3, and the following parameters for the para-(11,0-10,1) transition: frequency = 691.660483 GHz, Einstein coefficient for spontaneous emission = 4.5510-4 s-1, rotational constants as given in Tab. 4 of Amano & Hirao (2005), lower state energy of 50.2 K, and degeneracy of the upper and lower levels equal to 9.
| Source | a | b | |||||||
|---|---|---|---|---|---|---|---|---|---|
| Name | () | (K) | (min) | (K) | (K) | (K) | (1013 cm-2) | ||
| B 1 | 0.083 | 3950 | 251 | 0.068 | 0.20 | 0.4 | 11.9 | 0.9 | 1.0 |
| NGC 1333– | 0.083 | 3300 | 91 | 0.068 | 0.20 | 0.4 | 12.6 | 0.9 | 2.6 |
| NGC 2264G–VLA2 | 0.021 | 1436 | 93 | 0.045 | 0.14 | 0.4 | 14.4 | 0.2 | 0.7 |
| L 183 | 0.042 | 1770 | 42 | 0.084 | 0.25 | 0.4 | 6.9 | 7.9 | 3.2 |
| 16293Ed | 0.10 | … | 103 | 0.19 | 0.85 | 0.60 | 10.7 | 1.20.5 | 1.0 |
| L 1544e | 0.021 | … | 230 | 0.18 | 0.54 | 0.4 | 7.6 | 2.5 | 0.8 |
-
a
In radiation temperature units.
-
b
Excitation temperature assuming a critical density of 105 for the observed transition.
-
c
.
-
d
Data from Vastel et al. (2004). The column density has been estimated using the method described in the text.
- e
The last column of Tab. 4 shows the ratio between the upper-limit column densities of para- and the ortho- column densities listed in Tab. 3. The estimated values are well within those calculated by Flower et al. (2004) (see their figure 7) for cloud cores with volume densities 2106 and temperature ranges between 10 and 15 K.
4 Analysis
4.1 Derivation of the average ortho- column densities
In this section we estimate the average ortho– column density in each source, assuming that the line is emitted in homogeneous spheres at the density and temperature respectively quoted in the literature and reported in Tab. 3. Values of the column densities are also reported in Tab. 3, column 5, and they are used to determine the fractional abundance of ortho– (see Sect. 4.3). The values for L 1544, L 429 and L 694-2 have been determined by Crapsi et al. (2005) assuming constant temperature. However, a temperature gradient has been measured toward L 1544 (Crapsi et al. 2007) and assumed (because of the similar physical structure) in L 429 and L 694-2, so that needs to be modified. As found by Pagani et al. (2004) and Stamatellos et al. (2007), the temperature drop in L 183 and Oph D implies an increase in by a factor of about 1.4. Given that L 1544, L 429 and L 694-2 have structures similar to L 183 and Oph D, we simply multiplied the Crapsi et al. (2005) values by the same correction factor (1.4) to account for the temperature gradient and this is what is reported in Tab. 3.
We further assume that the level structure of the ortho– molecule is reduced to a two–level system. This is especially justified in starless cores, considering that the first excited state is 17.4 K above ground and the second one is 110 K. In star forming regions, we assume that the observed line is arising from gas with characteristics not significantly different from starless cores (which is probably true in L 1521F and NGC 2264G–VLA2, see Sect. 3). In the case of B 1 and NGC 1333–, the broad lines suggest that the embedded young stellar objects have probably increased the degree of turbulence in the region and may have locally altered the conditions where emits. However, we should point out that where the gas temperature increases above 20 K, and/or where shocks are present, should not survive for long, considering that in these conditions the backward reaction (1) can quickly proceed and that dust mantles can be either evaporated or sputtered back into the gas phase, with the consequence of increasing the CO abundance and thus the destruction rate of .
To estimate the average ortho– column density, we evaluate the excitation temperature Tex and the line optical depth simultaneously, by solving iteratively the following equations (valid for ):
| (3) |
| (4) |
| (5) |
Eq. (3) is the definition of Tex corrected for the line opacity: in practice, the critical density is reduced by the probability that the emitted photon can indeed escape absorption. We adopted the photon escape probability of Eq. 4, valid for an homogeneous sphere (Osterbrock 1989). Finally the line optical depth is derived from the observation via equation (5). In the above equations, is the energy of the transition ( = 17.4 K, with the Boltzmann constant), is the particle volume density (assumed to be 1.2, to account for He), Tkin is the gas temperature, and and are the equivalent Rayleigh–Jeans excitation and background temperatures.
The ortho– column density is then derived from :
| (6) |
A key parameter is the critical density ncr of the transition. Recent and unpublished calculations by E.Hugo and S.Schlemmer (private communication) suggest a collisional coefficient with ortho and para of cm3s-1 at 10 K, with a very shallow dependence on the temperature. The implied critical density is cm-3, namely a factor of 10 lower than assumed in previous work (Black et al. 1990; van der Tak et al. 2005). The ortho– column densities, calculated both with the new and old critical density values, are reported in Tab. 3. The lines are either optically thin (e.g. in B 68) or marginally thick (1, in L 1544, L 183, L 694-2, L 429). From the table, it is clear that a factor of 10 variation in the collisional coefficient implies a change in the column density value of factors between 1.4 and 4.5, depending on the volume density and kinetic temperature. In the following analysis we use the column densities calculated with the 105 cm-3 critical density.
The four objects which show the largest values of are among the most centrally concentrated cores in the sample: L 429, L 1544, L 694-2 and L 183. The two other dense cores, TMC–1C and Oph D have significantly lower ortho– column densities, and this may be related to different evolutionary stages. We will further discuss these issues in Sect. 5.
4.2 Evaluation of the errors
The estimates of the ortho– column densities reported in Tab. 3 suffer from several sources of uncertainties. We already mentioned a basic source of uncertainty, that associated with the collisional coefficient of the transition. In addition to that, the densities and temperatures used to derive the excitation temperatures are also relatively uncertain, not only because of the uncertainty in deriving these values at the centers of the studied sources but also because the line emission may originate in denser than the quoted average density gas due to the abundance distribution. In this context, the errors associated with the rms of the observations reported in Tab. 2 are certainly the smallest in the error propagation chain. Although it is difficult to exactly quantify the error in the determination of the ortho– column densities, we estimate here how reasonable changes in the gas temperature and density would affect the reported column densities. Increasing or decreasing the density by a factor of 2 results in decreasing/increasing the ortho– column densities by less than 30%. However, a change in the kinetic temperatures of Tab. 3 by 1 K would change the ortho– column densities by up to a factor of 2 in the coldest objects (because of the exponential in the level population equation).
4.3 Correlations
We have looked for possible correlations between the column density or fractional abundance of ortho- and physical parameters such as the volume density, the column density, the kinetic temperature and the non–thermal line width. No significant correlations have been found, with the exception of ( , with from Tab. 3) vs. , for which we find (see Fig. 2):
| (7) |
with a correlation coefficient of -0.83. What is causing the ortho-drop observed between 7 K and 15 K? Partially, this may be due to the fact that the warmest sources: (i) may have a smaller ortho- emitting region than found in L 1544 (about 60′′; Vastel et al. 2006a), because of a drop of the ortho- abundance (see Fig. 6 of Flower et al. 2004) and (ii) are all at distances 300 pc (with the exception of 16293E, which, by the way, follows the trend). Thus, the emission may be affected by beam dilution (not considered in this study). However, as we will see in the next section, variations in the CO depletion factor, linked to the gas density and, in turn, to the gas and dust temperature (at least in starless cores, larger temperatures are typically associated with lower gas densities, lower CO depletion factors, and lower deuterium–fractionations), can also (at least partially) produce the observed trend. In any case, a more detailed physical and chemical structure (such as that recently developed by Aikawa et al. 2008) is needed to investigate these points, although the lack of information on the extent and morphology of the emission prevents us from a more quantitative analysis of the correlations between the gas traced by and the physical properties of the selected cores.

In the following we will concentrate on molecular abundances and use both a simple chemical model applied to a homogeneous cloud and a slightly more detailed chemical-physical model of a centrally concentrated and spherically symmetric cloud to reproduce and interpret the observed variations of ortho-column densities, deuterium fractionation and CO depletion fraction in the selected cores.
5 Chemical Discussion
The chemistry of starless cores and their degree of deuteration has been investigated in detail by Roberts et al. (2003), Flower et al. (2004), Roberts et al. (2004), Walmsley et al. (2004), Aikawa et al. (2005), Flower et al. (2005), Flower et al. (2006a), Flower et al. (2006b). From these models it appears that there are several sources of uncertainty that can profoundly affect the chemistry: (i) surface chemistry (diffusion and reaction rates are still quite uncertain and highly dependent upon the poorly known surface of dust grains); (ii) freeze–out and desorption rates (binding energies may be changing throughout the core, due to changes in grain mantle composition, and nonthermal desorption processes are poorly known; see Garrod et al. 2006, 2007); (iii) the dynamical evolution of dense cores is hard to constrain chemically, and different theoretical models of star formation predict significantly different time scales (e.g. Shu et al. 1987 and Hartmann et al. 2001); (iv) the cosmic–ray ionization rate is not well constrained, and our ignorance in the cosmic–ray energy spectrum (especially at low energies) prevents us from making quantitative estimates on the possible variations of within dense cores (see Padoan & Scalo 2005, for a recent discussion on this point, and Dalgarno 2006 for a more general review); (v) the fraction of ortho–, which affects the deuteration in the gas phase (the backward reaction (1) proceeds faster with ortho–, because of its higher energy compared to para–; Gerlich et al. 2002, hereafter GHR02; Walmsley et al. 2004); (vi) the dust grain size distribution (if dust grains coagulate in the densest regions of starless cores, the freeze–out rate diminishes, altering the gas phase chemical composition; see, e.g. Flower et al. 2006a; Vastel et al. 2006a); (vii) the abundance of polycyclic aromatic hydrocarbons (PAHs), unknown in dark clouds (where observational constraints are yet to be found), which may significantly affect the electron fraction (Lepp & Dalgarno 1988; Flower & Pineau des Forêts 2003; Tielens 2005); (viii) the fraction of atomic oxygen in the gas phase, which is thought to be low (mainly to explain the stringent SWAS upper limits on the water abundance; e.g. Bergin & Snell 2002), but observations of dark clouds with the ISO satellite appear to disprove this (Caux et al. 1999; Vastel et al. 2000; Lis et al. 2001), although the limited velocity resolution of ISO LWS is a severe limit on these results. In the following section, the effects of some of the above parameters on the deuterium fractionation will be presented for the simple case of a homogeneous cloud. In Sec. 5.2, a more detailed physical structure and a slightly more comprehensive chemical model will be considered to make an attempt on constraining some of the unknown parameters.
5.1 Simple Theory: what affects deuterium fractionation
Ignoring for the moment the density and temperature structure of molecular cloud cores and any gas-dust interaction, which will be considered in Sect. 5.2, we show here simple relations between the / abundance ratio and parameters such as the gas kinetic temperature, the grain size distribution, the CO depletion factor and the cosmic-ray ionization rate. We use a simple chemical network which includes all the multiply deuterated forms of , formed following the reaction scheme listed in Tab. 5 and destroyed by CO, electrons (dissociative recombination) and negatively charged dust grains (recombination). The adopted rate coefficients are the same as in Tab. 1 of Ceccarelli & Dominik (2005), with the exception of the reaction of (and deuterated isotopologues) with CO, and the reaction of and electrons, for which we used the values listed in the latest release of the UMIST database (RATE06) available at http://www.udfa.net/. We note that the rate coefficient of the + CO reaction in the UMIST database is temperature-independent, as expected for ion–molecule reactions where the neutral species has a small dipole moment (E. Herbst, private communication).
| Reaction | Rate | Ref. | |||
| cm3 s-1 | K | ||||
| H + HD H2D+ +H2 | k1, k-1 | 1.7 10-9 | 0 | 220 | (1) |
| H2D+ + HD D2H+ +H2 | k2, k-2 | 8.1 10-10 | 0 | 187 | Roberts et al. (2004) |
| D2H+ + HD D +H2 | k3, k-3 | 6.4 10-10 | 0 | 234 | Roberts et al. (2004) |
| H + CO HCO+ + H2 | kCO | 1.7 10-9 | 0 | 0 | RATE06 |
| H2D+ + CO HCO+ + HD | kCO | 1.7 10-9 | 0 | 0 | RATE06 |
| DCO+ + H2 | |||||
| D2H+ + CO HCO+ + D2 | kCO | 1.7 10-9 | 0 | 0 | RATE06 |
| DCO+ + HD | |||||
| D + CO DCO+ + D2 | kCO | 1.7 10-9 | 0 | 0 | RATE06 |
| H + e- | krec0 | 6.7 10-8 | -0.52 | 0 | RATE06 |
| H2D+ + e- | krec1 | 6.0 10-8 | -0.5 | 0 | Sundström et al. (1994) |
| D2H+ + e- | krec2 | 6.0 10-8 | -0.5 | 0 | Roberts et al. (2004) |
| D + e- | krec3 | 2.7 10-8 | -0.5 | 0 | Larsson et al. (1997) |
(1) At the low temperatures found in our starless and protostellar cores, this rate corresponds to the Langevin limit.
The steady state equations for this simple system are:
| (8) | |||||
| (9) | |||||
| (10) |
with
In the above expressions, , , and , , are the forward and backward rate coefficients relative to reactions of , , and , respectively, with HD; is the fractional abundance (w.r.t. ) of species ; = 310-5 is the fractional abundance of HD (assuming that [D]/[H] = 1.510-5, Oliveira et al. 2003, and that in molecular clouds the deuterium is mainly in the form of HD); is the rate coefficient of the destruction reaction of all isotopologues with CO; = , where = 9.510-5 is the canonical abundance of CO as measured by Frerking et al. (1982), and is the CO depletion factor (1/ is the fraction of CO molecules left into the gas phase, see Sect. 5.2.2); , , are the dissociative recombination rate coefficients for , , and , respectively. Following Draine & Sutin (1987) (see also Crapsi et al. 2004), the rate coefficient for the recombination onto dust grains has the form:
| (11) |
where (=50 Å) is the minimum radius of dust grains in the Mathis et al. (1977) (MRN) size distribution ( = 2.510-5 cm). Finally, the fractional abundance () of dust grains in a MRN size distribution is given by:
| (12) |
The electron fraction is calculated as in Caselli et al. (2002b), using a simplified version of the reaction scheme of Umebayashi & Nakano (1990), where we compute a generic abundance of molecular ions “mH+” assuming formation due to proton transfer with and destruction by dissociative recombination on grain surfaces (using rates from Draine & Sutin 1987). is formed as a consequence of cosmic–ray ionization of and destroyed by proton transfer with CO and . Metals are also taken into account and their fractional abundance has been assumed 10-7 (following the initial abundances of ”low-metal” models, appropriate for dark clouds; Lee et al. 1996).
The deuterium fractionation in species such as or ( []/[] or []/[]) in this chemical scheme is simply given by:
| (13) |
Fig. 3 shows the []/[], []/[], []/[] and abundance ratios as a function of gas temperature, for different values of the depletion factor (top panel), the minimum value of the dust grain radius in the grain–size distribution, (central panel), and the cosmic–ray ionization rate, (bottom panel). The first thing to note is the sharp drop in the deuterium fractionation at temperatures above 15 K, when reaction (1) and the analogous ones for the formation of and also start to proceed backward. Between 5 and 10 K, the deuteration ratios increase because of the inverse temperature dependence of the destruction rate coefficients , , and (present in the denominator of eqs. 8, 9, and 10). Note the high peaks in the = 50 and 100 []/[] curves. This is due to the fact that in regions where most of the neutrals are frozen (although here we only talk about CO, we can generalize this statement including in the CO–depletion factor all the neutral species which react with the isotopologues), the deuterium fractionation proceeds rapidly and is efficiently converted into , as already shown by Walmsley et al. (2004) in the case of dense cloud cores and by Ceccarelli & Dominik (2005) in the case of protoplanetary disks. The large abundances of yield large values ( 1).

Fig. 3 also shows that at temperatures below 17 K, the deuterium fractionation is very much dependent upon the CO depletion factor (a well known phenomenon; e.g. Dalgarno & Lepp 1984), the gas volume density (see the dotted curves in the top figures), the fractional abundance of dust grains and the cosmic–ray ionization rate. In particular, a value of = 510-8 cm (5 Å), corresponds to = 210-7, which may be regarded as a possible value for the fractional abundance of PAHs (e.g. Lepp & Dalgarno 1988; Tielens 2005). Thus, if PAHs are abundant in dense cores and they are the main negative charge carriers, the deuterium fractionation is expected to be 0.1, because the four isotopologues quickly recombine. The fact that molecules such as and show large deuterium fractionations (or large values) in the direction of pre-stellar cores and Class 0 sources ( 0.1; see Fig. 4), thus suggests that (negatively charged) PAHs have abundances significantly below 10-7.
The bottom panel of Fig. 3 shows that the larger the cosmic–ray ionization rate the smaller the deuteration ratios. This is mainly due to the fact that a larger value of implies a larger electron fraction, and a consequently larger dissociative recombination rate (see denominator of eqs. 8, 9, and 10). Again, the large deuterium fractionation observed in pre–stellar cores and Class 0 objects can be used to put upper limits on (see Dalgarno 2006).
Before proceeding to the next sub–section, we note here that the values obtained in this analysis for typical parameters ((i) 10, as typically observed in pre–stellar cores, (ii) = 50 Å, as in the MRN distribution, and (iii) 310-17 s-1) reach 0.5 for 15 K. This value may appear too large when compared to the deuterium–fractionation measured in pre–stellar cores by Crapsi et al. (2005), but it is quite close to the [NH2D]/[] ratio found by (1) Crapsi et al. (2007) in the nucleus of the pre–stellar core L 1544 using interferometric observations and by (2) Pillai et al. (2007) in Infrared Dark Clouds. However, the results presented in this section apply to an ideal homogeneous cloud and are based on “standard” rate coefficients for the proton–deuteron exchange reactions , , + HD. In fact, GHR02 have measured slower rates which, if adopted, lead to values about a factor of 3 lower compared to those obtained in Fig. 3. This will be discussed in the next sub–section.
5.2 Simple Chemical–Physical Model
In this section, our estimates of ortho– column densities are correlated with the deuterium fractionation and the depletion factor, previously measured in the same objects, and simple chemical models are used to investigate the observed variations among the various sources. The model used is similar to that described in Vastel et al. (2006a), and first applied by Caselli et al. (2002b) in the case of L 1544, but with the deuterium fractionation chemistry and rate coefficients as described in the previous sub–section. We consider a spherical cloud, with a given density and temperature profile, where dust and gas are present. Initially (besides ), CO and N2 are present in the gas phase with abundances of 9.510-5 (Frerking et al. 1982) and 3.7510-5, respectively. The abundance of assumes that 50% of the nitrogen is in atomic form (but no Nitrogen chemistry is considered, except for the adsorption/desorption onto/from dust grains and the formation and destruction of and ). This is a totally arbitrary choice, but the abundance is extremely uncertain (see e.g. Stepnik et al. 2003; Flower et al. 2006b; Maret et al. 2006) and in any case, its variation in the gas phase only affects, in our simple model, the absolute abundance of , without significantly affecting the /column density ratio. Atomic oxygen has not been included in the chemistry, in order to avoid one extra (uncertain) parameter in the model. It is worth to point out here that adding atomic oxygen to the chemical network lowers the deuterium fractionation, if its binding energy (also not well constrained) is sufficiently low (see e.g. Caselli et al. 2002b and their discussion in Sect. 3.2).
The dust grain distribution follows MRN and we assume a gas–to–dust mass ratio of 100. However, the size of the minimum dust radius, , has been increased by an order of magnitude, following recent (indirect evidences) of grain growth toward the center of dense cores (e.g. Flower et al. 2005; Bergin et al. 2006; Flower et al. 2006b; Vastel et al. 2006a). The higher adopted here (510-6 cm) lowers the freeze–out rate by a factor of 5 compared to the MRN value (by changing the surface area of dust grains), and it is the “best–fit” value for the L 1544 chemical model (see Caselli et al. 2002b; Vastel et al. 2006a). The freeze–out time scale of species () is given by:
| (14) | |||||
where is the sticking coefficient ( 1, as recently found by Bisschop et al. 2006), is the average thermal velocity of species , is the total number density of H nuclei ( = (H) + 2), is the atomic mass number of species , and
| (15) |
is the grain surface area per H nucleon in the MRN distribution (see also Weingartner & Draine 2001). The electron fraction is calculated as in Sect. 5.1.
The binding energies for CO and have been taken from Öberg et al. (2005), assuming that the mantle composition is a mixture of CO and H2O ice ((CO)/ = 1100 K and () = 0.9 (CO)). The cosmic–ray ionization rate used here is = 1.310-17 s-1, but we have also changed it to explore the effects on the chemistry (see next subsections). Different density structures have been considered (see below) and the (gas = dust111This assumption of similar dust and gas temperatures is only valid if the densities are larger than 105 (e.g. Goldsmith 2001). However, in the range of temperatures typical of low–mass dense cores, this approximation does not significantly change the results of our model. ) temperature profile is similar to the one found by Young et al. (2004) and parametrized so that:
| (16) |
The minimum (maximum) allowed temperature is 4 K (14 K). We also consider models with temperature profiles increasing inwards, to simulate the heating of the embedded young stellar object. In this case, we assume a central temperature of 50 K at a distance of 80 AU, and a radial dependence for AU. If the temperature drops below the one described in eq.(16), the latter value is used.
CO and can freeze–out (with rates given by 1/, see eq. 14) and return to the gas phase via thermal desorption or cosmic–ray impulsive heating (following Hasegawa et al. 1992 and Hasegawa & Herbst 1993). The abundance of the molecular ions (, , and their deuterated isotopologues) are calculated in terms of the instantaneous abundances of neutral species (assumption based on the short time scale of ion–chemistry, compared to the depletion time scale; see Caselli et al. 2002b for details).
5.2.1 vs. the observed
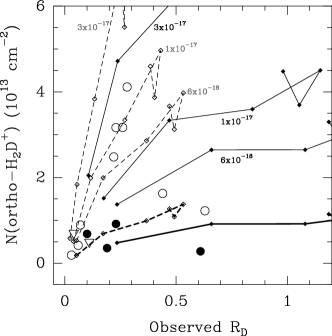
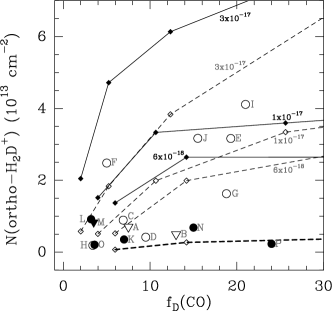
In Fig. 4, the column density of ortho– is plotted as a function of the observed deuterium fractionation ratio (). is equivalent to , in the case of starless cores (plus L 1521F), and this value has been taken from the survey of Crapsi et al. (2005). In star forming regions, the / column density ratio is not available, and other column density ratios have been used: (i) for NGC 1333– (Hatchell 2003) and for B 1 (Roueff et al. 2005); (ii) for NGC 2264G VLA2 (Loinard et al. 2002). No deuterium fractionation estimates are available for IRAM 04191. Given that and appear to trace similar zones of dense cores (e.g. Benson et al. 1998; Caselli et al. 2002c), and that both derive from the same parent species (), one expects that the D-fractionation observed in the two species is also similar (and linked to the theoretical in eq. 13). However, it is not obvious that formaldehyde is actually tracing the same region (indeed H2CO is centrally depleted in the two starless cores studied by Tafalla et al. 2006, unlike and ). In fact, Fig. 4 shows that the deuterium–fractionation in NGC 2264G is the largest one in the whole sample, probably suggesting that different deuteration mechanisms (beside the fractionation) may be at work for H2CO. One possibility is that surface chemistry is needed to explain the observed amount of deuterated formaldehyde and methanol, as originally discussed by Charnley et al. (1997), Ceccarelli et al. (1998), and more recently by Parise et al. (2006).


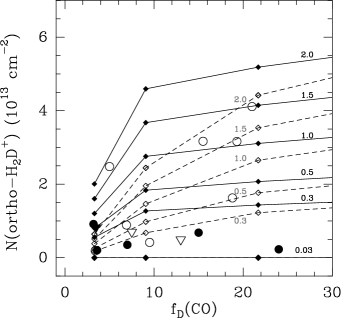
In the left panel, each data point is labelled with the corresponding name, whereas the right panel shows the same data points with model curves superposed (see below). The first thing to note is that, on average, dense protostellar cores (filled symbols) have lower values than starless cores, but on average they show quite large deuterium fractionations (especially in the case of NGC 2264G VLA2, where is coming from measurements of doubly deuterated formaldehyde, as already mentioned). Another thing to note is that there is not any clear correlation between and the observed . To investigate this unexpected result, we used the model described in Sec. 5.2 and simulate an evolutionary sequence, similar to what has been done in Crapsi et al. (2005) in their Fig. 5.
We consider Bonnor-Ebert (BE) spheres with density structures analogous to the radial (cylindrical) density profile of the contracting disk–like cloud at different stages of evolution in the model of Ciolek & Basu (2000), namely those at times = (=2.27 Myr and central densities = 4104 ), (=2.60 Myr, and = 4105 ), (=2.66 Myr, and = 4106 ), (=2.68 Myr, and = 4107 ), and (=2.684 Myr, and = 4108 ). The BE density profile is reasonably well reproduced by the parametric formula (Tafalla et al. 2002):
| (17) |
where = 13,000, 3,000, 800, 300, and 80 AU for , , , , and , respectively, and = 2. The five chemical models (i.e. the CO and N2 depletion chemistry in the five model clouds with different physical structure) have been run for a time interval given by ( - ), for = 2, 3, 4, and 5, whereas the model has been run for 2.27 Myr. We also consider a model cloud with the same density structure as the model, but with a temperature profile resembling that of a centrally heated protostellar core (model ), with a central temperature of 50 K and a temperature gradient proportional to (as mentioned above). The abundance profiles of , and calculated by the models have been convolved with 22″, 26″, and 17″ FWHM antenna beams, respectively, to simulate the observations and calculate the column densities toward the core center (as well as off peak).
The results of these models are the small diamonds in each of the curves in the right panel of Fig. 4, with lying on the left–end and on the right–end of the curve. Solid curves represent models with standard rate coefficients for the proton–deuteron exchange reactions, whereas dashed curves models use the about 3 times smaller GHR02 rates (see previous sub–section). The different curves correspond to models with different values of the o/p ratio of (o/p–), from 0.03 (bottom curves) to 2.0 (top curves). As discussed by Flower et al. (2004), the o/p ratio is a sensitive function of the o/p H2 ratio and, ultimately, of the gas temperature (see their Fig. 6) and at 15 K, it changes from 0.03 to values probably larger than one (this last statement is valid if the curve in Fig. 6 of Flower et al. (2004) is simply extrapolated at temperatures lower than 9 K, the minimum value in the figure222At a density of 2106 cm-3, temperature = 8 K, grain size 0.1 m, the o/p– is about 1.2 (Pineau des Forêts, priv. comm.) ). In all curves, the models show a slight decrease in both the column density and in the deuterium fractionation. In fact, at such high central densities: (i) is efficiently converted into and D , thus lowering the total column along the line of sight; (ii) significantly freezes onto dust grains, so that the /column density ratio – our measure of the observed – traces regions away from the center, where the density is lower and the temperature is higher. If a protostar is present, the column density increases again because of the less efficient transformation of into , while decreases (see also Fig. 3) because of the less abundant . From the comparison between the data and the model, one is tempted to conclude that indeed variations in the o/p– ratio (and ultimately in the gas temperature of the central few thousand AU of dense cores) can explain the observed scatter among the cores. It is interesting to note that the two pre-stellar cores with high values of and relatively low ortho– column densities are both embedded in the Ophiuchus Molecular Cloud Complex: Oph D and 16293E. Chemical abundances observed in these two cores are consistent with a lower o/p ratio, suggesting possible (slightly) larger kinetic temperatures.
Fig. 5 shows two other attempts to interpret the data. The left panel considers exactly the same models as in Fig. 4 but now the o/p–ratio is fixed at 0.5 (consistent with dense gas at 9 K; see Flower et al. 2004), whereas the free parameter is the cosmic–ray ionization rate , which is varied from 610-18 s-1 (bottom dashed and solid curves) and 310-17 s-1 (top curves). We note that variations in the cosmic–ray ionization rate are known to exist in the Galaxy (van der Tak et al. 2006). The four pre–stellar cores with the largest values (L 492, L 1544, L 694–2, and L 183) can all be reproduced by – (–) models with the GHR02 (standard) rates and = 110-17 s-1 (with L 429 (L 183) being the most (least) dynamically evolved). Significantly lower values of ( 610-18 s-1) appear to be required in the protostellar and Ophiuchus cores. However, an alternative way to reproduce these data, without requiring extremely low values, is to lower the o/p– ratio, as found before (the thick dashed curves represent models with o/p– = 0.3 and = 610-18 s-1). In B 68, only the low o/p– model curve (at early evolutionary times) can reproduce the low column densities and deuterium fractionations, the lowest in the sample.
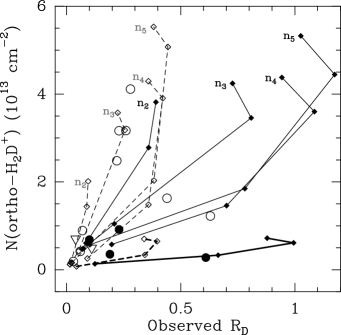
In the right panel of Fig. 5, we consider five clouds with structure as in the (= 2, …, 5) models (see eqn. 17) and for each of them we follow the chemical evolution, checking the results after 103, 104, 105, and 106 yr. This allows us to explore how different chemical ages can change the gas composition and avoid the problem of fixing the (unknown) chemical evolution time as in the right panel of Fig. 4. As for the left panel, the o/p– ratio has been fixed at 0.5, except for the thick curves, representing the protostellar cloud models, where o/p = 0.1, assuming that the gas has been (slightly) heated compared to the pre–stellar cores. The cosmic–ray ionization rate is fixed at 1.310-17 s-1. The four ortho-– rich pre-stellar cores can be reproduced by models, with (chemical) ages between 104 and 106 yr, when GHR02 rate coefficients are used. On the other hand, the protostellar cores and the two Ophiuchus cores are better matched by the more dynamically evolved (centrally concentrated) and models, respectively, after about 103–104 years of (chemical) evolution.
5.2.2 vs. the observed
From the models described in the previous subsection, one can directly derive the abundance of CO within each cloud model as a function of cloud radius and, as before, is obtained, after integrating the CO number density along the line of sight and smoothing the results with a 22″ beam width (to simulate observations carried out at the IRAM 30m antenna, where most of the cores have been observed). From the model column density, the CO depletion factor, (CO) is easily calculated using the expression:
| (18) |
where (CO) is the “canonical” or “undepleted” abundance of CO (assumed here equal to 9.510-5, following Frerking et al. 1982, but known to be uncertain by a factor of about 2, see e.g. Lacy et al. 1994).
To compare our model predictions with the data, we collect from the literature the values of observed (CO) and plotted them versus in Fig. 6. The majority of the (CO) data comes from Crapsi et al. (2005), except for: (i) TMC–1C ((CO) = 6.9, from Schnee et al. 2007), (ii) L 183 ( = 5, from Pagani et al. 2005); (iii) NGC 1333– ( = 12, from Jørgensen et al. 2002); (iv) B 1 ((CO) = 3.2, from Lis et al. 2002b); (v) IRAM 04191 ((CO) = 3.5 from Belloche & André 2004); (vi) OriB 9 ((CO) = 3.6, from Harju et al. 2006, for , and Caselli & Myers 1995, for ). Also, for L 1544, L 429, L 694-2 and Oph D, the new values of , adopted to take into account the temperature structure (see Tab. 3), imply different values of (larger by a factor of about 1.4, the ratio between the new and old values, as explained in Sect. 4.1) from what reported by Crapsi et al. (2005). The data and model results are shown in Fig. 6. In general, the presence of embedded young stellar objects appears to lower the column density, without affecting much the amount of CO freeze-out, which is probably still large in the high density and cold protostellar envelopes. The possible (small) temperature increase caused by the central heating, is thus not sufficient to significantly release CO back in the gas phase, but it can affect the o/p– ratio (and, consequently, the ortho- column density), as discussed in the previous sub–section.
In the left panel of Fig. 6, the data are compared with the same models described in Fig. 5 (left panel; , =1, 2, …5), where the cosmic–ray ionization rate is varied from 610-18 s-1 to 310-17 s-1. The o/p– ratio has been fixed at 0.5, except for the thick dashed curve, where o/p = 0.1, value probably more appropriate for protostellar cores (see previous sections). Now, – models (depending on the rate coefficient values adopted for the proton–deuteron exchange reactions), with 10-17 s-1, can explain the observations toward the ortho-– rich pre–stellar cores, with the exception of L 183, where the low value suggests a younger dynamical phase, consistent with what found in the previous sub-section (we also note that L 183 and TMC-1C appear to have similar ages, but with different cosmic ray ionization rate and/or o/p- ratio, see right panel of Fig. 6). Lower o/p– ratios are needed to reproduce the protostellar and Ophiuchus cores, as found for the vs. relation.
The right panel of Fig. 6 shows the same set of data and models, but now has been fixed at 1.310-17 s-1, whereas the o/p– ratio has been changed as in Fig. 4. As already noted, L 1544, L 429, L 694-2, and L 183 data are best reproduced by large values of the o/p– ratio, and the appropriate physical structure is that of – models , similarly to the left panel (with L 183 being the least evolved). This implies cores slightly more evolved than what found in Fig. 4 (right panel) and Fig. 5 (left panel), where (standard rate) models between and were preferred. The small discrepancy can be understood if the predicted CO depletion factor is too large compared with observations. Reasons for this could be: (i) we are missing an important desorption mechanism (besides the cosmic–ray impulsive heating and the thermal desorption, the latter not being efficient at the temperatures of these objects); (ii) unlike our spherical and isolated model cores, real cloud cores are embedded in molecular clouds where CO is quite abundant. Thus, the observed “extra” gaseous CO may be part of the undepleted material accreting onto the core from the surrounding molecular cloud (see also Schnee et al. 2007 for a similar conclusion in the particular case of TMC–1C).
6 Conclusions
Low–mass dense cloud cores have been observed with the CSO antenna at the frequency of the ortho–(11,0–11,1) line. The main conclusions of this work are:
1) In starless cores, the line has been detected in 7 (out of 10) objects. The brightest lines ( = 0.7-0.9 K) are observed toward the densest and more dynamically evolved starless cores (L 1544, L 183, Oph D, L 429, and L 694-2), where the deuterium fractionation and the CO depletion factor are largest. Non-detections are found in cores less centrally concentrated and dense than the rest of the sample (L 1498, TMC–2, and B 68). In B 68, recent APEX observations have detected a faint ortho– line with intensities consistent with our upper limit.
2) Significant differences in line widths are observed also among starless cores, with the narrowest lines ( 0.4 ) found in TMC–1C, L 1517B, Oph D, and L 183, whereas L 1544, L 429, and L 694-2 show = 0.5–0.7 .
3) The ortho–) line has been detected in 4 out of 6 protostellar cores, where we find 0.5 K (the largest value observed is toward L 1521F, which hosts a very low luminosity object recently detected by Spitzer). The broadest lines are observed toward the two cores in Perseus NGC 1333– and B 1, where 1 . The ortho–) lines have broader non–thermal widths than (2–1) lines, even in L 1544, where the two transitions have similar extension and morphology.
4) The ortho– column densities range between 2 and 401012 cm-2 in starless cores and between 2 and 9 1012 cm-2 in protostellar cores. Thus, protostars in the earliest stages of their evolution appear to have already changed the chemical structure of their envelopes, by lowering the ortho– fractional abundance but not their deuterium fractionation. This is probably due to (a few degree) variation of the gas temperature, which strongly affects the o/p– ratio. A similar effect is also found in the two Ophiuchus cores, suggesting a (slightly) larger gas temperature than in the other (mainly Taurus and Perseus) cores.
5) Simple models suggest that variations in the gas kinetic temperature, CO depletion factor, grain size distribution, cosmic–ray ionization rate and volume densities can largely affect the abundance relative to . In particular, gas temperatures above 15 K, low CO depletion factors and large abundance of negatively charged small dust grains or PAHs drastically reduce the deuterium fractionation to values inconsistent with those observed toward pre–stellar and protostellar cores.
6) Plots of the ortho– column density vs. (i) the deuterium fractionation observed in species such as and , and (ii) the observed CO depletion factor, show a large scatter. The data can be reproduced by chemical models of centrally concentrated cores assuming variations in the o/p ratio of (ultimately linked to kinetic temperature variations). Changes in the cosmic–ray ionization rate between 6 and 3010-18s-1 can also explain part of the scatter, but not those objects with large deuterium fractionations and low ortho– column densities (such as the Ophiuchus pre–stellar cores and the protostellar ones), for which a decrease of the o/p– ratio is required. The most deuterated and –rich objects are better reproduced by chemical models of centrally concentrated cores with = a few 106 and chemical ages between 104 and 106 yr. Protostellar cores, plus the two Ophiuchus cores, are better matched by lower o/p- ratios, more dynamically evolved (central densities 107 cm-3) models and chemical ages of 103-104 years. To better constrain dynamical and chemical ages, the rate coefficient for the proton-deuteron exchange reaction needs to be well defined.
7) The para-(1–2) upper limits are consistent with radiative transfer calculations if the fractional abundance of is 10-8. The para–(11,0–10,1) upper limits provide an upper limit of the para– to ortho– column density ratio (). We find 1 in all the sources (except for L 183 and NGC 1333–, where ), consistent with chemical model predictions of high density (2106 ) and low temperature ( K) clouds (Flower et al. 2004).
More accurate determinations of temperature and density profiles, as well as observations of the para–(10,1-10,0) line at 1.37 THz, are sorely needed to put more stringent constraints on gas–grain chemical processes in dense cloud cores.
Appendix A The search of para-
The line was observed to investigate the chemistry of oxygen in dense cores and, with the help of chemical models, to put some constraints on the oxygen abundance, which, analogously to CO, significantly affects the deuterium fractionation.
We searched for para-(1–2) in seven dense cores but only upper limits were measured. Tab. 6 lists the results of this search, including the rms noise and the corresponding upper limits of the column density, which have been calculated in two different ways: (i) using the volume density and kinetic temperature values listed in Tab. 3 (, column 6), and (ii) assuming a volume density of 105 and = 10 K (, column 8). In both cases, the RADEX333The RADEX code is available on-line at the URL http://www.sron.rug.nl/ vdtak/radex/radex.php. code has been used (van der Tak et al. 2007). The observed upper limits (see Tab. 6) are compatible with para– fractional abundance upper limits of 10-8 according to calculation made using the Ratran code (Hogerheijde & van der Tak 2000).
| Source | ||||||||
|---|---|---|---|---|---|---|---|---|
| Name | (K) | (K) | () | () | (K) | (1015 ) | (K) | |
| IRAM 04191 | 0.054 | 0.16 | 0.35 | 0.65 | 3.5 | 7.0 | 1.1 | 4.1 |
| L 1521F | 0.042 | 0.13 | 0.31 | 0.65 | 0.90 | 6.1 | 0.85 | 4.1 |
| L 1544 | 0.025 | 0.08 | 0.33 | 0.65 | 0.55 | 6.1 | 0.63 | 3.9 |
| L 183 | 0.031 | 0.09 | 0.23 | 0.6 | 0.53 | 5.9 | 0.50 | 3.9 |
| Oph D | 0.083 | 0.25 | 0.24 | 0.6 | 0.30 | 6.0 | 1.1 | 4.3 |
| L 429 | 0.043 | 0.13 | 0.40 | 0.6 | 1.5 | 5.5 | 1.1 | 4.1 |
| L 694-2 | 0.046 | 0.14 | 0.28 | 0.6 | 0.90 | 5.9 | 0.80 | 4.1 |
-
a
Assumed value, derived from previous (1–0) observations (see text).
-
b
Column density value obtained using and from Tab. 3.
-
c
Column density value assuming = 105 and = 10 K.
Acknowledgements.
We thank an anonymous referee for his/her very detailed review, which greatly improved the paper. PC acknowledges support from the Italian Ministry of Research and University within a PRIN project. Part of this research has been supported by NSF grant AST 05-40882 to the CSO. The authors thank the staff of the CSO telescope for their support. We also thank E. Hugo and S. Schlemmer for providing their collisional rates prior to publication.References
- Aikawa et al. (2001) Aikawa, Y., Ohashi, N., Inutsuka, S.-i., Herbst, E., & Takakuwa, S., 2001, ApJ, 552, 639
- Aikawa et al. (2005) Aikawa, Y., Herbst, E., Roberts, H., & Caselli, P., 2005, ApJ, 620, 330
- Aikawa et al. (2008) Aikawa, Y., Wakelam, V., Garrod, R. T., & Herbst, E., 2008, ApJ, 674, 984
- Alves et al. (1998) Alves, J., Lada, C. J., Lada, E. A., Kenyon, S. J., & Phelps, R., 1998, ApJ, 506, 292
- Alves et al. (2001) Alves, J., Lada, C. J., & Lada, E. A., 2001, Nature, 409, 159
- Amano & Hirao (2005) Amano, T., & Hirao, T., 2005, Journal of Molecular Spectroscopy, 233, 7
- André et al. (2000) André, P., Ward-Thompson, D., & Barsony, M. 2000, Protostars and Planets IV, 59
- Bacmann et al. (2002) Bacmann, A., Lefloch, B., Ceccarelli, C., et al., 2002, A&A, 389, L6
- Bacmann et al. (2003) Bacmann, A., Lefloch, B., Ceccarelli, C., et al., 2003, ApJ, 585, L55
- Belloche et al. (2002) Belloche, A., André, P., Despois, D., & Blinder, S., 2002, A&A, 393, 927
- Belloche & André (2004) Belloche, A., & André, P., 2004, A&A, 419, L35
- Benson & Myers (1989) Benson, P. J., & Myers, P. C., 1989, ApJS, 71, 89
- Benson et al. (1998) Benson, P. J., Caselli, P., & Myers, P. C., 1998, ApJ, 506, 743
- Bergin et al. (2001) Bergin, E. A., Ciardi, D. R., Lada, C. J., Alves, J., & Lada, E. A., 2001, ApJ, 557, 209
- Bergin & Snell (2002) Bergin, E. A., & Snell, R. L., 2002, ApJ, 581, L105
- Bergin et al. (2002) Bergin, E. A., Alves, J., Huard, T., & Lada, C. J., 2002, ApJ, 570, L101
- Bergin et al. (2006) Bergin, E. A., Maret, S., van der Tak, F. F. S., et al., 2006, ApJ, 645, 369
- Bergin & Tafalla (2007) Bergin, E. A., & Tafalla, M., 2007, ARA&A, 45, 339
- Bianchi et al. (2003) Bianchi, S., Gonçalves, J., Albrecht, M., et al., 2003, A&A, 399, L43
- Bisschop et al. (2006) Bisschop, S. E., Fraser, H. J., Öberg, K. I., van Dishoeck, E. F., & Schlemmer, S., 2006, A&A, 449, 1297
- Black et al. (1990) Black, J. H., van Dishoek, E. F., Willner, S. P., & Woods, R. C., 1990, ApJ, 358, 459
- Bonnor (1956) Bonnor, W. B., 1956, MNRAS, 116, 351
- Bottinelli et al. (2004a) Bottinelli, S., Ceccarelli, C., Lefloch, B. et al., 2004a, ApJ 615, 354
- Bottinelli et al. (2004b) Bottinelli, S., Ceccarelli, C., Neri, R., et al., 2004b, ApJ 617, L69
- Bottinelli et al. (2007) Bottinelli, S., Ceccarelli, C., Williams, J. P., & Lefloch, B., 2007, A&A, 463, 601
- Bourke et al. (2006) Bourke, T. L., Myers, P. C., Evans, N. J., II, et al., 2006, ApJ 649, L37
- Butner et al. (1995) Butner, H. M., Lada, E. A., & Loren, R. B., 1995, ApJ, 448, 207
- Caselli & Myers (1995) Caselli, P., &Myers, P. C., 1995, ApJ, 446, 665
- Caselli et al. (1999) Caselli, P., Walmsley, C. M., Tafalla, M., Dore, L., & Myers, P. C., 1999, ApJ, 523, L165
- Caselli et al. (2002a) Caselli, P., Walmsley, C. M., Zucconi, A., Tafalla, M., Dore, L., & Myers, P. C., 2002a, ApJ, 565, 331
- Caselli et al. (2002b) Caselli, P., Walmsley, C. M., Zucconi, A., Tafalla, M., Dore, L., & Myers, P. C., 2002b, ApJ, 565, 344
- Caselli et al. (2002c) Caselli, P., Benson, P. J., Myers, P. C., & Tafalla, M., 2002c, ApJ, 572, 238
- Caselli et al. (2003) Caselli, P., van der Tak, F. F. S., Ceccarelli, C., & Bacmann, A., 2003, A&A, 403, L37
- Caux et al. (1999) Caux, E., Ceccarelli, C., Castets, A., et al., 1999, A&A 347, L1
- Cazaux et al. (2003) Cazaux, S., Tielens, A. G. G. M., Ceccarelli, C., et al., 2003, ApJ, 593, L51
- Ceccarelli et al. (1998) Ceccarelli, C., Castets, A., Loinard, L., Caux, E., & Tielens, A. G. G. M., 1998, A&A, 338, L43
- Ceccarelli & Dominik (2005) Ceccarelli, C., & Dominik, C., 2005, A&A, 440, 583 (CD05)
- Ceccarelli et al. (2007) Ceccarelli, C., Caselli, P., Herbst, E., Tielens, A. G. G. M., & Caux, E., 2007, Protostars and Planets V, 47
- Charnley et al. (1997) Charnley, S. B., Tielens, A. G. G. M., & Rodgers, S. D.,1997, ApJ, 482, L203
- Ciolek & Basu (2000) Ciolek, G. E., & Basu, S., 2000, ApJ, 529, 925
- Crapsi et al. (2004) Crapsi, A., Caselli, P., Walmsley, C. M., et al., 2004, A&A, 420, 957
- Crapsi et al. (2005) Crapsi, A., Caselli, P., Walmsley, C. M., et al., 2005, ApJ, 619, 379
- Crapsi et al. (2007) Crapsi, A., Caselli, P., Walmsley, M. C., & Tafalla, M. 2007, A&A, 470, 221
- Dalgarno & Lepp (1984) Dalgarno, A., & Lepp, S. 1984, ApJ, 287, L47
- Dalgarno (2006) Dalgarno, A., 2006, Proceedings of the National Academy of Science, 103, 12269
- Draine & Sutin (1987) Draine, B. T., & Sutin, B., 1987, ApJ, 320, 803
- Ebert (1955) Ebert, R., 1955, Zeitschrift fur Astrophysik, 36, 222
- Evans et al. (2001) Evans, N. J., II, Rawlings, J. M. C., Shirley, Y. L., & Mundy, L. G., 2001, ApJ, 557, 193
- Flower & Pineau des Forêts (2003) Flower, D. R., & Pineau des Forêts, G., 2003, MNRAS, 343, 390
- Flower et al. (2004) Flower, D. R., Pineau des Forêts, G., & Walmsley, C. M., 2004, A&A, 427, 887
- Flower et al. (2005) Flower, D. R., Pineau Des Forêts, G., & Walmsley, C. M., 2005, A&A, 436, 933
- Flower et al. (2006a) Flower, D. R., Pineau Des Forêts, G., & Walmsley, C. M., 2006a, A&A, 449, 621
- Flower et al. (2006b) Flower, D. R., Pineau Des Forêts, G., & Walmsley, C. M., 2006b, A&A, 456, 215
- Frerking et al. (1982) Frerking, M. A., Langer, W. D., & Wilson, R. W., 1982, ApJ, 262, 590
- Galli et al. (2002) Galli, D., Walmsley, M., & Gonçalves, J., 2002, A&A, 394, 275
- Garrod et al. (2006) Garrod, R., Park, I. H, Caselli, P.,Herbst, E., 2006, Faraday Discuss., 2006, 133, 51
- Garrod et al. (2007) Garrod, R. T., Wakelam, V., & Herbst, E., 2007, A&A, 467, 1103
- Gerin et al. (2006) Gerin, M., Lis, D. C., Philipp, S., et al., 2006, A&A, 454, L63
- Gerlich et al. (2002) Gerlich, D., Herbst, E., & Roueff, E. 2002, Planet. Space Sci., 50, 1275 (GHR02)
- Girart et al. (2000) Girart, J. M., Estalella, R., Ho, P. T. P., & Rudolph, A. L. 2000, ApJ, 539, 763
- Goldsmith (2001) Goldsmith, P. F. 2001, ApJ, 557, 736
- Gomez et al. (1994) Gomez, J. F., Curiel, S., Torrelles, J. M., et al., 1994, ApJ, 436, 749
- Harju et al. (1993) Harju, J., Walmsley, C. M., & Wouterloot, J. G. A. 1993, A&AS, 98, 51
- Harju et al. (2006) Harju, J., Haikala, L. K., Lehtinen, K. et al., 2006, A&A 454, L55
- Hartmann et al. (2001) Hartmann, L., Ballesteros-Paredes, J., & Bergin, E. A., 2001, ApJ, 562, 852
- Harvey et al. (2003) Harvey, D. W. A., Wilner, D. J., Lada, C. J., Myers, P. C., & Alves, J. F., 2003, ApJ, 598, 1112
- Hasegawa et al. (1992) Hasegawa, T. I., Herbst, E., & Leung, C. M., 1992, ApJS, 82, 167
- Hasegawa & Herbst (1993) Hasegawa, T. I., & Herbst, E., 1993, MNRAS, 261, 83
- Hatchell (2003) Hatchell, J., 2003, A&A, 403, L25
- Hatchell et al. (2005) Hatchell, J., Richer, J. S., Fuller, G. A., et al., 2005, A&A, 440, 151
- Hily-Blant et al. (2008) Hily-Blant, P., Walmsley, M., Pineau Des Forêts, G., & Flower, D. 2008, A&A, 480, L5
- Hirano et al. (1999) Hirano, N., Kamazaki, T., Mikami, H., Ohashi, N., & Umemoto, T. 1999, Proceedings of Star Formation, Editor: T. Nakamoto, Nobeyama Radio Observatory, p. 181
- Hogerheijde & van der Tak (2000) Hogerheijde, M. R., & van der Tak, F. F. S. 2000, A&A, 362, 697
- Hogerheijde et al. (2006) Hogerheijde, M. R., Caselli, P., Emprechtinger, M., et al., 2006, A&A 454, L59
- Hotzel et al. (2002) Hotzel, S., Harju, J., & Juvela, M., 2002a, A&A, 395, L5
- Jørgensen et al. (2002) Jørgensen, J. K., Schöier, F. L., & van Dishoeck, E. F., 2002, A&A, 389, 908
- Keto & Field (2005) Keto, E., & Field, G., 2005, ApJ, 635, 1151
- Kirk et al. (2007) Kirk, J. M., Ward-Thompson, D., & André, P., 2007, MNRAS, 375, 843
- Kuiper et al. (1996) Kuiper, T. B. H., Langer, W. D., & Velusamy, T., 1996, ApJ, 468, 761
- Lacy et al. (1994) Lacy, J. H., Knacke, R., Geballe, T. R., & Tokunaga, A. T., 1994, ApJ, 428, L69
- Lada et al. (1991) Lada, E. A., Bally, J., & Stark, A. A., 1991, ApJ, 368, 432
- Lada et al. (1994) Lada, C. J., Lada, E. A., Clemens, D. P., & Bally, J., 1994, ApJ, 429, 694
- Lada et al. (2002) Lada, C. J., Bergin, E. A., Alves, J. F., & Huard, T. L., 2002, Bulletin of the American Astronomical Society, 34, 1157
- Larsson et al. (1997) Larsson, M., Danared, H., Larson, Å., et al., 1997, Physical Review Letters, 79, 395
- Lee et al. (1996) Lee, H.-H., Bettens, R. P. A., & Herbst, E., 1996, A&AS, 119, 111
- Lepp & Dalgarno (1988) Lepp, S., & Dalgarno, A., 1988, ApJ, 324, 553
- Lis et al. (2001) Lis, D. C., Keene, J., Phillips, T. G., Schilke, P., Werner, M. W., & Zmuidzinas, J., 2001, ApJ, 561, 823
- Lis et al. (2002a) Lis, D. C., Gerin, M., Phillips, T. G., & Motte, F. 2002a, ApJ, 569, 322
- Lis et al. (2002b) Lis, D. C., Roueff, E., Gerin, M., et al., 2002b, ApJ, 571, L55
- Lis et al. (2006) Lis, D. C., Gerin, M., Roueff, E., Vastel, C., & Phillips, T. G. 2006, ApJ, 636, 916
- Loinard et al. (2002) Loinard, L., Castets, A., Ceccarelli, C., 2002, P&SS, 50, 1205
- Marcelino et al. (2005) Marcelino, N., Cernicharo, J., Roueff, E., Gerin, M., & Mauersberger, R., 2005, ApJ, 620, 308
- Maret et al. (2006) Maret, S., Bergin, E. A., & Lada, C. J., 2006, Nature, 442, 425
- Mathis et al. (1977) Mathis, J. S., Rumpl, W., & Nordsieck, K. H., 1977, ApJ, 217, 425
- McKee (1989) McKee, C. F. 1989, ApJ, 345, 782
- Millar et al. (1989) Millar, T. J., Bennett, A., & Herbst, E., 1989, ApJ, 340, 906
- Myers et al. (1991) Myers, P. C., Ladd, E. F., & Fuller, G. A., 1991, ApJ, 372, L95
- Öberg et al. (2005) Öberg, K. I., van Broekhuizen, F., Fraser, H. J., et al., 2005, ApJ, 621, L33
- Oliveira et al. (2003) Oliveira, C. M., Hébrard, G., Howk, J. C., et al., 2003, ApJ, 587, 235
- Osterbrock (1989) Osterbrock, D.E., 1989, Book Review: Astrophysics of gaseous nebulae and active galactic nuclei. / University Science Books, Astronomy, vol. 17, no. 8, p. 102
- Padoan & Scalo (2005) Padoan, P., & Scalo, J. 2005, ApJ, 624, L97
- Pagani et al. (2003) Pagani, L., Lagache, G., Bacmann, A., 2003, A&A 406, L59
- Pagani et al. (2004) Pagani, L., Bacmann, A., Motte, F., 2004, A&A 2004, 417, 605
- Pagani et al. (2005) Pagani, L., Pardo, J.-R., Apponi, A. J., Bacmann, A., & Cabrit, S. 2005, A&A, 429, 181
- Pagani et al. (2007) Pagani, L., Bacmann, A., Cabrit, S., & Vastel, C. 2007, A&A, 467, 179
- Parise et al. (2004) Parise, B., Castets, A., Herbst, E., et al., 2004, A&A, 416, 159
- Parise et al. (2006) Parise, B., Ceccarelli, C., Tielens, A. G. G. M., et al., 2006, A&A, 453, 949
- Parise et al. (2002) Parise, B., Ceccarelli, C., Tielens, A. G. G. M., et al., 2002, A&A 393, L49
- Pillai et al. (2007) Pillai, T., Wyrowski, F., Hatchell, J., Gibb, A. G., & Thompson, M. A., 2007, A&A, 467, 207
- Roberts & Millar (2000a) Roberts, H., & Millar, T. J. 2000a, A&A, 364, 780
- Roberts & Millar (2000b) Roberts, H., & Millar, T. J. 2000b, A&A, 361, 388
- Roberts et al. (2003) Roberts, H., Herbst, E., & Millar, T. J. 2003, ApJ, 591, L41
- Roberts et al. (2004) Roberts, H., Herbst, E., & Millar, T. J. 2004, A&A, 424, 905
- Roueff et al. (2005) Roueff, E., Lis, D. C., van der Tak, F. F. S., Gerin, M., & Goldsmith, P. F., 2005, A&A, 438, 585
- Schnee & Goodman (2005) Schnee, S., & Goodman, A. 2005, ApJ, 624, 254
- Schnee et al. (2007) Schnee, S., Caselli, P., Goodman, A. A., et al., 2007, ApJ, 671, 1839
- Schnee et al. (2007) Schnee, S., Kauffmann, J., Goodman, A., & Bertoldi, F. 2007, ApJ, 657, 838
- Shu et al. (1987) Shu, F. H., Adams, F. C., & Lizano, S., 1987, ARA&A, 25, 23
- Stamatellos et al. (2007) Stamatellos, D., Whitworth, A. P., & Ward-Thompson, D., 2007, MNRAS, 379, 1390
- Stark et al. (1999) Stark, R., van der Tak, F. F. S., & van Dishoeck, E. F., 1999, ApJ, 521, L67
- Stepnik et al. (2003) Stepnik, B., Abergel, A., Bernard, J.-P., et al. 2003, A&A, 398, 551
- Sundström et al. (1994) Sundstrom, G., Mowat, J.R., Danared, H., et al., 1994, Science, 263, 785
- Tafalla et al. (2002) Tafalla, M., Myers, P. C., Caselli, P., Walmsley, C. M., & Comito, C., 2002, ApJ, 569, 815
- Tafalla et al. (2004) Tafalla, M., Myers, P. C., Caselli, P., & Walmsley, C. M., 2004, A&A, 416, 191
- Tafalla et al. (2006) Tafalla, M., Santiago-García, J., Myers, P. C., et al., 2006, A&A, 455, 577
- Tielens (2005) Tielens, A. G. G. M., 2005, The Physics and Chemistry of the Interstellar Medium, Cambridge University Press, 2005.
- Tiné et al. (2000) Tiné, S., Roueff, E., Falgarone, E., Gerin, M., & Pineau des Forêts, G. 2000, A&A, 356, 1039
- Turner (1990) Turner, B. E. 1990, ApJ, 362, L29
- Umebayashi & Nakano (1990) Umebayashi, T., & Nakano, T. 1990, MNRAS, 243, 103
- van der Tak et al. (2002) van der Tak, F. F. S., Schilke, P., Müller, H. S. P., et al., 2002, A&A, 388, L53
- van der Tak et al. (2005) van der Tak, F. F. S., Caselli, P., & Ceccarelli, C., 2005, A&A, 439, 195
- van der Tak et al. (2006) van der Tak, F. F. S., Belloche, A., Schilke, P., et al., 2006, A&A, 454, L99
- van der Tak et al. (2007) van der Tak, F. F. S., Black, J. H., Schöier, F. L., Jansen, D. J., & van Dishoeck, E. F., 2007, A&A, 468, 627
- Vastel et al. (2000) Vastel, C., Caux, E., Ceccarelli, C., et al., 2000, A&A, 357, 994
- Vastel et al. (2003) Vastel, C., Phillips, T. G., Ceccarelli, C., & Pearson, J., 2003, ApJ, 593, L97
- Vastel et al. (2004) Vastel, C., Phillips, T. G., & Yoshida, H., 2004, ApJ, 606, L127
- Vastel et al. (2006a) Vastel, C., Caselli, P., Ceccarelli, C., et al., 2006, ApJ, 645, 1198
- Vastel et al. (2006b) Vastel, C., Phillips, T. G., Caselli, P. et al., 2006, Royal Society of London Transactions Series A, vol. 364, Issue 1848, p.3081-3090
- Walmsley et al. (2004) Walmsley, C. M., Flower, D. R., & Pineau des Forêts, G., 2004, A&A, 418, 1035
- Ward-Thompson et al. (1995) Ward-Thompson, D., Eiroa, C., & Casali, M. M. 1995, MNRAS, 273, L25
- Ward-Thompson et al. (1999) Ward-Thompson, D., Motte, F., & André, P. 1999, MNRAS, 305, 143
- Ward-Thompson et al. (2007) Ward-Thompson, D., André, P., Crutcher, R., et al., 2007, Protostars and Planets V, 33
- Weingartner & Draine (2001) Weingartner, J. C., & Draine, B. T., 2001, ApJ, 548, 296
- Willacy et al. (1998) Willacy, K., Langer, W. D., & Velusamy, T., 1998, ApJ, 507, L171
- Young et al. (2004) Young, K. E., Lee, J.-E., Evans, N. J., II, Goldsmith, P. F., & Doty, S. D., 2004, ApJ, 614, 252
- Zucconi et al. (2001) Zucconi, A., Walmsley, C. M., & Galli, D., 2001, A&A, 376, 650