Large Scale Structure traced by Molecular Gas at High Redshift
Abstract
We present observations of redshifted CO(1-0) and CO(2-1) in a field containing an overdensity of Lyman break galaxies (LBGs) at . Our Australia Telescope Compact Array observations were centered between two spectroscopically-confirmed galaxies. We place upper limits on the molecular gas masses in these two galaxies of M(H2) M⊙ and M⊙ (2 ), comparable to their stellar masses. We detect an optically-faint line emitter situated between the two LBGs which we identify as warm molecular gas at . This source, detected in the CO(2-1) transition but undetected in CO(1-0), has an integrated line flux of Jy km s-1, yielding an inferred gas mass M(H2)= M⊙. Molecular line emitters without detectable counterparts at optical and infrared wavelengths may be crucial tracers of structure and mass at high redshift.
Subject headings:
galaxies: evolution — galaxies: high-redshift1. Introduction
Lyman-break galaxies have given us our first detailed look at star formation at high redshifts (). However, our picture of the distant universe is limited because these objects are selected for strong rest-frame ultraviolet emission arising from substantial unobscured starbursts in the galaxies. Individually, they tell us little about darker baryons at the same redshift, whether the systems containing the baryons are intrinsically less UV-luminous or are obscured by dust.
The Lyman-break galaxy (LBG) population has now been probed from (Steidel et al., 2004) up to (Stanway et al., 2007), with tentative detections reported at redshifts as high as (Bouwens et al., 2005). The photometric and spectroscopic properties of LBGs evolve with increasing redshift. Typical LBGs at have stellar masses of a few times 109 M⊙, are predominantly young ( Myr), and are sub-solar but not primordial in their metallicity (Z0.2 Z⊙), where these properties are deduced from their rest-frame optical and near-infrared spectral energy distribution (Verma et al., 2007).
However something is missing in our picture of the universe at . The youth of Lyman-break objects when compared to the range of lookback times probed in a given survey suggests that only a small fraction of the overall population is undergoing a phase of strong unobscured star formation, and hence is detectable in the rest UV, at a given time. Fossil stellar populations in the most massive galaxies at the present time suggest that the bulk of their stars were formed at (Heavens et al., 2004), but the mass assembly history of the universe as traced by LBGs implies that only 1% of the baryonic material that will eventually form today’s galaxies was in collapsed systems at . Where is the other 99%? The bulk of the baryonic material at these high redshifts must be in either low mass systems or the gas phase.
Damped Lyman-alpha systems in the spectra of distant quasars have shown that dense neutral gas is ubiquitous at high redshift, holding a third of the HI atoms at and appearing in 10% of sight-lines per unit cosmological distance (Prochaska et al., 2005). These sources represent reservoirs of neutral gas for star formation, yet are known to be deficient in H2 relative to local galaxies. Molecular gas is instead more tightly concentrated in high-density, relatively dusty regions (Zwaan & Prochaska, 2006).
Securely identifying this material is challenging. At , the far-infrared lines emitted by cool and obscured material are redshifted to millimeter wavelengths, but not necessarily into an atmospheric window. At these extreme luminosity distances lines are faint, requiring long integration times to secure even a tentative detection. The fields of view of existing millimeter interferometers are small, and their correlators have, until recently, been limited to bandwidths of a few hundred MHz (equivalent to ). The resulting small volumes made survey work at high redshift unfeasible. As a result, the few detections of line emission from molecular and atomic gas at high redshift have been towards active galactic nuclei - quasars to (Bertoldi et al., 2003), radio galaxies to (Klamer et al., 2005) - and hence probed highly atypical environments.
In this paper we present the results of a pilot programme to explore the cool gas associated with a large scale structure at marked out by Lyman-break galaxies rather than by an active galaxy. Our 40 arcmin2 target field contains seven UV-luminous sources with spectroscopically confirmed redshifts in a narrow range (), a 6 excess over the typical density of such sources in our survey, but shows no clear spatial clustering111The detailed properties of this field, and of others probed in our ESO Remote Galaxy Survey (ERGS) will be discussed in a forthcoming paper by Douglas et al.. Given the redshift dispersion and spatial distribution of these galaxies, it is clear that their star formation cannot be a response to a common triggering event, and yet the probability of such a configuration arising by chance is small. The simplest explanation is that there is a large mass of hidden baryons in this field at this redshift. At any one time this structure is traced by the small fraction of that material undergoing comparatively short-term UV-luminous star formation events and appearing as LBGs. While the stars within the LBGs are likely to end up in the most massive current-day galaxies after subsequent mergers, the total stellar mass in even this overdensity of LBGs is an order of magnitude too small to account for the stars in the most massive spheroids. Consequently, there should be far more baryons in the vicinity of the LBGs than revealed in the UV. Our pilot programme was designed to probe the cool gas mass in a small section of the structure, centered on a pair of LBGs with Lyman- emission redshifts separated by . The observations target not only the two LBGs, but any darker/fainter systems in the underlying large scale structure. The results for lower redshift LBGs (e.g. Baker et al., 2004), suggested that we were unlikely to detect the two known galaxies directly.
All magnitudes in this paper are quoted in the AB system (Oke & Gunn, 1983). We adopt a CDM cosmology with (, , )=(0.7, 0.3, 0.7).
2. Observations at the ATCA
The observations were carried out at the Australia Telescope Compact Array in March-April 2008. The array was in the relatively compact H168 configuration, with both North-South and East-West baselines. We used the correlator in the 128 MHz/64 channel configuration with two overlapping intermediate frequency (IF) bands, giving a total bandwidth of 240MHz, and measuring the total incident flux density, but not polarization.
We investigated two transitions of CO at high redshift. In order to constrain the CO(1-0) line, we tuned the IF bands to 18.838 GHz and 18.958 GHz (allowing detection of an emission line in the range ). In this configuration, the spectral resolution is 4 MHz or 63.5 km s-1. Observations were taken in three 8 hr observing periods on the nights of 2008 March 22-24 (although data taken on the 23rd were discarded due to poor weather). A single pointing was observed for the entire observing period, and a nearby bright source (1045-188) observed every 15 mins to determine phase stability. Pointing accuracy was checked every hour. Absolute flux calibration was through observations of 1921-293 (the standard flux calibrator at the ATCA) each night. The half-power-beam-width (HPBW) of the ATCA at this frequency is 2.5 arcmin and the naturally-weighted restoring beam in this configuration is 15.9″ 10.9″.
The CO(2-1) line was observed in four 11 hr observations on the nights of 2008 Apr 04-07 using the recently-commissioned 7mm receiver system. The IF bands were tuned to 37.672 GHz and 37.792 GHz (giving redshift coverage ). A single pointing centered on the 18.8 GHz field center was observed, and 1045-188 was used as a pointing and phase calibrator. Uranus, the primary flux calibrator for the ATCA at millimeter wavelengths, was not visible at any point in our observing period. Instead we bootstrap our primary flux calibration from two compact HII regions, observed each night, which were also observed using our configuration by ATCA staff on the afternoon of 2008 Apr 04 together with Uranus and a bandpass calibrator. At this frequency, the HPBW is 74″ and the restoring beam is 7.3″ 4.8″.
The total useful observing time was 16 hours at 18.9 GHz and 44 hours at 37.7 GHz. The RMS noise in the final images is 0.11 mJy/beam and 0.10 mJy/beam in each 4 MHz channel at 18.9 and 37.7 GHz respectively.
| Source | RA & Declination (J2000) | z | M(H2) | ||
|---|---|---|---|---|---|
| A | 10:40:46.66 -11:58:33.8 | 5.120 | 27.000.57 | - | |
| B | 10:40:41.51 -11:58:21.6 | 5.116 | 25.710.21 | - | |
| C | 10:40:43.50 -11:57:56.8 | 5.125 |
3. Limits on the CO in Lyman Break Galaxies
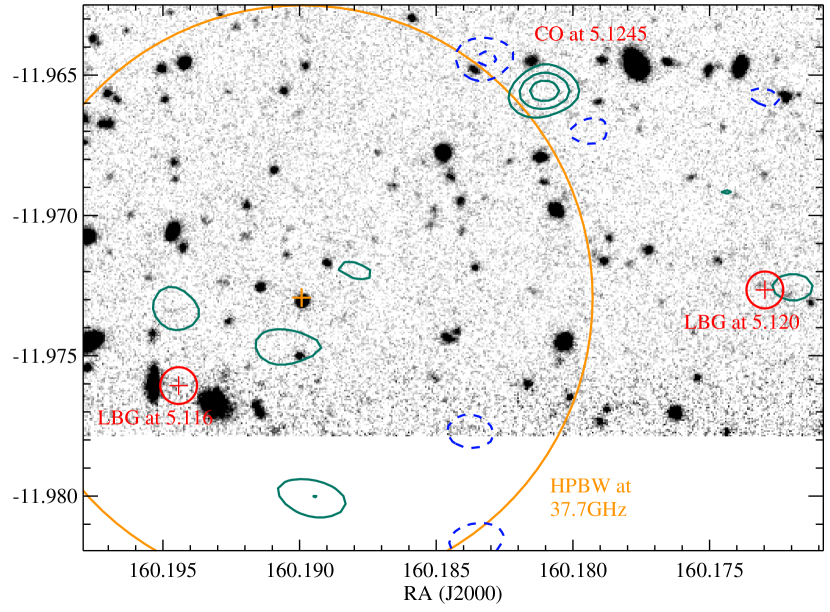
As illustrated in figure 1, our pointing included two Lyman- emitting, Lyman-break galaxies within the HPBW at 18.9 GHz (table 1). At 37.7 GHz one of these (at ) lies well outside the beam half-power point, while the second (at ) remains close to the pointing center. Neither galaxy shows evidence for line or continuum emission in either of the two transitions surveyed. This is not, in itself, surprising given the youth and low masses (typically a few M⊙, Verma et al., 2007) of Lyman-break galaxies. However, these observations provide the strongest constraint yet on the molecular gas content of star-forming galaxies.
We use our limiting flux at the frequency of the redshifted CO(1-0) line to constrain the molecular gas content of these galaxies. We employ the widely-used conversion factor of Mgas/=0.8 M⊙ (K km s-1 pc2)-1 based on local infrared-luminous galaxies (Solomon & Vanden Bout, 2005). Our image RMS noise of 0.11 mJy/beam at the CO(1-0) line corresponds to a formal 2 sigma limit K km s-1 pc2 for the luminosity of an unresolved 200 km s-1 emission line at . Thus we constrain the molecular gas mass of the known Lyman-break galaxies in this field to be M(H2) M⊙ (2).
One of our LBGs (source B in table 1) is also close to the center of the beam in our 37 GHz observations. For thermalized, optically-thick CO emission, the line luminosity is independent of transition. Making this assumption, non-detection of the 2-1 line places a tighter constraint on the mass of M(H2) M⊙ (2), comparable to the inferred stellar mass in such sources.
4. An Optically-faint Molecular Line Emitter
Inspection of the ATCA data cubes revealed no evidence for continuum sources. Only one emission feature was found to extend over more than two adjacent frequency channels. This feature, a spatially-unresolved emission line centered at 37.642 GHz with a FWHM of 110 km s-1 (equivalent to four independent frequency channels), lies on the beam half-power point. It has a peak flux of mJy/beam, and a velocity integrated flux of Jy km s-1. A combined frame of channels not containing line emission (a total bandwidth of 180 MHz) shows no significant continuum emission with a formal limit on the continuum of 0.49 mJy/beam at 37.73 GHz. The line emission is centered 1 arcminute (370 kpc, comoving) north-west and 40 arcseconds (250 kpc) north-east of our spectroscopically confirmed Lyman-break galaxies at and respectively, towards more LBGs in the field.
This line emitter is undetected at 18.9 GHz and not spatially coincident with a known source at any observed wavelength (from 0.5m to 21cm). Our optical and IR data require that the host galaxy must have a flux density Jy at an observed frame wavelength of 4.5m (0.7m rest if at ) and Jy at a 0.8m (1300Å rest). No sub-mm data exist at this location. We note that the lensing properties of this field are well understood, and we use the lensing maps of Clowe et al. (2006) to estimate a maximum 10% enhancement in the flux of a source at this location.
In order to verify the reality of the 37.6 GHz line, we investigated its properties thoroughly. The velocity-integrated line is a formal 8 detection in a multi-frequency synthesis image of 6 channels centered on the line emission. It is detected in the -dataset on multiple baselines, and in two independent sub-sets of the data. Its strength in the flux-calibrated image is independent of image deconvolution algorithm and the location of the imaging center. We conclude that this is unlikely to be a spurious detection.
We evaluate the probability that this is a line emitter at a redshift unrelated to our high redshift system (i.e. not a CO(2-1) emission line), by considering the population models of Blain et al. (2000). These authors calculated the expected number density of line emitters as a function of frequency and line flux, given models for galaxy and dark matter distributions at . As a cautious assumption, we consider the source counts predicted at 50 GHz at our integrated flux density (while noting that source counts at 37.6 GHz are likely to be lower). In our 256 MHz total bandwidth, and allowing for source detections within 1.5 HPBW, we would expect 0.003 line emitters in our survey, with these dominated by redshifted CO(1-0) lines at . Coupled with the known existence of structure at in this field, we interpret the line detection as CO(2-1) emission at at high confidence.
At the measured line flux in the CO(2-1) transition, and assuming constant luminosity, the expected counterpart in the 1-0 transition would be below the 2 level at 18.8 GHz, consistent with our non-detection. Using the same CO-to-H2 conversion factor discussed in section 3 applied to the luminosity of the CO(2-1) transition, we infer a molecular gas mass of M(H2) M⊙ in this source.
The beam width at 37.7 GHz implies an upper limit on the physical size of our unresolved source of 4530 kpc. A simple virial calculation assuming a uniform mass distribution suggests that our derived gas mass could represent up to 50% of the dynamical mass in the system, while remaining both bound and smaller than our beam size.
5. Large Scale Structure at

This pilot survey at 37.7 GHz probed only 3% of the projected spatial distribution and 35% of the redshift range occupied by clustered UV-luminous galaxies in our target field. Despite this, the gas mass inferred from our single detection is comparable to the total stellar mass in UV-luminous sources in the structure. If this detection is typical of the space density of molecular line emitters in this field, then galaxies with unobscured star formation represent at best a few percent of the baryons present (consistent with Verma et al., 2007).
In the nomenclature of Solomon & Vanden Bout (2005), our detected source is an Early Universe Molecular Emission Line Galaxy (EMG), a broad category including radio galaxies, sub-mm galaxies and QSOs at . It represents M⊙ of CO, formed within 1.1 Gyr of the Big Bang. This yield is plausible from population III stars, each of 100 M⊙, in as little as the stellar lifetime (10 Myr, Heger & Woosley, 2002). By contrast, the yield of more conventional supernovae and the typical star formation rates of UV-luminous sources in this field (30 M⊙ yr-1), years would be required (see Walter et al., 2003) implying either early and continuous star formation, or an early, intense starburst. A source with unobscured star formation of 10 M⊙ yr-1 at would have been detected in our deep optical imaging, but observations of dust emission in the rest-frame far-infrared will be necessary to distinguish between a mature stellar population at the time of observation and ongoing, but dust-obscured, star formation.
It is interesting to compare our detection with a similar observation at , also using the ATCA. Klamer et al. (2005) studied a high mass system at this redshift, marked out by the presence of at least six Lyman- emitter galaxies and a powerful radio galaxy. Based on UV-luminous stellar mass, this system should be comparable in mass to our target region. Klamer et al. (2005) detected CO emission in the 1-0 and 5-4 transitions, clearly associated with the radio galaxy. While the inferred gas mass is within a factor of four of our object, the velocity structure differs: the emission line detected by Klamer et al. (2005) was twice as broad as our line emitter, possibly due to momentum input from the radio source.
We note that the CO luminosity and derived mass of our line-emitter are similar to those of sub-millimeter galaxies (SMGs) at lower redshifts (Greve et al., 2005). These are also often a ssociated with galaxy overdensities at high redshift (e.g. Smail et al., 2003). While some SMGs with this mass would have been detected in our deep Spitzer/IRAC imaging (based on their -band magnitudes at , Smail et al., 2004, redshifted to ), others would not. CO emission is not a reliable star formation rate (SFR) indicator, but is loosely correlated with far-infrared luminosity, and hence SFR. Data on this relation at high redshift is sparse, but known EMGs with comparable gas masses to our detected source have SFRs of M⊙ yr-1. By contrast, the tight limit on H2 mass in the LBGs in our field would imply obscured star formation rates of less than a few hundred solar masses per year, even given dust properties similar to those of SMGs. Our detected source likely represents a more extreme environment than that seen in LBGs at the same redshift and could be a high redshift counterpart for the intense starbursts in SMGs.
It is becoming increasingly clear that no one survey technique can provide a complete picture of large scale structure at high redshift. Overdensities of Lyman break galaxies are correlated with the presence of Lyman-alpha emitters, radio galaxies, SMGs, DLAs (Cooke et al., 2006), and now molecular emission line galaxies at the same redshift. Each component of the structure may account for only a few percent of the baryonic mass and each presents observational challenges. While LBGs and DLAs probe comparable mass haloes at (Cooke et al., 2006), molecular line emitters may probe more massive and denser regions of the same structures.
Extensive extrapolation based on a single line from a single source is risky. Observations of this source in other emission lines will be required to confirm its redshift and luminosity. Such observations will also begin to characterize the gas temperature and density, and determine whether the CO to gas mass conversion factor for ULIRGs is appropriate for low mass systems at early times. Additional sources must be identified and characterized to determine whether our initial detection is anomalous or typical of its population. Ultimately, more extensive millimeter surveys, based on existing deep datasets, are required to establish the molecular gas content of large scale structures at high redshift, and to probe this early stage of galaxy formation.
6. Conclusions
Our main conclusions can be summarized as follows:
(i) We have investigated the molecular gas content, as traced by low-order transitions of CO, in a large scale structure identified in Lyman break galaxies at .
(ii) Neither of two known Lyman break galaxies in our survey area show associated molecular line emission, suggesting that their molecular gas content does not significantly exceed their stellar content.
(iii) We have identified a source with line emission at 37.642 GHz, which we identify as emission in the CO(2-1) transition at . This source is currently undetected at any other wavelength.
(iv) The inferred gas mass in this single source is M(H2) M⊙, comparable to the total stellar mass of UV-luminous sources in the same region.
(v) Further studies of UV-faint sources at high redshift are essential to characterize such systems, and could make substantial progress towards balancing the baryon budget at early times.
References
- Baker et al. (2004) Baker, A. J., Tacconi, L. J., Genzel, R., Lehnert, M. D., & Lutz, D. 2004, ApJ, 604, 125
- Bertoldi et al. (2003) Bertoldi F., et al., 2003, A&A, 409, L47
- Blain et al. (2000) Blain A. W., Frayer D. T., Bock J. J., Scoville N. Z., 2000, MNRAS, 313, 559
- Bouwens et al. (2005) Bouwens R. J., Illingworth G. D., Thompson R. I., Franx M., 2005, ApJ, 624, L5
- Clowe et al. (2006) Clowe D., et al., 2006, A&A, 451, 395
- Cooke et al. (2006) Cooke, J., Wolfe, A. M., Gawiser, E., & Prochaska, J. X. 2006, ApJ, 652, 994
- Greve et al. (2005) Greve, T. R., et al. 2005, MNRAS, 359, 1165
- Heavens et al. (2004) Heavens A., Panter B., Jimenez R., Dunlop J., 2004, Natur, 428, 625
- Heger & Woosley (2002) Heger A., Woosley S. E., 2002, ApJ, 567, 532
- Klamer et al. (2005) Klamer I. J., Ekers R. D., Sadler E. M., Weiss A., Hunstead R. W., De Breuck C., 2005, ApJ, 621, L1
- Lehnert & Bremer (2003) Lehnert M. D., Bremer M., 2003, ApJ, 593, 630
- Oke & Gunn (1983) Oke J. B., Gunn J. E., 1983, ApJ, 266, 713
- Prochaska et al. (2005) Prochaska, J. X., Herbert-Fort, S., & Wolfe, A. M. 2005, ApJ, 635, 123
- Smail et al. (2003) Smail, I., Ivison, R. J., Gilbank, D. G., Dunlop, J. S., Keel, W. C., Motohara, K., & Stevens, J. A. 2003, ApJ, 583, 551
- Smail et al. (2004) Smail, I., Chapman, S. C., Blain, A. W., & Ivison, R. J. 2004, ApJ, 616, 71
- Solomon & Vanden Bout (2005) Solomon P. M., Vanden Bout P. A., 2005, ARA&A, 43, 677
- Stanway et al. (2007) Stanway E. R., et al., 2007, MNRAS, 376, 727
- Steidel et al. (2004) Steidel C. C., Shapley A. E., Pettini M., Adelberger K. L., Erb D. K., Reddy N. A., Hunt M. P., 2004, ApJ, 604, 534
- Verma et al. (2007) Verma A., Lehnert M. D., Förster Schreiber N. M., Bremer M. N., Douglas L., 2007, MNRAS, 377, 1024
- Walter et al. (2003) Walter F., et al., 2003, Natur, 424, 406
- Zwaan & Prochaska (2006) Zwaan, M. A., & Prochaska, J. X. 2006, ApJ, 643, 675