119–126
New distance and depth estimates from observations of eclipsing binaries in the SMC
Abstract
A sample of 33 eclipsing binaries observed in a field of the SMC with FLAMES@VLT is presented. The radial velocity curves obtained, together with existing OGLE light curves, allowed the determination of all stellar and orbital parameters of these binary systems. The mean distance modulus of the observed part of the SMC is 19.05, based on the 26 most reliable systems. Assuming an average error of 0.1 mag on the distance modulus to an individual system, and a gaussian distribution of the distance moduli, we obtain a depth of 0.36 mag or 10.6 kpc. Some results on the kinematics of the binary stars and of the Hii gas are also given.
keywords:
eclipsing binaries, SMC distance, SMC depth, stellar evolution.1 Introduction
The last decade has seen a renewal of interest for eclipsing binary stars, thanks to the release of a huge number of light curves as a byproduct of automated microlensing surveys (EROS, MACHO, OGLE etc) with 1-m class telescopes . The reader can refer to the reviews from Clausen ([2004]) and Guinan ([2004], [2007]). The interest of eclipsing binary systems reside essentially on the potential they offer to determine with excellent accuracy the masses and the radii of the stellar components. To that end, both photometric and spectroscopic (radial velocity) data are needed. If the metallicity is known, and if the surface brightness of each component is well determined (through spectroscopic or photometric estimate of effective temperature), tests of evolutionary models of single stars can be made, provided the components are sufficiently far apart (“detached” systems). Such tests have been discussed by e.g. [jA90, Andersen (1991)].
Conversely, one can consider the internal structure models as reliable enough, and use them to determine both the metallicity and helium content , which give access to the relative enrichment . That original approach was proposed by [2000a, Ribas et al. (2000a)]; their sample included essentially Galactic binary systems, with only one belonging to the LMC. Of course, the slope would be much better constrained by adding a large number of SMC systems.
Another reason to focus on eclipsing binaries in the Magellanic Clouds is that we have a nearly complete sample of such objects to a given limiting magnitude, making them representative of a whole galaxy. Therefore, statistics of the orbital elements of detached systems can potentially yield clues about the formation mechanisms of such systems, and the study of semi-detached and contact ones may constrain scenarios of binary evolution. Here, we will briefly discuss the “twin hypothesis” ([2006, Pinsonneault & Stanek 2006]) which suggests an excess of systems with a mass ration close to 1.
Until a purely geometrical distance determination is feasible, Paczyński ([2001]) considered that detached EBs are the most promising distance indicators to the Magellanic Clouds. Four B-type EB systems belonging to the Large Magellanic Cloud (LMC) were accurately characterized in a series of papers by Guinan et al. ([1998]), Ribas et al. ([2000b], [2002]) and Fitzpatrick et al. ([2002], [2003]). More recently, from high resolution, high spectra obtained with UVES at the ESO VLT, the analysis of eight more LMC systems was presented by González et al. ([2005]). Harries et al. ([2003], hereinafter HHH03) and Hilditch et al. ([2005], hereinafter HHH05) have given the fundamental parameters of a total of 50 EB systems of spectral types O and B. The spectroscopic data were obtained with the 2dF multi-object spectrograph on the 3.9-m Anglo-Australian Telescope. This was the first use of multi-object spectroscopy in the field of extragalactic EBs. Let us also mention that the distances of an EB in M31 ([2005, Ribas et al. 2005]) and another in M33 ([2006, Bonanos et al. 2006]) were measured recently. Although the controversy about the distance to the Magellanic Clouds seems to be solved in favour of a mid position between the “short” and the “long” scales, distance data and line of sight depth remain vital for comparison with theoretical models concerning the three-dimensional structure and the kinematics of the SMC (Stanimirović et al. [2004]).
Our contribution provides both qualitative and quantitative improvement over previous studies. Thanks to the VLT GIRAFFE facility, spectra were obtained with a resolution three times that in Hilditch’s study. Another strong point is the treatment of nebular emission. The SMC is known to be rich in H ii regions (Fitzpatrick [1985], Torres & Carranza [1987]). Thus, strong emission frequently appears superposed to photospheric Balmer lines, which complicates the analysis.
2 Observations
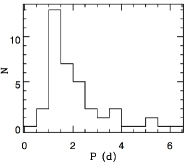
The targets, astrometry included, were selected from the first OGLE photometric catalog. The GIRAFFE field of view (FoV) constrained to choose systems inside a 25’ diameter circle. Other constraints were mag, at least 15 well-behaved detached light curves and finally seven bump cepheids in the FoV (for another program). The observations were done in November 2003 during eight consecutive nights, and the field was observed twice a night, which makes 16 observations in all. The exposure time was 43 minutes for all but one exposure which was limited to 12 minutes because of a technical problem. Fig. 1 shows the histogram of the orbital periods of the 33 systems.

For all but two binaries, the light curves come from the new version of the OGLE-II catalog of eclipsing binaries detected in the SMC (Wyrzykowski et al. [2004]). This catalog is based on the Difference Image Analysis (DIA) catalog of variable stars in the SMC. The data were collected from 1997 to 2000. Two systems were selected from the first version of the catalog (standard psf photometry) but for an unknow reason they do not appear any more in the new version.
The DIA photometry is based on -band observations (between 202 and 312 points per curve). and light curves were also used in spite of a much poorer sampling (22–28 points/curve and 28–46 points/curve in and respectively). The objects studied in this paper have an average magnitude and scatter (calculated from the best-fitting synthetic light curves) in the range to .
The spectrograph was used in the low resolution (LR2) Medusa mode: resolving power , bandwidth Å centered on Å. The most prominent absorption lines in the blue part of early-B stars spectra are: H, He i , H, He i , H, He i , and He i . For late-O stars, He ii and He ii gain in importance.
Beside the spectra of the objects, 21 sky spectra were obtained for each exposure in the SMC.
3 Data reduction and analysis
The basic reduction and calibration steps including velocity correction to the heliocentric reference frame for the spectra were performed with the GIRAFFE Base Line Data Reduction Software (BLDRS). We subtracted a continuum component of the sky, obtained from an average of the 21 sky spectra measured over the whole FoV. For a given epoch the sky level varies slightly across the field, but we neglected that second order correction. Normalization to the continuum, cosmic-rays removal and Gaussian smoothing ( = 3.3 pix) were performed with standard NOAO/PyRAF tasks. Spectral disentangling was performed with the KOREL code (Hadrava [1995], [2004]), which also gives the radial velocities and orbital elements. The simultaneous analysis of light curves and RV curves was made with the 2003 version of the Wilson-Devinney (WD) Binary Star Observables Program (Wilson & Devinney [1971]; Wilson [1979], [1990]) via the PHOEBE interface (Prša & Zwitter [2005]).
Radial velocities. Simon & Sturm ([1994]) were the first to propose a method allowing the simultaneous recovery of the individual spectra of the components and of the radial velocities. Another method aimed at the same results, but using Fourier transforms to save computing time, was proposed almost simulatneously by Hadrava ([1995]). The advantages of these methods are that they need no hypothesis about the nature of the components of the binary system, except that their individual spectra remain constant with time. Contrary to the correlation techniques, no template is needed. In addition to getting at once the radial velocities and orbital elements, one gets the individual spectra of the components (“disentangling”), with a signal-to-noise ratio which significantly exceeds that of the observed composite spectra. Other details about these techniques and their applications can be found in e.g. Hensberge et al. ([2000]), Pavlovski & Hensberge ([2005]) and Hensberge & Pavlovski ([2000]). The radial velocities were determined from the lines of He i (4471, 4388, 4144, 4026) only. We preferred to avoid the H Balmer lines (as did Fitzpatrick et al. [2002]) because of moderate to strong nebular emission polluting most systems. Four 80 Å spectral ranges centered on the four He i lines were extracted from each spectrum. For each system, KOREL was run with a grid of values . The solution with the minimum sum of squared residuals as defined by Hadrava ([2004]) was retained as the best solution. For eccentric systems, a second run was performed letting , , and free to converge ( is fixed by photometry). It is important to notice that the four spectral regions were analyzed simultaneously, i.e in a single run of KOREL. Each region was weighted according to the of each He i line (). Beside the simultaneous retrieving of RV curves, orbital parameters and disentangled spectra, the KOREL code is able to disentangle spectra for a given orbital solution (, , and fixed). A final run of KOREL with this mode was then used to disentangle the regions around the Balmer and He ii 4200 and 4542 lines. Indeed, He ii lines and a number of Si iii-iv lines are very useful to constrain the temperature of hot components.
Light curve analysis. For each system, a preliminary photometric solution was found by the application of the method of multiple subsets (MMS) (Wilson & Biermann [1976]). That allowed to provide fairly precise values of and that were introduced in the KOREL analysis. Then, all three light curves and both RV curves provided by KOREL were analyzed simultaneously using the WD code. The light curve is the most constraining one thanks to the large number of points, while the and light curves provide accurate out-of-eclipse and magnitudes. The mass ratio was fixed to the value found by KOREL. The semi-major orbital axis , treated as a free parameter, allows to scale the masses and radii. In a first run, the temperature of the primary was arbitrarily fixed to 26 000 K. Second-order parameters as albedos and gravity darkening exponents were fixed to 1.0. Metallicities were set at -0.5. The limb-darkening coefficients were automatically interpolated after each fit from the Van Hamme tables (Van Hamme [1993]).
A fine tuning run was performed with the primary temperature found after analyzing the observed spectra. The standard uncertainties on the whole set of parameters were estimated in a final iteration by letting them free to converge.
4 Results and discussion
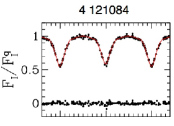
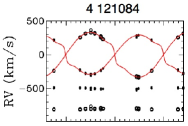
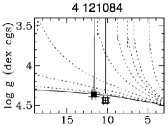
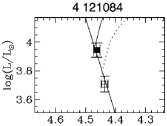
The four panels of Fig. 2 illustrate the results we obtain for a typical binary. Among our 33 systems, 23 are detached, 9 are semi-detached and 1 is a contact one. The uncertainties range from 2 to 7% for the masses, 2 to 20% for the radii and 1 to 8% for the effective temperatures. There is an excellent overall agreement between the empirical masses and those obtained from interpolation of theoretical evolutionary tracks with in the HR diagram. The few discrepant points can be ascribed to incomplete lightcurves or to unrecognized third light.
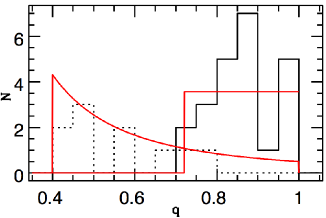
From the 21 detached systems of the HHH03/05 sample, Pinsonneault & Stanek ([2006]) suggest that the fraction of massive detached systems with a mass ratio close to unity is far larger than what would be expected from a classic Salpeter-like () or a flat () distribution. While the median mass ratio is high, 0.87, there are two systems with only, which suggest that the high median value does not result from an observational bias. On the other hand, the distribution of our sample of detached systems does not extend below 0.7 (see Fig. 3), which on the contrary suggests that lower values would correspond to secondary companions too faint to be seen. Our observed distribution is quite compatible with a flat parent distribution. For semi-detached and contact systems, it is compatible with a flat distribution extending from 0.4 to 0.7, or with a decreasing one, e.g. a Salpeter-like one, though without a theoretical justification. Therefore, the twin hypothesis is clearly not substantiated by our results, but that does not imply that the latter are compelling enough to refute it. Lucy ([2006]) distinguishes between the “weak” twin hypothesis (excess of binaries with ) and the “strong” hypothesis (excess of binaries with ). He shows that the strong hypothesis is verified on the basis of a sample of 109 Galactic binary systems, and that errors larger than on can smear out the signal. Therefore, the HHH03/05 sample, being much smaller and including low precision values, is far from sufficient to confirm or deny the twin hypothesis. Likewise, even though our sample includes undoubtedly better values, it remains far from sufficient either.
The distance moduli are reliable for 26 systems in the band, and for 25 systems in the band. The average distance modulus is a few hundredths of a magnitude smaller for the than for the band. We adopt
This value is slightly higher than that adopted by HHH05 (). The latter authors have systems scattered over the whole SMC, which should be more representative of the mean distance. On the other hand, our field is only away from the optical centre (to the SW), so it would be difficult to reconcile the two values by a mere geometrical effect linked with the orientation of the SMC.
Assuming an average error of on individual distance moduli and a gaussian intrinsic dispersion of the true moduli, a quadratic difference yields a depth of or 10.6 kpc.
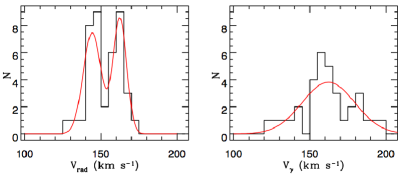
Finally, it is interesting to compare the radial velocity distribution of the nebular emission lines with the systemic velocities of the binary systems. Fig. 4 shows that the gas has two narrow velocity components, while the distribution of the systemic velocities is wider and can be fit by a single gaussian.
References
- [1991] Andersen, J. 1991, A&AR, 3, 91
- [1980] Andersen, J., Clausen, J.V., Nordtsröm, B., 1980, in Close binary stars: observations and interpretation, eds. M.J. Plavec, D.M. Popper, R.K. Ulrich, IAU Symp. 88, Reidel, Dordrecht, p. 81
- [2006] Bonanos, A. Z., Stanek, K. Z., Kudritzki, R. P. et al. 2006, ApJ, 652, 313
- [2004] Clausen, J. V. 2004, New Astron., 48, 679
- [2007] De Mink, S. E., Pols, O. R., Hilditch, R. W. 2007, A&A, 467, 1181
- [1985] Fitzpatrick, E. L. 1985, ApJS, 59, 77
- [2002] Fitzpatrick, E. L., Ribas, I., Guinan, E. F., et al. 2002, ApJ, 564, 260
- [2003] Fitzpatrick, E. L., Ribas, I., Guinan, E. F., Maloney, F. P., & Claret, A. 2003, ApJ, 587, 685
- [2005] González, J. F., Ostrov, P., Morrell, N., & Minniti, D. 2005, ApJ, 624, 946
- [1998] Guinan, E. F., Fitzpatrick, E. L., DeWarf, L. E., et al. 1998, ApJ, 509, L21
- [2004] Guinan, E. F. 2004, New Astron., 48, 647
- [2007] Guinan, E. F. 2007, in ASP Conf. Ser., 370, 125
- [1995] Hadrava, P. 1995, A&AS, 114, 393
- [2004] Hadrava, P. 2004, Publ. Astron. Inst. ASCR, 92, 15
- [2003] Harries, T. J., Hilditch, R. W., & Howarth, I. D. 2003, MNRAS, 339, 157
- [2000] Hensberge, H. H. & Pavlovski, K. 2007, in: Binary stars as critical tools & tests in contemporary astrophysics, IAU Symp. No 240, eds. W. I. Hartkopf, E. F. Guinan, P. Harmanec, Cambridge University Press, p. 136
- [2000] Hensberge, H., Pavlovski, K., & Verschueren, W. 2000, A&A, 358, 553
- [2005] Hilditch, R. W., Howarth, I. D.,& Harries, T. J. 2005, MNRAS, 357, 304 (HHH05)
- [2006] Lucy, L. B. 2006, A&A, 457, 629
- [2001] Paczyński, B. 2001, AcA, 51, 81
- [2005] Pavlovski, K., & Hensberge, H. H. 2005, A&A, 439, 309
- [2006] Pinsonneault, M. H., & Stanek, K. Z. 2006, ApJ, 639, L67
- [2006] Prša, A., 2006, PHOEBE Scientific Reference, Univ. of Ljubljana, available in electronic form at http://phoebe.fiz.uni-lj.si/
- [2005] Prša, A., & Zwitter T. 2005, ApJ, 628, 426
- [2000b] Ribas, I., Guinan, E. F., Fitzpatrick, E. L., et al. 2000b, ApJ, 528, 692
- [2000a] Ribas, I., Jordi, C., Torra, J., Giménez, A. 2000a, MNRAS, 313, 99
- [2002] Ribas, I., Fitzpatrick, E. L., Maloney, F. P., Guinan, E. F., & Udalski, A. 2002, ApJ, 574, 771
- [2005] Ribas, I., Jordi, C., Vilardell, F., Fitzpatrick, E. L., Hilditch, R. W. & Guinan, E. F. 2005, ApJ, 635, 37
- [2004] Stanimirović, S., Staveley-Smith, L., & Jones, P. A. 2004, ApJ, 604, 176
- [1994] Simon, K. P. & Sturm, E. 1994, A&A, 281, 286
- [1987] Torres, G., & Carranza, G. J. 1987, MNRAS, 226, 513
- [1993] Van Hamme, W., 1993, AJ, 106, 2096
- [2005] Van Rensbergen, W., De Loore, C., & Vanbeveren, D. 2005, in AIP Conf. Proceedings, 797, 301
- [2006] Van Rensbergen, W., De Loore, C., & Jansen, K. 2006, A&A, 446, 1071
- [1971] Wilson, R. E., & Devinney, E. J. 1971, ApJ, 166, 605
- [1979] Wilson R. E. 1979, ApJ, 234, 1054
- [1990] Wilson R. E. 1990, ApJ, 356, 613
- [1976] Wilson, R. E., & Biermannn, P. 1976, A&A, 48, 349
- [2004] Wyrzykowski, L., Udalski, A., Kubiak, M., et al. 2004, AcA, 54, 1