Phase diagram of asymmetric Fermi gas across Feshbach resonance
Abstract
We study the phase diagram of the dilute two-component Fermi gas at zero temperature as a function of the polarization and coupling strength. We map out the detailed phase separations between superfluid and normal states near the Feshbach resonance. We show that there are three different coexistence of superfluid and normal phases corresponding to phase separated states between: (I) the partially polarized superfluid and the fully polarized normal phases, (II) the unpolarized superfluid and the fully polarized normal phases and (III) the unpolarized superfluid and the partially polarized normal phases from strong-coupling BEC side to weak-coupling BCS side. For pairing between two species, we found this phase separation regime gets wider and moves toward the BEC side for the majority species are heavier but shifts to BCS side and becomes narrow if they are lighter.
1 Introduction:
Recently experiments in the ultracold Fermi gases[1] have raised strong interest in studying the crossover problem from Bose-Einstein condensation (BEC) to the condensation of weak-coupling Cooper pairs. The experiments [2, 3] on 6Li atoms with imbalance spin populations further provide an opportunity to study the superfluid properties with mismatched Fermi surface. The phase diagram of this polarized Fermi system has been studied near the Feshbach resonance for both of the pairing with equal masses [4, 5] and different species [6, 7, 8, 9, 10]. The homogeneous superfluid is stable only at the large positive coupling strengths. There are two possible scenarios to replace the unstable phases, namely phase separation [11] and FFLO states [12]. Determining phase separation is relatively straight-forward. On the other hand, calculations for the FFLO states are highly non-trivial due to the complex spatial dependences of the order parameter [13]. However, the instability of the normal state towards the FFLO state is relatively easy to determine if one assumes a second order transition, for then one only needs to examine the Cooperon at finite q. In this paper, we shall then construct the phase diagram for phase separation using a Maxwell construction [14], but then terminating the procedure whenever the corresponding normal state has a finite-q Cooperon instability. The latter regions are presumably in the FFLO state.
For the same species, we found that there are three different coexistence of superfluid and normal phases corresponding to the phase separation between (I) the partially polarized superfluid () and the fully polarized normal () phases, (II) the unpolarized superfluid () and the fully polarized normal phases, and (III) the fully polarized superfluid and the partially polarized normal () states.
For the pairing between different species, this phase separation region becomes wider compared to the pairing of equal masses for the case of the majority species are heavier but narrower if the majority species are lighter. For the case with (between 40K and 6Li), the instability of the finite-q Cooperon occurs earlier than the instability of the phase separation for almost all couplings so that there are effectively only two kinds of phase separation ( and ). For the other case with , the phase separation region shifts to BCS side and all of three kinds of phase separated states still exist.
2 Formalism:
We start from the two-component fermion system across a wide Feshbach resonance which may be described by an effective one-channel Hamiltonian as follows:
| (1) |
where , is the bare coupling strength, and the index runs over the two species ( and ), where . () to represent the mass of the heavier (lighter) component. Within the BCS mean field approximation, the excitation spectrum in a homogeneous system for each species is
| (2) |
with the reduced mass , the chemical potential difference and the average chemical potential .
It is convenient to re-scale the energy in unit of the chemical potential difference , then the equation for pairing field reads
| (3) |
where , , and . The total density () and the polarization () of the system are
| (4) | |||||
| (5) |
with . For a given , the scaled scattering length can be evaluated as a function of the pairing field through equation (3). When there are multiple solutions at the same and , the physical solution is then determined by the condition of minimum free energy which can be found via the same procedure as the usual Maxwell construction [14].
3 Results and Discussions
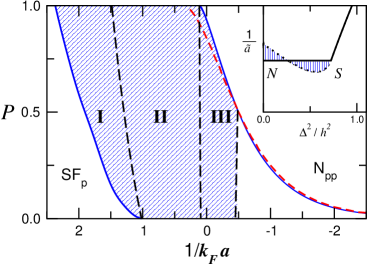
In Fig. 1, we plot the phase diagram of the polarization as a function of the coupling strength [] for the pairing with equal masses. The Fermi momentum () is the usual definition for the unpolarized non-interacting Fermi gas. In a polarized system, the homogeneous state is stable only at large positive and negative coupling strengths corresponding to the partially polarized superfluid (BEC side) and the partially polarized normal state (BCS side). The shaded area near the resonance () represents the phase separation between superfluid fluid and normal gas [4, 5]. Furthermore, this shaded area is divided into three regions: the phase separation between (I) , (II) , and (III) . (This division is slightly different from the Monte Carlo results [15]). The phase boundaries among these three regions are determined by the Maxwell construction at fixed and . A typical example is shown in the inset in figure 1. The two end points (labelled as and ) of the horizontal line are corresponding to the normal () and superfluid () states. Then the phase boundaries (long dashed lines shown in figure 1) are evaluated by
| (6) | |||||
| (7) |
where , , and . As increasing , we will reach the BCS regime, the instabilities of the phase separation and finite Cooperon intersect near and . The FFLO phase probably exists on the right of this point [13].
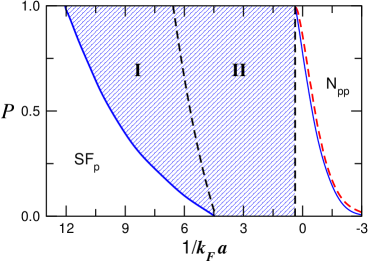
For the pairing between different species, the story is quite different. For the case of the majority species are heavier, the phase separation region moves toward the BEC side and becomes much wider than the case of equal masses pairing. In figure 3, we plot the phase diagram for . The instability of the finite- Cooperon occurs earlier compared to the instability of the phase separation for almost entire polarization such that the phase separation between effectively does not exist in this case.
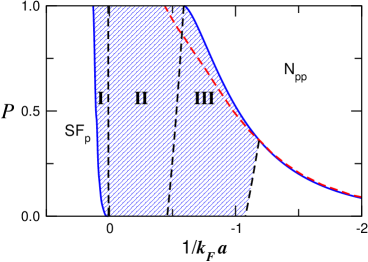
When the majority species are lighter, the phase separation region gets narrow and shifts toward the BCS side. In figure 3, we plot the phase diagram for . As increasing the coupling strengths from BCS limit, the system prefers entering FFLO state first for but the phase separated states between the for . All of the three phase separated states exist in this case.
4 Conclusion
We have studied the phase diagram for the pairing between two species in a dilute Fermi gas at zero temperature. Near the Feshbach resonance, we map out the detailed phase separations between superfluid and normal state. There are three different phase separated states for the paring of equal masses. For the majority species are lighter, the phase separation region becomes narrow and shifts to BCS side compared to the case of equal masses. On the other hand, this region gets wider and only the phase separated states of and exist for .
This research was supported by the National Science Council of Taiwan under grant numbers NSC96-2112-M-194-007-MY3 (CHP) and NSC96-2112-M-001-054-MY3 (SKY), with additional support from National Center for Theoretical Sciences, Hsinchu, Taiwan.
5 References
References
- [1] Regal C A, Greiner M, and Jin D S 2004 \PRL92 040403 \nonumKinast J, Hemmer S L, Gehm M E, Turlapov A, and Thomas J E 2004 \PRL92 150402 \nonumC. Chin, Bartenstein M, Altmeyer A, Riedl S, Jochim S, Hecker Denschlag J, and Grimm R 2004 Science 305 1128 \nonumBourdel T, Khaykovich L, Cubizolles J, Zhang J, Chevy F, Teichmann M, Tarruell L, Kokkelmans S J J M F, and Saloman C 2004 \PRL93 050401 \nonumZwierlein M W, Abo-Shaeer J R, Schirotzek A, Schunck C H, and Ketterle W 2005 Nature 435 1047
- [2] Zwierlein M W, Schirotzek A, Schunck C H and Ketterle W 2006 Science 311 492
- [3] Partridge G B, Li W, Kamar R I, Liao Y and Hulet R G 2006 Science 311 503
- [4] Pao C-H, Wu S-T and Yip S-K 2006 \PRB 73 132506; 74 189901(E)
- [5] Sheehy D E and Radzihovsky L 2006 \PRL96 060401 \nonumSon D T and Stephanov M A 2006, \PRA 74, 013614 \nonumSheehy D E and Radzihovsky L 2007 \APNY322, 1790
- [6] Iskin M and Sa de Melo C A R 2006 \PRL97 100404
- [7] Lin G-D, Yi W, and Duan L-M 2006 \PRA 74, 031604(R)
- [8] Wu S-T, Pao C H, and Yip S-K 2006 \PRB 74 224504
- [9] Pao C-H, Wu S-T and Yip S-K 2007 \PRA 76 053621
- [10] Parish M M, Marchetti F M, Lamacraft A, and Simon B D 2007 \PRL98, 160402; this paper incorrectly stated that our [8] found only the local free energy minima and therefore did not locate the actual first order phase transition lines.
- [11] Sarma G 1963 \JCP24 1029
- [12] Fulde P and Ferrell R A 1964 \PR135 A550 \nonumLarkin A I and Ovchinnikov Y N 1964 Zh. Éksp. Teor. Fiz. 47 1136 [1965 Sov. Phys.–JETP 20 762]
- [13] Yoshida N and Yip S-K 2007 \PRA 75 063601
- [14] Pao C-H and Yip S-K 2006 \JPCM18 5567
- [15] Pilati S and Giorgini S 2008 \PRL100 030401