Half-filled Hubbard Model on a Bethe lattice with next-nearest neighbor hopping
Abstract
We study the interplay between Néel-antiferromagnetism and the paramagnetic metal-insulator-transition (PMIT) on a Bethe lattice with nearest and next-nearest neighbor hopping and . We concentrate in this paper on the situation at half-filling. For the PMIT outgrows the antiferromagnetic phase and shows a scenario similar to V2O3. In this parameter regime we also observe a novel magnetic phase.
I Introduction
Understanding correlation effects is one major goal of condensed matter physics. Strong correlations manifest themselves in various forms. The paramagnetic Mott-Hubbard metal-insulator-transition (PMIT)Imada et al. (1998) is a well-known and interesting example. With increasing interaction strength the Fermi liquid state breaks down at a critical value and an insulator is formed.
Another fundamental example is magnetism, where electrons reduce the energetic cost of the Coulomb-interaction by ordering. Both effects can of course occur simultaneously and are the heart of the extremely rich phase diagram of e.g. transition metal compounds like for example V2O3 or LaTiO3McWhan et al. (1973); Katsufuji et al. (1997).
Besides strong correlations, another major ingredient for the understanding of the phase diagram of compounds like V2O3 is frustration. V2O3 crystallizes in the corundum structure with the V-ions located on a honeycomb lattice in the ab-plane, while along the c-axis a more complicated coordination is observed, which induces frustration of the magnetic interactions Imada et al. (1998). Nevertheless does the phase diagram of V2O3 show an antiferromagnetic phase at temperatures below . Upon doping with Ti one may suppress this order. Such a doping with a smaller ion can be viewed as internal pressure,Imada et al. (1998) hence the suppression of the magnetic order is commonly interpreted as happening through an increase of the bandwidth respectively a decrease of the correlation effects. Consequently, the critical Ti doping is conventionally related to the existence of a lower critical value of the electronic interaction parameter. At higher temperatures the antiferromagnetic state becomes unstable towards a paramagnet and one can eventually observe a paramagnetic metal-insulator-transition up to temperatures .
Frustration is a quite common feature in real materials. Very interesting examples for frustrated systems are layered organic compounds like -(BEDT-TTF)2XLefebvre et al. (2000); Tsai and Marston (2001); Morita et al. (2002); Kurosaki et al. (2005); Sasaki et al. (2005); Aryanpour et al. (2006); Yokoyama et al. (2006); Kyung and Tremblay (2006); Watanabe et al. (2006); Koretsune et al. (2007); Watanabe et al. (2008); Ohashi et al. (2008); Sasaki et al. (2008); Nevidomskyy et al. (2008). They have a similar phase diagram as the high-temperature superconductors (HTSC)McKenzie (1997). The phases of these organic systems are controlled by pressure and frustration rather than by doping as in HTSCLee et al. (2006). They are usually described by an anisotropic triangular lattice, and changing the anion (X) in these systems modifies the frustration of the lattice. Besides superconductivity also magnetic ordering and a PMIT can be found.
These two examples by no means exhaust the zoo of materials showing such interplay or competition between PMIT and ordered phasesImada et al. (1998). For example, rare-earth compounds like Ce(Rh,Ir)1-x(Co,Ir)xIn5 do show a similarly bizarre phase diagramHegger et al. (2000). Besides their usually complicated lattice structure another challenge for a theoretical description of such compounds is that the presence of elements with partially filled d- or f-shells in principle requires a multi-orbital description to account for effects like Hund’s or spin-orbit coupling properly. Furthermore the residual degeneracies in the solid state crystalline environment lead to degenerate multiplets which in turn can give rise to even more complex structures like orbital order or polaron formation (see e.g. Imada et al. (1998) for an overview and references).
Although all these ingredients play an important role for a quantitative theoretical description of transition-metal or rare-earth compounds, we here want to focus on the one-orbital situation, in particular on the relation between PMIT and antiferromagnetism. This restriction to a simpler but by no means trivial situation will enable us to investigate the relation between these two paradigms of correlation effects with a small and controllable set of parameters and thus obtain some hint to how both phases interact. A model suitable for analyzing this kind of physics is provided through the Hubbard modelHubbard (1963); Kanamori (1963); Gutzwiller (1963)
| (1) |
where creates (annihilates) an electron with spin at site and is the density operator for spin up(down) at site i. The parameters represent the hopping amplitude from to and is the interaction strength. In this paper we will measure the interaction relative to the bandwidth, which is related to the hopping amplitude. Although at first sight very simplistic, this model is highly nontrivial. Besides other methods, especially in one dimension, progress in understanding its physics was achieved by the development of the dynamical mean field theory (DMFT)Georges et al. (1996). The DMFT is a very powerful tool for analyzing strongly correlated lattice systems, mapping the lattice problem onto a quantum impurity problem, which has to be solved self consistently. For solving this impurity problem for arbitrary interaction strengths and temperatures we here use Wilson’s numerical renormalization groupWilson (1975); Bulla et al. (2008). An interesting fact is that the only information about the lattice structure, which enters a DMFT self consistency calculation, is the local density of states (DOS) of the non-interacting system. We performed our calculations for a Bethe lattice with nearest-neighbor (nn) and next-nearest-neighbor (nnn) hopping and , respectively.
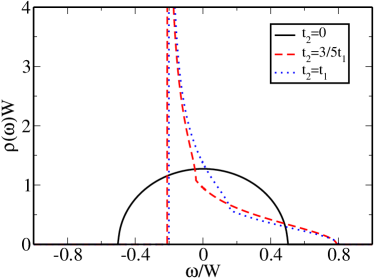
The DOS in this case can be calculated using a topological ansatzKollar et al. (2005); Eckstein et al. (2005). Starting from a particle-hole symmetric DOS at the density of states becomes now asymmetric with increasing (see Fig. 1) and develops a van-Hove singularity at the lower band edge for positive and increasing nnn-hopping . In contrast to , where the particle-hole symmetry can be employed to fix the filling at precisely, the asymmetry present for makes it more difficult to perform calculations with the filling kept at with sufficient accuracy. Thus DMFT calculations typically take much longer here due to the necessary adjustment of the chemical potential. Of course the Bethe lattice does not represent a lattice realized in real materials. However, in contrast to the hypercubic lattice with infinite coordination number the Bethe lattice has a compact support and thus possesses band edges, which provides a more realistic scenario.
Since the early days of DMFT, there have been many contributions by different groups to the subject of the PMIT and antiferromagnetism.Pruschke (2005); Georges et al. (1996) However, frustration effects up to now where introduced in DMFT typically within the so-called two-sublattice fully frustrated modelRozenberg et al. (1995); Georges et al. (1996); Duffy and Moreo (1997); Hofstetter and Vollhardt (1998); Chitra and Kotliar (1999); Zitzler et al. (2004), which results in a particle-hole symmetric DOS even with frustration. As side effect, this way of introducing frustration leaves the paramagnetic phase unchanged. For the non-frustrated system the PMIT is then completely covered by the antiferromagnetic phase, which exists for half-filling for all finite values of Pruschke (2005); van Dongen (1991). For the frustrated system, on the other hand, there exists a lower critical value for the interaction , which increases with increasing frustration. It was furthermore found that the Néel-temperature decreases with increasing frustration such that the PMIT outgrows the antiferromagnetic phaseZitzler et al. (2004). In early calculations using this way of introducing frustration based on exact diagonalization studies of the two-sublattice fully frustrated modelGeorges et al. (1996); Chitra and Kotliar (1999); Hofstetter and Vollhardt (1998), the authors also found parameter regions in the phase diagram where an antiferromagnetic metal appeared to be stable. However, this antiferromagnetic metal phase was later traced back to numerical subtleties in the exact diagonalization procedure and shown to be actually absent from the phase diagramZitzler et al. (2004).
The first attempt to study the Hubbard model on the Bethe lattice with correct inclusion of nn- and nnn-hopping has been performed rather recentlyEckstein et al. (2007). In this work the authors concentrated on the paramagnetic PMIT and found phase-separation between the insulating and metallic phase.
In this paper we investigate the PMIT as well as antiferromagnetism and concentrate on the competition between the paramagnetic phase including the PMIT and the antiferromagnetic phase at intermediate and high grades of frustration. We especially look at the case and raise the question, if the scenario of the outgrowing PMIT, proposed in Zitzler et al. (2004), still holds for the correct asymmetric density of states. The paper is arranged as following. After this introduction we start with a brief look at the PMIT, followed by a discussion of the phase diagram at half-filling including antiferromagnetism and the PMIT. The next paragraph addresses especially the case of very strong frustration and the question how the magnetic order is realized there. The paper will be closed by a summary of our results and an outlook.
II Metal-insulator-transition
The metal insulator transition for the Bethe lattice with nnn-hopping has been analyzed by Eckstein et al. (2007) within the self-energy functional approachPotthoff (2003). They particularly focused on and discussed an unexpected occurrence of phase separation in the paramagnetic state between a Mott-Hubbard insulator and a correlated metal at and near half-filling. Here we want to investigate the behavior of the system as function of increasing frustration. Due to symmetry there is no difference between and . The calculations were done using Wilson’s NRG as impurity solver for the DMFT, with , states kept per NRG step and a logarithmic broadening to obtain spectral functions. We want to note at this point that the choice of NRG numerical parameters does not influence the qualitative nature of the results. We observe, however, small dependencies on and , which tend to become more pronounced close to phase transitions and may result in systematic errors in numerical values for critical parameters of the order of .Bulla et al. (2008)
Figure 2 shows the paramagnetic metal insulator transition for various values . As energy-scale we choose the bandwidth
of the non-interacting system. Note that these results are obtained by artificially suppressing an antiferromagnetic instability. We will come back to this point later. The occupation was kept fixed at by adjusting the chemical potential. Note that in contrast to the case with it is not possible to achieve here within numerical precision due to the asymmetric DOS (see Fig. 1).
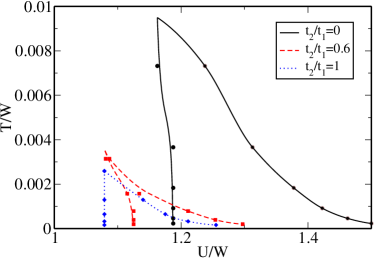
For increasing the PMIT is shifted towards lower interaction strengths and also lower temperatures. While the shift in the interaction strength is rather moderate, we notice a large difference in the temperature of the critical endpoint between the unfrustrated and highly frustrated system. This observation of course renews our interest in the question, to what extent long-range hopping can help to push the paramagnetic MIT out of the expected antiferromagnetic phase for reasonable magnitudes of to create a phase diagram similar to the one found for V2O3. The scenario proposed by Zitzler et al. (2004) relied on the fact that the paramagnetic phase largely remains unaltered with increasing . As the Néel-temperature for the antiferromagnet is reduced at the same time, the PMIT can eventually outgrow the antiferromagnetic phase.
III Antiferromagnetism at finite
We now allow for antiferromagnetic ordering in our calculations. To this end we reformulate the DMFT for an AB lattice structureGeorges et al. (1996); Pruschke (2005) to accommodate the Néel ordering and initialize the calculation with a small staggered field, which is turned off after one DMFT iteration. The system then either evolves into a paramagnetic or antiferromagnetic state with increasing number of DMFT iterations. Figure 3 shows the resulting phase diagrams for (upper panel) and (lower panel) for different temperatures and interaction strengths.
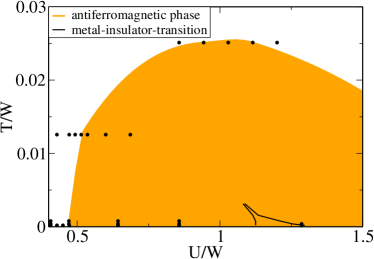
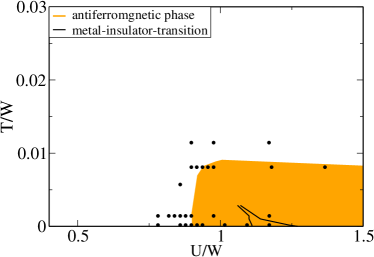
The small black points show the locations, where calculations have actually been performed. From these data the shaded areas were constructed representing the antiferromagnetic phases. This of course means that the phase boundaries shown here must be considered as guess only. However, as we do not expect any strange structures to appear, this guess will presumably represent the true phase boundary within a few percent.
The full lines in Fig. 3 are the PMIT transitions. Note that for both diagrams the same division of axes was chosen.
In contrast to the Hubbard model on a bipartite lattice with , there now exists a finite critical value , below which no antiferromagnetism can be stabilized even for temperature . With increasing frustration the paramagnetic-antiferromagnetic transition is shifted towards higher interaction strengths and lower temperatures, while the PMIT is shifted towards lower interactions strengths. So obviously the PMIT is shifted towards the phase boundaries of the antiferromagnetic dome. So far this is the expected effect of the nnn-hopping which introduces frustration to the antiferromagnetic exchange. However, note that although represents already a very strongly frustrated system, the PMIT still lies well covered within the antiferromagnetic phase.
Let us now have a closer look at the paramagnetic-antiferromagnetic transition. Here, Zitzler et al. (2004) made the prediction that one has to expect a first order transition close to the critical at low temperatures; while at larger values of again a second order transition was found.
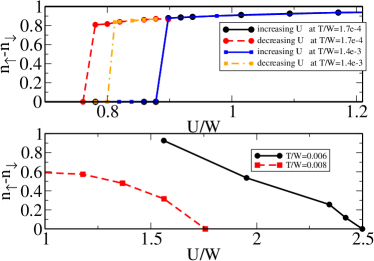
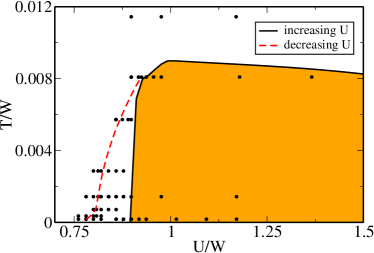
Figure 4 shows the staggered magnetization for different temperatures and interaction strengths at fixed . The upper panel collects data for the transition at low temperatures at the lower edge of the antiferromagnetic phase. The full lines represent the transition from the paramagnetic to the antiferromagnetic state with increasing interaction strength for two different temperatures, while the dashed lines represent the transitions from the antiferromagnetic to the paramagnetic state with decreasing interaction strength. In the upper panel (small ) one can clearly see a hysteresis of the antiferromagnetic transition. This hysteresis as well as the jump in the magnetization are clear signs for a first order transition. This antiferromagnetic hysteresis is very pronounced for strong frustration but numerically not resolvable for example for . We believe that the hysteresis region shrinks with decreasing and eventually cannot be resolved anymore with numerical techniques. The whole temperature depending hysteresis region can be seen in Fig. 5 for the case . One can see clearly the shrinking of the hysteresis region with increasing temperature. Note that such a hysteresis is also found in the two-sublattice fully frustrated model,Zitzler et al. (2004) which means that this quite likely is a generic effect in frustrated systems at intermediate coupling strengths.
The lower panel in Fig. 4 shows the staggered magnetization for temperatures just below the corresponding Néel-temperatures and at large interaction strengths. Here the magnetization vanishes smoothly, which is the behavior expected for a second order phase transition. In summary we thus find a first order transition at the critical interaction where antiferromagnetism sets in, and a second order transition for the large Coulomb parameter .
The merging from both transition lines is an interesting point in itself. There must be a critical point where the first order transition changes into a second order transition. It is however not possible to resolve this merging within DMFT/NRG. First, the logarithmic discretization of the temperatures within the NRG does not allow to resolve this merging-region with arbitrary precision. Second, the magnetization of the system becomes very small in this region, so it is not possible to distinguish between a (tiny) jump and numerical artifacts of a smoothly vanishing order parameter. Consequently, we cannot decide anymore of what order the transition will be.
Antiferromagnetic metallic phases at half-filling were reported in earlier publicationsRozenberg et al. (1995); Duffy and Moreo (1997); Hofstetter and Vollhardt (1998); Chitra and Kotliar (1999). In our calculations we saw no evidence for an antiferromagnetic metallic state at half-filling. Especially for strong frustration the system directly jumps from a paramagnetic metallic solution into an antiferromagnetic insulating solution with high magnetization. In the papers cited, the region showing an antiferromagnetic metallic solution broadens with increasing . This prediction we clearly cannot confirm, as discussed above. Only in systems with small to intermediate frustration there are narrow interaction regimes where we observe a small finite weight at the Fermi level. One must however consider that the occupation number is not exactly one but only within . Also it was sometimes difficult to stabilize a DMFT solution in these regions. In summary, we cannot see any clear signs for an antiferromagnetic metallic state at half-filling in our calculations. If any exists, then only for rather low frustration in a very small regime about the critical interaction. To what extent these rather special conditions can then be considered as realistic for real materials is yet another question.
IV Nearly fully frustrated system
In this last paragraph we want to study the situation, in which and are comparable in strength. Interestingly, there has been no attempt to calculate the phase diagram on a mean-field level in the strongly frustrated model . Therefore, before discussing the results of the DMFT calculations for strongly frustrated systems let us try to gain some insight into the physics we must expect, by inspecting classical spins on a Bethe lattice with nn-interaction and nnn-interaction . Allowing that nearest-neighbor spins enclose an angle one ends up with the energy functional
| (2) | |||||
Performing the same limits and scaling as in DMFT one finds (see Appendix A)
| (3) |
Thus, the Néel-state with is the stable ground state for , while one finds a spin wave with for .
For the DMFT calculations we can allow only for solutions commensurate with the lattice. This however will possibly be inconsistent with the spin structure favored by the system. If, for example, we perform a calculation focusing on the ferromagnetic solution within a parameter regime, where the system wants to order antiferromagnetically, DMFT will not converge. To investigate spin wave states with periodicities with more than two lattice sites, one has to set up the correct DMFT self-consistency equations respecting the lattice structure. While for a system on an infinite Bethe lattice with nn hopping only it is straightforward to extend the DMFT to commensurate magnetic structures with periodicities of more than two lattice sites, we did not succeed in devising a scheme that allows for such calculations for systems with nnn hopping. The reason is that one has to partition the lattice into an structure. However, the nnn hopping makes it impossible to uniquely identify the connectivity of the respective sublattices. A method proposed by Fleck et al. (1999) for the two-dimensional cubic lattice is not applicable in our case.
We thus only allowed for paramagnetic, ferromagnetic and antiferromagnetic solutions in our calculations. The resulting phase diagrams for are shown in Figs. 6 and 7. Figure 6 displays the ground states for different grades of frustration and interaction strengths. For the phase diagram has the same structure as for small and intermediate . The critical interaction strength necessary to stabilize the Néel-state increases and for all values above we find an antiferromagnetic phase with a hysteresis region at the phase boundary.

For the critical value one needs to stabilize the Néel-state increases dramatically. For finally we do not find an antiferromagnetic Néel-state at all for any interaction strength . Our DMFT calculations however indicate that in this range of there actually does exists another magnetic phase. Namely, for sufficiently small temperatures one obtains a finite spin polarization in every DMFT iteration. However, the DMFT does not converge to a unique state as function of DMFT iterations (see also Fig. 8).

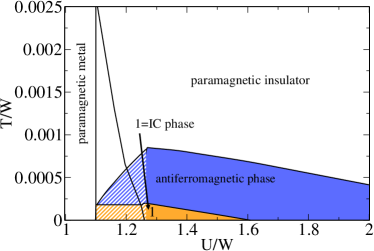
In the phase diagrams in Figs. 6 and 7 we have named this regime the incommensurate phase (IC phase). In this parameter regime the Néel-state becomes unstable towards the behaviour shown in Fig. 8. Here one can switch between a conventional Néel-state and the IC phase by only a small change of the interaction strength. Note, that the phase boundaries shown in the figure must be taken with some care as we cannot compare the energies of the Néel-state and this IC phase to properly determine the phase boundaries. As we observe precisely the same behavior for all investigated values we are convinced that the ground state in this region is an incommensurate state, as to be expected from our results for . Similar observations also hold for finite temperatures as shown in Fig. 7, where the phase diagram for fixed is displayed. For increasing interactions and there first is a transition from a paramagnetic metal to the IC phase and for from the IC phase to the Néel-state. For increasing temperature the IC phase eventually becomes unstable towards the Néel-state. In Fig. 7 one can also see the PMIT lines. As one can see it lies within the hysteresis region of the magnetic phases but clearly outgrows both magnetic phases. This is the scenario described in Zitzler et al. (2004).
V summary
We studied the DMFT phase diagram of the Hubbard model at half-filling in the presence of nn- and nnn-hopping. In contrast to previous investigations we did our calculations for a Bethe lattice with proper nnn hopping , introducing a highly asymmetric DOS already for the non-interacting system.
The first important observation concerns the paramagnetic metal-insulator transition, which is suppressed by increasing , but at the same time shifted to lower values of the Coulomb interaction.
The at ubiquitous antiferromagnetic phase on the other hand is suppressed up to a critical value with increasing , as expected. Furthermore, a hysteresis region between the paramagnetic metal at small U and the antiferromagnetic insulator at large U develops, showing that the transition is of first order. Note that we did not observe any evidence for an antiferromagnetic metal close to the phase boundary, nor did the PMIT reach out of the antiferromagnetic insulator up to values .
Thus far the observations are similar to the results found by Zitzler et al. (2004) for the two-sublattice fully frustrated Bethe latticeGeorges et al. (1996). The shift of the PMIT to lower values of together with a moderate suppression of the critical temperature for larger however motivated a more detailed investigation of the region of larger . A simple argument based on classical spins with competing interactions showed that one has to expect an additional incommensurate phase here. In fact, as already anticipated qualitatively by Zitzler et al. (2004), for frustrations we eventually found that the PMIT lies within the hysteresis region of the antiferromagnetic phase for , but outgrows it in temperature. For such strong frustration we also found evidence for another magnetic phase besides ferromagnetism or antiferromagnetism. Unfortunately this phase could not be stabilized within our DMFT calculations, so its real nature remains open. In connection with our argument based on classical spins we believe that we can interpret the observed structure as an incommensurate phase. This conjecture is further supported by the fact, that for we found no antiferromagnetic solution of the Néel-type, but only this frustrated magnetic phase.
Especially the latter findings make it highly desirable to set up a scheme that allows to study commensurable structures with period beyond Néel-type for arbitrary lattice structures including longer-ranged hopping.
Acknowledgements.
We want to thank Martin Eckstein and Dr. Markus Kollar for many helpful discussions on the Bethe lattice with nnn hopping, and Dr. Timo Aspelmeier for his help with the vector-spins. This work was supported by the DFG through PR298/10. Computer support was provided by the Gesellschaft für wissenschaftliche Datenverarbeitung in Göttingen and the Norddeutsche Verbund für Hoch- und Höchstleistungsrechnen.Appendix A calculation for vector-spins
Here we want to present the calculation for 3-dimensional vector spins on a Bethe lattice with antiferromagnetic coupling between nn- and nnn-lattice sites.
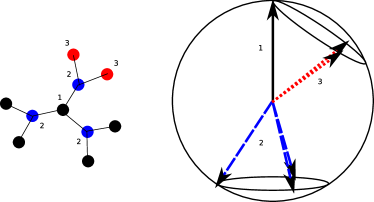
We take nearest neighbors and interaction strengths between nn-sites and between nnn-sites. The last parameter entering this calculation is the angle between nn-spins. Although the initial assumption that two neighboring spins form an angle theta may seem somewhat restrictive, we are not aware of other configurations with lower total energy Aspelmeier (2008). We want to minimize the energy with respect to this angle. According to Fig. 9 the nn-spins of one spin, must lie on a circle. The spins ending on the circle are all nnn-spins. Due to the antiferromagnetic interaction , we assume that they want to maximize the angle between them. Since there are spins on each circle, we assume they will have angle projected on the circle. Using now simple trigonometry, the angle between nnn-spins is given by
where runs from to , giving the different positions on one circle. Inserting this into the Hamiltonian
one finds for the energy
Performing now the limit and scaling and one finally obtains for the energy per lattice site
One can now see that the Néel-state is stable for , because .
References
- Imada et al. (1998) M. Imada, A. Fujimori, and Y. Tokura, Rev. Mod. Phys. 70, 1039 (1998).
- McWhan et al. (1973) D. B. McWhan, J. P. Remeika, W. F. Brinkman, and T. M. Rice, Phys. Rev. B 7, 1920 (1973).
- Katsufuji et al. (1997) T. Katsufuji, Y. Taguchi, and Y. Tokura, Phys. Rev. B 56, 10145 (1997).
- Lefebvre et al. (2000) S. Lefebvre, P. Wzietek, S. Brown, C. Bourbonnais, D. Jérome, C. Mézière, M. Fourmigué, and P. Batail, Phys. Rev. Lett. 85, 5420 (2000).
- Tsai and Marston (2001) S.-W. Tsai and J. Marston, Can. J. Phys. 79, 1643 (2001).
- Morita et al. (2002) H. Morita, S. Watanabe, and M. Imada, J. Phys. Soc. Jpn. 71, 2109 (2002).
- Kurosaki et al. (2005) Y. Kurosaki, Y. Shimizu, K. Miyagawa, K. Kanoda, and G. Saito, Phys. Rev. Lett 95, 177001 (2005).
- Sasaki et al. (2005) T. Sasaki, N. Yoneyama, A. Suzuki, N. Kobayashi, Y. Ikemoto, and H. Kimura, J. Phys. Soc. Jpn. 74, 2351 (2005).
- Aryanpour et al. (2006) K. Aryanpour, W. E. Pickett, and R. T. Scalettar, Phys. Rev. B 74, 085117 (2006).
- Yokoyama et al. (2006) H. Yokoyama, M. Ogata1, and Y. Tanaka, J. Phys. Soc. Jpn. 75, 114706 (2006).
- Kyung and Tremblay (2006) B. Kyung and A.-M. S. Tremblay, Phys. Rev. Lett 97, 046402 (2006).
- Watanabe et al. (2006) T. Watanabe, H. Yokoyama, Y. Tanaka, and J. ichiro Inoue, J. Phys. Soc. Jpn. 75, 074707 (2006).
- Koretsune et al. (2007) T. Koretsune, Y. Motome, and A. Furusaki, J. Phys. Soc. Jpn. 76, 074719 (2007).
- Watanabe et al. (2008) T. Watanabe, H. Yokoyama, Tanaka, and J. Inoue, Phys. Rev. B 77, 214505 (2008).
- Ohashi et al. (2008) T. Ohashi, T. Momoi, K. Tsnunetsugu, and N. Kawakami, Phys. Rev. Lett. 100, 076402 (2008).
- Sasaki et al. (2008) T. Sasaki, N. Yoneyama, and N. Kobayashi, Phys. Rev. B 77, 054505 (2008).
- Nevidomskyy et al. (2008) A. H. Nevidomskyy, C. Scheiber, D. Senechal, and A.-M. Tremblay, Phys. Rev. B 77, 064427 (2008).
- McKenzie (1997) R. McKenzie, Science 278, 820 (1997).
- Lee et al. (2006) P. Lee, N. Nagaosa, and X.-G. Wen, Rev. Mod. Phys. 78, 17 (2006).
- Hegger et al. (2000) H. Hegger, C. Petrovic, E. G. Moshopoulou, M. F. Hundley, J. L. Sarrao, Z. Fisk, and J. D. Thompson, Phys. Rev. Lett. 84, 4986 (2000).
- Hubbard (1963) J. Hubbard, Proc. R. Soc. A 276, 238 (1963).
- Kanamori (1963) J. Kanamori, Prog. Theor. Phys. 30, 275 (1963).
- Gutzwiller (1963) M. C. Gutzwiller, Phys. Rev. Lett. 10, 159 (1963).
- Georges et al. (1996) A. Georges, G. Kotliar, W. Krauth, and M. J. Rozenberg, Rev. Mod. Phys. 68, 13 (1996).
- Wilson (1975) K. G. Wilson, Rev. Mod. Phys. 47, 773 (1975).
- Bulla et al. (2008) R. Bulla, T. A. Costi, and T. Pruschke, Rev. Mod. Phys. 80, 395 (2008).
- Kollar et al. (2005) M. Kollar, M. Eckstein, K. Byczuk, N. Blümer, P. van Dongen, M. H. R. de Cuba, W. Metzner, D. Tanaskovic, V. Dobrosavljevic, G. Kotliar, et al., Ann. Phys. 14, 642 (2005).
- Eckstein et al. (2005) M. Eckstein, M. Kollar, K. Byczuk, and D. Vollhardt, Phys. Rev. B 71, 235119 (2005).
- Pruschke (2005) T. Pruschke, Prog. Theo. Phys. Suppl. 160, 274 (2005).
- Rozenberg et al. (1995) M. J. Rozenberg, G. Kotliar, H. Kajueter, G. A. Thomas, D. H. Rapkine, J. M. Honig, and P. Metcalf, Phys. Rev. Lett. 75, 105 (1995).
- Duffy and Moreo (1997) D. Duffy and A. Moreo, Phys. Rev. B 55, R676 (1997).
- Hofstetter and Vollhardt (1998) W. Hofstetter and D. Vollhardt, Ann. Physik 7, 48 (1998).
- Chitra and Kotliar (1999) R. Chitra and G. Kotliar, Phys. Rev. Lett. 83, 2386 (1999).
- Zitzler et al. (2004) R. Zitzler, N.-H. Tong, T. Pruschke, and R. Bulla, Phys. Rev. Lett. 93, 016406 (2004).
- van Dongen (1991) P. G. J. van Dongen, Phys. Rev. Lett. 67, 757 (1991).
- Eckstein et al. (2007) M. Eckstein, M. Kollar, M. Potthoff, and D. Vollhardt, Phys. Rev. B 75, 125103 (2007).
- Potthoff (2003) M. Potthoff, Eur. Phys. J. B 32, 429 (2003).
- Fleck et al. (1999) M. Fleck, A. I. Lichtenstein, A. M. Oles, and L. Hedin, Phys. Rev. B 60, 5224 (1999).
- Aspelmeier (2008) T. Aspelmeier, private communication.