The clustering and abundance of star-forming and passive galaxies at
Abstract
We use the UKIDSS Ultra-deep survey (UDS), currently the deepest panoramic near infra-red survey, together with deep Subaru optical imaging to measure the clustering, number counts and luminosity function of galaxies at selected using the BzK selection technique. We find that both star-forming (sBzK) and passive (pBzK) galaxies, to a magnitude limit of , are strongly clustered. The passive galaxies are the most strongly clustered population, with scale lengths of h-1Mpc compared with h-1Mpc for star-forming galaxies. The direct implication is that passive galaxies inhabit the most massive dark-matter halos, and are thus identified as the progenitors of the most massive galaxies at the present day. In addition, the pBzKs exhibit a sharp flattening and potential turn-over in their number counts, in agreement with other recent studies. This plateau cannot be explained by the effects of incompleteness. We conclude that only very massive galaxies are undergoing passive evolution at this early epoch, consistent with the downsizing scenario for galaxy evolution. Assuming a purely passive evolution for the pBzKs from their median redshift to the present day, their luminosity function suggests that only of present day massive ellipticals had a pBzK as a main progenitor.
keywords:
Infrared: galaxies – Cosmology: large-scale structure – Galaxies: High Redshift – Galaxies: Evolution – Galaxies: Formation.1 Introduction
There is growing evidence to support the view that the most massive objects in the Universe were the first to assemble and complete their star formation (Kodama et al. 2004; Thomas et al. 2005; De Lucia et al. 2004; Bundy et al. 2006; Stott et al. 2007); this phenomenon has become known as downsizing (Cowie, Songaila, & Barger, 1999). A number of key issues remain unresolved however. There are indications that the build up of the galaxy colour bimodality occurs around (e.g. Cirasuolo et al. 2007), but the precise evolutionary path from the distant Universe to the present day is still undetermined. The mechanism that terminates the major episode of star-formation is poorly understood (Benson, Kamionkowski, & Hassani, 2005), and it is now clear that massive galaxies undergo significant size evolution from to the present day (e.g. Cimatti et al. 2008 and references therein).
Galaxy clustering is an important tool for investigating these populations, since the amplitude of clustering on large scales (Mpc) can provide a measurement of the dark matter halo mass (Mo & White, 1996; Sheth & Tormen, 1999). In principle, therefore, one can relate galaxy populations from the distant past to the present day by tracing the evolution of dark matter halos within the context of a framework for structure formation.
A full exploration of these issues will require large spectroscopic surveys of IR-selected galaxies over a representative volume of the distant Universe. Such surveys are currently at an early stage, so recent work has focused on the photometric colour selection of passive vs. star-forming galaxies at the crucial epoch. The two key methods to date are the BM/BX selection (Erb et al., 2003), which is an extension of the Lyman-break dropout technique, and the BzK technique (Daddi et al., 2004) which is based on -band selection. Recent studies have shown that the BM/BX technique is reasonably efficient at selecting actively star-forming galaxies at , but largely misses the passive galaxy population at these epochs (Quadri et al., 2007; Grazian et al., 2007). In contrast, the BzK method appears to be the most complete of the broad-band techniques for the selection of both star-forming and passive galaxies (Daddi et al., 2004; van Dokkum et al., 2006; Grazian et al., 2007). Based on initial -band selection, in principle it does not suffer the same heavy biases caused by dust or the age of the stellar populations.
An alternative is to use a larger set of filters over a range of wavelengths and infer a galaxy’s redshift from comparison of the calculated magnitudes with a set of templates (Cirasuolo et al. 2007 and references therein). This work makes use of such photometric redshifts and in principle one can derive the stellar age of a galaxy using such templates. However due to the uncertainties in determining stellar ages from the template fits, and the desire for comparison with the literature, the bulk of the present analysis is based on simple BzK selection.
The BzK technique was first developed using the K20 survey (Cimatti et al., 2002) by Daddi et al. (2004), and preferentially selects star-forming and passive galaxies in the redshift range by using the B-, z- and Ks-band broadband filters. Recent work has shown that the number counts of these populations differ markedly (Kong et al., 2006; Lane et al., 2007), with star-forming galaxies being far more abundant at all magnitudes. The abundance of sBzK galaxies allowed Kong et al. (2006) (henceforth K06) to perform a detailed clustering analysis, segregated by limiting K-band luminosity in the range . They found that the clustering of sBzKs is strongly dependent on -band luminosity. Hayashi et al. (2007) studied the clustering of sBzKs over a smaller area (180 arcmin2) but to much greater depth (K) and confirmed this strong luminosity dependence. The sBzK population therefore appear to inhabit a range of halo masses, and are therefore likely to be the progenitors of a wide range of present day galaxies.
There have been fewer studies of passive galaxy clustering at high redshift, in part because of their relatively low surface density. K06 found early evidence that pBzKs are more strongly clustered than sBzKs, although the limited depth and area of this survey ( to K) gives rise to significant statistical uncertainly, particularly given the relatively low surface density of pBzKs at these magnitudes ( arcmin-2). Blanc et al. (2008) measured the clustering and number counts of BzK-selected galaxies to the same depth as K06, but over a much wider area (0.71 deg2 total between two fields). Their BzK clustering amplitudes are smaller than those of K06 but consistent at the level. Analysis of deeper survey data over a similar area is required to confirm these results, and we present such an analysis in this work.
Lane et al. (2007) (henceforth L07) used the Early Data Release (EDR) from the UKIDSS UDS to investigate the number counts and overlap in colour-selected galaxies, including those selected by the BzK technique. They found that the flattening in pBzK number counts observed by K06 extends to become a plateau at the EDR depth of and noted that if this were to continue to turn over it could imply an absence of high-redshift passive galaxies at low luminosities.
In this work we investigate the number counts and clustering of BzK-selected galaxies over a substantially greater depth and area than any previous study. Section 2 describes the data and galaxy number counts. In Section 3 we present an angular clustering analysis, which is extended by de-projection to infer the real-space correlation lengths. In Section 4 we use photometric redshifts to derive a luminosity function for these populations, and compare with the present-day galaxy luminosity function. A discussion and conclusions are presented in Section 5. Throughout this paper we assume a flat CDM cosmology with and .
2 Source identification and number counts
2.1 Data set and sample definitions
The UKIRT Infrared Deep Sky Survey (UKIDSS) has been underway since spring 2005 and comprises 5 sub-surveys covering a range of areas and depths (Lawrence et al., 2007). This survey has been made possible by the advent of the UKIRT Wide-Field Camera (Casali et al., 2007).
We base the present study on data from the deepest component of UKIDSS, the Ultra Deep Survey (Almaini et al. in preparation). This aims to reach final depths of (, point source, 2”) over an area of 0.8 deg2. The size of the UDS field significantly reduces the effects of cosmic variance and on this scale is the deepest near-infrared survey to date. For this work we use the UDS DR1 release (Warren et al., 2007), which reaches (point source) depths of K and J. For details of the completeness estimation, image stacking, mosaicing and catalogue extraction procedures see Foucaud et al. (2007) and Almaini et al. (in preparation). In addition to these data, deep imaging is also available from Subaru Suprimecam to limiting depths of and (Furusawa et al., 2008). The UDS and Subaru survey areas are not entirely coincident, which reduces our usable area to 0.63 deg2 in this analysis.
2.2 Construction of the BzK colour-colour diagram
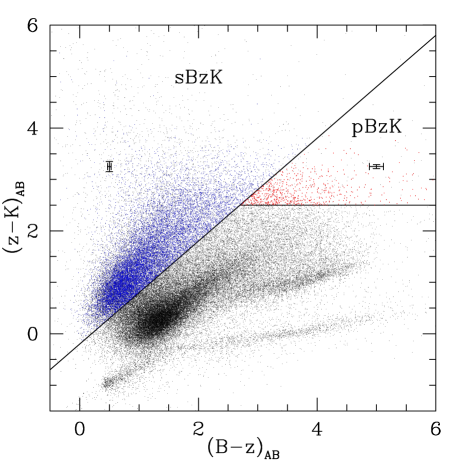
The original BzK selection technique was introduced in Daddi et al. (2004) based on photometry in the Bessel -band, Gunn -band and -bands as defined on the FORS1, FORS2 and ISAAC instruments at the Very Large Telescope (VLT). To correct our colours to these filters we used the stellar track of K06, who in turn used published empirical stellar spectra from Pickles (1998) and synthetic stellar spectra from Lejeune, Cuisinier, & Buser (1997), convolved with the filter responses of the VLT instruments used in Daddi et al. (2004). These derived colours provide a convenient reference for matching stars on the well-defined BzK stellar locus. We use the adjusted stellar locus of K06 in the following way.
The stellar locus can be split into a main branch and a “knee” feature, clearly visible in the lower part of figure 1. The intersection of these branches provides a fixed point in the BzK plane from which we can derive a quantitative adjustment. Using a least squares fit to each section, we derived the following offset in and colours to this fixed point to convert to the photometric system of Daddi et al. (2004):
| (1) |
| (2) |
This correction is then applied to all sources in the BzK plane. We henceforth refer to BzK photometry defined in this way.
The standard BzK definitions of Daddi et al. (2004) were then used to construct our BzK sample. K-band sources () from the UDS were used as the primary catalogue, with optical magnitudes extracted directly from the Subaru imaging data after careful matching of the Subaru and UDS astrometric frames. Aperture magnitudes were then extracted using a 2-arcsec diameter. Only sources outside the contaminated halos of saturated optical stars were used.
All K-band sources with were used for BzK selection unless both the B- and z′-band magnitudes were fainter than the limits measured on those images ( of sources outside of contaminated regions), since these cannot be constrained within the BzK plane.
Overall this procedure results in the selection of 15177 sBzKs (21.7% of the full sample) and 742 pBzKs (1.06 % of the sample), 11551 and 702 respectively at .
2.3 Number counts

| K bin | all | sBzK | pBzK | Worst |
|---|---|---|---|---|
| centre | sources | case pBzK | ||
| 17.41 | 2.832 | 0.198 | - | - |
| 17.91 | 2.803 | 0.676 | - | - |
| 18.41 | 2.957 | 0.198 | - | - |
| 18.91 | 3.203 | 0.500 | - | - |
| 19.41 | 3.380 | 1.403 | 0.676 | 0.676 |
| 19.91 | 3.556 | 2.025 | 1.429 | 1.429 |
| 20.41 | 3.720 | 2.504 | 1.914 | 1.923 |
| 20.91 | 3.872 | 2.982 | 2.181 | 2.185 |
| 21.41 | 3.998 | 3.315 | 2.386 | 2.394 |
| 21.91 | 4.121 | 3.592 | 2.386 | 2.394 |
| 22.41 | 4.229 | 3.778 | 2.377 | 2.431 |
| 22.91 | 4.285 | 3.849 | 2.158 | 2.394 |
| 23.41 | 4.258 | 3.536 | 1.560 | 2.158 |
| 23.91 | 3.942 | 0.801 | - | - |
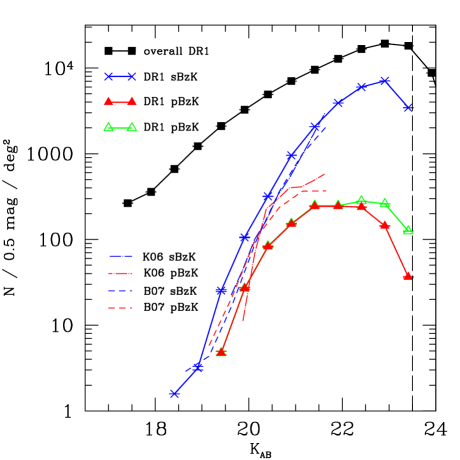
The differential K-band number counts are illustrated in Figure 2, and tabulated in Table 1, for both the full sample of galaxies and those selected as passive and star-forming BzKs. We find a steep rise in the counts of star-forming sBzKs toward fainter magnitudes. In contrast, pBzK number counts exhibit an apparent flattening at , consistent with the findings of K06 and L07. Since these galaxies are sampled over a relatively narrow redshift range, this may imply that the passive population consists largely of luminous galaxies at this early epoch (see Section 4).
To investigate the reality of the turn-over, we note that the galaxies around and beyond this feature have very faint B-band magnitudes, with a substantial fraction (62%) below the detection limit in this band (). A non-detection in the -band does not affect their classification, however, and merely pushes them red-ward in B-z colour in the BzK diagram illustrated in Figure 1. The more worrying class are the objects which are below the limit in and , which cannot be assigned BzK classification (164 objects). Figure 3 shows that even within our K-band limit, we become incomplete above . We study the effect of this incompleteness by considering the extreme case in which all of the objects with B- and -band magnitudes fainter than the limits (28.4 and 26.7 respectively) are pBzKs. In this ’worst case’ sample the number counts still exhibit a plateau, as before, but with the absence of a turn-over.
At our conservative limit of our completeness is % for compact galaxies (Almaini et al., in prep.), so the feature is unlikely to be due to -band incompleteness unless there is unprecedented size-evolution in the pBzK population towards fainter magnitudes compared to the general population. The extreme compactness of passive galaxies at these redshifts observed by Cimatti et al. (2008) suggests that of the two classes, the sBzKs should suffer more from such incompleteness. There is no evidence from their number counts to suggest that they are adversely affected in this way, so we expect that the pBzKs are likewise unaffected below this magnitude.
Photometric errors are another source of concern. Adjusting the boundaries for pBzK selection by the mean photometric errors for sources close to the boundaries ( magnitudes), we found that such errors had no noticeable impact on the decline in the pBzK population. Additionally, since the pBzK region of the colour-colour plane is sparsely populated, photometric errors are likely to scatter fainter objects into pBzK selection, rather than the opposite. The faint pBzK counts are thus likely to be slightly overestimated because of photometric errors.
We conclude that the flattening in the pBzK population is likely to be real and the subsequent turn-over is probable but not certain. We note that the turnover corresponds to absolute magnitude at z = 1.4, which is close to the value of determined for the K-band luminosity function at these redshifts (Cirasuolo et al., 2007). Taken at face value, these results are suggestive of a sharp decline in the number density of pBzK galaxies towards lower luminosities, consistent with expectation from downsizing. As correctly pointed out in Grazian et al. (2007) and predicted by Daddi et al. (2004), this is not necessarily equivalent to a true decline in the number density of passive galaxies, since the efficiency and completeness of the pBzK technique is largely untested at such faint magnitudes. In particular, there is some evidence that passive galaxies can also be found among the redder sBzK galaxies (at large values of ), with a possible incompleteness as high as Grazian et al. (2007). We find that randomly adding an additional % of galaxies to the pBzK sample from this part of the diagram is indeed sufficient to remove the apparent turn-over, since these are predominantly the fainter sBzK galaxies.
The sBzK number counts are significantly higher than those of K06, Blanc et al. (2008) and Imai et al. (2008) (not plotted); while the pBzK number counts are lower. The UDS field is more than 6 times larger than that of the K20 survey and 4 times larger than the one used in Imai et al. (2008). The combined field used in Blanc et al. (2008) is of a similar size to the UDS, cosmic variance is the most likely explanation for the difference in number counts in this case.
3 Clustering properties
3.1 Angular clustering
The 2-point angular correlation function, is defined by the joint probability of finding two galaxies in solid angle elements and at a given separation (Peebles, 1980),
| (3) |
To estimate the correlation function we use the estimator of Landy & Szalay (1993),
| (4) |
where DD, DR and RR are the counts of data-data, data-random and random-random pairs respectively at angular separation , normalised by the total number possible. Although this estimator is relatively robust against systematic errors, there remains a small bias due to the finite field size, which is corrected for an integral constraint by a constant, C. We follow the method of Roche & Eales (1999) by using the random–random counts to estimate the size of this bias:
| (5) |
where the sums extend to the largest separations within the field.
The sBzK and pBzK samples were selected to a limit of . We adopted this conservative magnitude limit to ensure the minimum contamination by spurious sources. We fit a single power law of the form to the corrected data over the separation range degrees, fixing the slope to the fiducial and minimising the . The errors on the measurements are a combination of those due to shot noise (estimated by bootstrap resampling) and an estimate of those due to cosmic variance. The estimates for cosmic variance were found by splitting the field into 4 and computing the variance of .
In order to fit the clustering reliably, we wish to avoid small-scale excesses due to multiple galaxy occupation of a single halo. The lower bound was chosen to correspond to Mpc (co-moving) at z for this reason. The upper bound is a conservative estimate of the limit to which our data have enough signal for a reliable fit to be obtained.
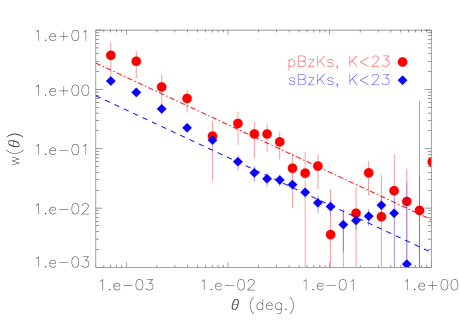
For sBzK galaxies the amplitude was found to be (deg.0.8)and for the pBzK population (deg.0.8). The clustering amplitude of the pBzKs is inconsistent with the clustering of sBzK galaxies at the 3-sigma level. Figure 4 shows the clustering measurements corrected for the integral constraint for the sBzK and pBzK galaxies.
3.2 De-projected clustering amplitude
The real space clustering and projected clustering are linked by the relativistic Limber equation (Limber, 1954). If the redshift distribution of a sample is known, the Limber equation can be inverted and the correlation length, , can be calculated in a robust manner (Peebles, 1980; Magliocchetti & Maddox, 1999)
To estimate the redshift distribution we use photometric redshifts based on the Subaru and UDS bands previously introduced, with the addition of Spitzer data taken as part of the SWIRE survey (Lonsdale et al., 2003). The method is described fully in Cirasuolo et al. (2007), and consists of minimising the of synthetic galaxy templates. The distributions are shown in figure 5. The photometric redshift distribution was then used directly in the inverted Limber’s equation during the calculation of . The values obtained in this manner are r Mpc and Mpc for pBzKs and sBzKs respectively. The quoted errors are due to the error in the fit to the clustering amplitude and therefore take into account the shot noise and cosmic variance.

The photometric redshifts are subject to errors ( and for pBzKs and sBzKs respectively), however, and assuming that the true redshift distribution is highly peaked, these errors are likely to broaden the measured distribution. A broader distribution will result in a larger inferred clustering scale length. It is therefore important that we take such errors into account. We do so by assuming the errors are Gaussian, and then deconvolve the errors from the redshift distribution using a Fourier-based Wiener filter. A more detailed description of this method is provided in the appendix. The resulting de-convolved redshift distributions are shown in figure 5.
The scaling lengths recovered using the corrected redshift distribution are as follows: Mpc and Mpc for pBzKs and sBzKs respectively.
However, we note that our photometric redshift code is largely untested for pBzK and sBzK galaxies. This work will be refined by the use of an ongoing ESO Large Programme using VIMOS and FORS2 on the VLT to target one sixth of the UDS DR1 galaxies with photometric redshifts .
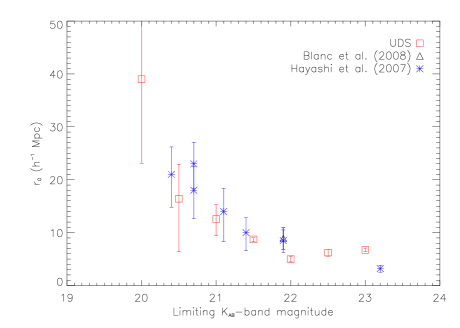
We also confirm previous claims for a dependence of sBzK clustering on apparent magnitude (Hayashi et al., 2007). Figure 6 and Table 2 show the values for sBzKs with varying limiting magnitude. The dependence is much stronger at magnitudes of , indicating a strong correlation between halo mass and sBzK luminosity for these objects.
| KAB,lim | N | r0 |
|---|---|---|
| 20.0 | 92 | |
| 20.5 | 250 | |
| 21.0 | 689 | |
| 21.5 | 1724 | |
| 22.0 | 3789 | |
| 22.5 | 7199 | |
| 23.0 | 11551 |
3.3 BzK galaxies selected at
The BzK selection was defined by Daddi et al. (2004) to isolate galaxies in the redshift range . Clearly from figure 5, and as expected by Daddi et al. (2004), there are contaminating objects from outside of this range. Using our photometric redshifts we can asses how successful the BzK selection technique is in reproducing the clustering of objects within the desired range.
Following the same method outlined for the full samples, we compute clustering amplitudes find correlation lengths of Mpc and Mpc for pBzKs and sBzKs respectively. These values are slightly lower than those for the full samples and indicate that the high redshift tails in the full sample are at least as highly clustered as those within the range. However, the conclusions drawn from the full sample are still valid, namely that the pBzK galaxies are significantly more strongly clustered than the sBzK galaxies.
4 Luminosity function
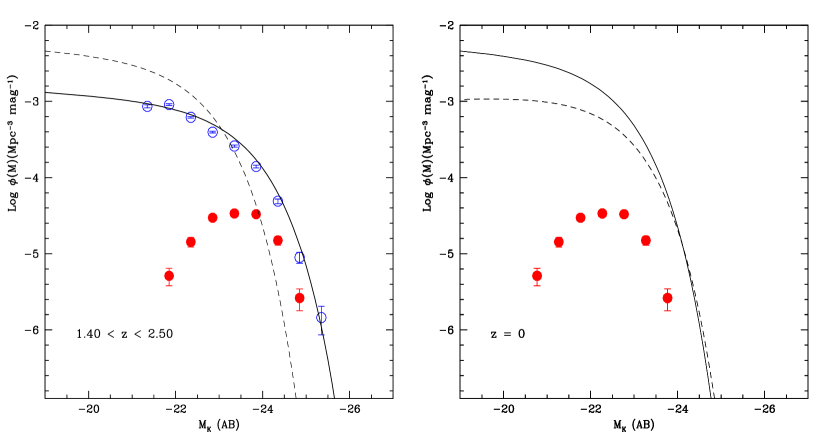
A luminosity function was constructed for our BzK-selected galaxies in the same way as detailed in Cirasuolo et al. (2007), by using the method (Schmidt, 1968). Figure 7 shows the luminosity function for the BzK galaxies with photometric redshifts in the range (points with error-bars), compared with all K-selected galaxies in the same range (solid line). Also plotted is the luminosity function from Kochanek et al. (2001). It is clear that sBzK galaxies sample a wide range in luminosity, while the pBzK population are dominated by bright galaxies with . At this epoch, however, the bright end of the luminosity function is still dominated by star-forming objects, consistent with Cirasuolo et al. (2007) who found that the galaxy colour bimodality is weak at these redshifts. The pBzK galaxies are nevertheless likely to be among the most massive systems, since the mass-to-light ratio will be significantly lower for the actively star-forming systems.
Under the assumption that the pBzKs passively evolve to the present day (with minimal merging) one can estimate their contribution to the bright end of the present-day luminosity function. The implied evolution is modelled from (the median value for pBzKs) to assuming the spectral evolution models of Bruzual & Charlot (2003). For simplicity we chose a solar metalicity model and a Salpeter initial mass function (Salpeter, 1955) and assume only passive evolution from initial formation bursts at redshifts and . This results in a Johnson -band absolute magnitude evolution in the range . Taking the mean value we can estimate the minimum number of present day bright () galaxies that could previously have been pBzKs. Under our assumptions we find that of such galaxies can be explained by passively evolved pBzKs. It is assumed that the remainder is made up of the descendants of bright sBzKs and merger remnants from within and between the two classes.
5 Discussion and conclusions
We present the number counts, clustering and luminosity function of galaxies at selected using the BzK selection criteria. The pBzK galaxies show a marked flattening in their number counts which cannot be explained by the effects of incompleteness, and a possible turn over at faint magnitudes. We conclude that, at this epoch, it is generally luminous, massive galaxies that are undergoing passive evolution. This is consistent with the down-sizing scenario, in which the most massive galaxies are formed first and are the first to evolve onto the red sequence (Kodama et al., 2004).
The angular clustering of the passive galaxy sample is very strong, approximately times the amplitude of the sBzK population. This is in part due to their relatively narrow redshift distribution (K06), but a large difference remains after de-projection to the real-space correlation length. We find Mpc and Mpc for the pBzK and sBzK galaxies respectively. Our value for the correlation length of sBzKs is almost twice that found by Hayashi et al. (2007), who used a sample with similar limiting magnitude but with smaller field size ( arcmin2, compared with arcmin2 for the UDS). Our sample consists of more than 10 times the number of sBzKs than that of Hayashi et al. (2007) and in addition we make fewer assumptions regarding their redshift distribution. Further surveys reaching depths of are required to fully account the effects of cosmic variance, however.
We also confirm that the scale-length for the clustering of sBzK galaxies is dependent on apparent magnitude, consistent with the work of Hayashi et al. (2007) (figure 6). This dependence is far more significant at magnitudes below indicating a strong correlation between such galaxies and the mass of the hosting halo.
In addition to this luminosity dependence there is a clear enhancement at small scales in the sBzK clustering. This enhancement is indicative of multiple sBzK galaxies occupying a single dark matter halo. The scale at which this turn-off occurs can provide an indication of the size, and hence mass, of the hosting dark matter halos. The turn-off occurs at deg, which corresponds to Mpc at z. Halos of this size have masses between and (Mo & White, 2002). A full consideration of this enhancement within the halo occupation distribution framework will be presented in a future paper. The host halo mass can also be derived from comparing the de-projected clustering scale length with models of dark matter halo clustering evolution. Using models based on Mo & White (2002) we find a typical halo mass of .
Applying the model of clustering evolution to the pBzKs we can qualitatively conclude that they are inhabitants of the most massive halos at their epoch (in excess of ); halos which will eventually become massive groups and clusters by the present day. The evolutionary path that pBzKs take with redshift will also be the subject of future work, using further colour selection techniques.
Our conclusion based on the measurement is strengthened by their luminosity function. Even under the strict assumption of purely passive evolution, the descendants of pBzKs occupy the bright end of the luminosity function. Such galaxies are group and cluster dominant galaxies in the local universe. The brightest () sBzKs have clustering scale lengths comparable to, or greater than, that which we have found for the pBzKs. This finding indicates that such galaxies will also become group and cluster dominant galaxies by . The implication is that we are indeed witnessing the epoch at which the build up of the red sequence begins.
Acknowledgments
OA, IRS and RJM acknowledge the support of the Royal Society. SF, MC, KPL and WGH acknowledge the support of STFC. We are grateful to Xu Kong for help in matching photometric filters and also to Kaz Sekiguchi and Hisanori Furusawa for the Subaru data used in this study. We also extend out gratitude to the staff at UKIRT for their tireless efforts to ensure that the UKIDSS surveys are a success. We would also like to thanks the anonymous referee for their thorough reading and useful comments.
Appendix
In this Appendix we describe the Fourier method used to deconvolve photometric redshift errors from the n(z) distribution, which can then be used to invert the Limber equation. The errors in the photometric redshift distribution are assumed to be Gaussian and it is also assumed that the measured distribution is simply the convolution of these errors with the true redshift distribution. Under these assumptions it should be possible to deconvolve the errors from the measured distribution, using the fact that a convolution is simply a multiplication in the Fourier domain. Dividing the Fourier transform of the measured distribution by that of the Gaussian errors, should then give us an estimate of the true distribution.
In practice, a relatively large number of terms in the discreet Fourier transform are required to reproduce the redshift distribution accurately, and as the the Fourier transform of a Gaussian is also a Gaussian, small levels of high frequency noise can be amplified greatly to give a spurious result. One way to avoid such a problem is to use a Wiener filter:
| (6) |
Where H(k) is the Fourier transform of the Gaussian errors and SNR the signal to noise ratio. In the limit of SNR being infinite, this filter tends to as in the simple deconvolution above. SNR is estimated by fitting the power spectrum of the redshift distribution to a function of the form , with c identified as being the noise level. The resultant redshift distributions are shown in figure 5.
References
- Benson, Kamionkowski, & Hassani (2005) Benson A. J., Kamionkowski M., Hassani S. H., 2005, MNRAS, 357, 847
- Blanc et al. (2008) Blanc G. A., et al., 2008, arXiv, 803, arXiv:0803.0763
- Bruzual & Charlot (2003) Bruzual G., Charlot S., 2003, MNRAS, 344, 1000
- Bundy et al. (2006) Bundy K., et al., 2006, ApJ, 651, 120
- Casali et al. (2007) Casali M., et al., 2007, A&A, 467, 777
- Cimatti et al. (2002) Cimatti A., et al., 2002, A&A, 381, L68
- Cimatti et al. (2008) Cimatti A., et al., 2008, A&A, 482, 21
- Cirasuolo et al. (2007) Cirasuolo M., et al., 2007, MNRAS, 380, 585
- Cowie, Songaila, & Barger (1999) Cowie L. L., Songaila A., Barger A. J., 1999, AJ, 118, 603
- Daddi et al. (2004) Daddi E., et al., 2004, ApJ, 617, 746
- De Lucia et al. (2004) De Lucia G., et al., 2004, ApJ, 610, L77
- Dye et al. (2006) Dye S., et al., 2006, MNRAS, 372, 1227
- Erb et al. (2003) Erb D. K., Shapley A. E., Steidel C. C., Pettini M., Adelberger K. L., Hunt M. P., Moorwood A. F. M., Cuby J.-G., 2003, ApJ, 591, 101
- Foucaud et al. (2007) Foucaud S., et al., 2007, MNRAS, 376, L20
- Furusawa et al. (2008) Furusawa H., et al., 2008, ApJS, 176, 1
- Grazian et al. (2006) Grazian A., et al., 2006, A&A, 453, 507
- Grazian et al. (2007) Grazian A., et al., 2007, A&A, 465, 393
- Hayashi et al. (2007) Hayashi M., et al., 2007, ApJ, 660, 72
- Imai et al. (2008) Imai K., Pearson C. P., Matsuhara H., Wada T., Oyabu S., Takagi T., Fujishiro N., Hanami H., 2008, arXiv, 804, arXiv:0804.3462
- Kochanek et al. (2001) Kochanek C. S., et al., 2001, ApJ, 560, 566
- Kodama et al. (2004) Kodama T., et al., 2004, MNRAS, 350, 1005
- Kong et al. (2006) Kong X., et al., 2006, ApJ, 638, 72
- Landy & Szalay (1993) Landy S. D., Szalay A. S., 1993, ApJ, 412, 64
- Lane et al. (2007) Lane K.P., et al., 2007, MNRAS, 379, L25
- Lawrence et al. (2007) Lawrence A., et al., 2007, MNRAS, 379, 1599
- Lejeune, Cuisinier, & Buser (1997) Lejeune T., Cuisinier F., Buser R., 1997, A&AS, 125, 229
- Limber (1954) Limber D. N., 1954, ApJ, 119, 655
- Lonsdale et al. (2003) Lonsdale C. J., et al., 2003, PASP, 115, 897
- Magliocchetti & Maddox (1999) Magliocchetti M., Maddox S. J., 1999, MNRAS, 306, 988
- Mo & White (1996) Mo H. J., White S. D. M., 1996, MNRAS, 282, 347
- Mo & White (2002) Mo H. J., White S. D. M., 2002, MNRAS, 336, 112
- Peebles (1980) Peebles P. J. E., 1980, lssu.book,
- Pickles (1998) Pickles A. J., 1998, PASP, 110, 863
- Quadri et al. (2007) Quadri R., et al., 2007, AJ, 134, 1103
- Roche & Eales (1999) Roche N., Eales S. A., 1999, MNRAS, 307, 703
- Salpeter (1955) Salpeter E. E., 1955, ApJ, 121, 161
- Schmidt (1968) Schmidt M., 1968, ApJ, 151, 393
- Sheth & Tormen (1999) Sheth R. K., Tormen G., 1999, MNRAS, 308, 119
- Stott et al. (2007) Stott J. P., Smail I., Edge A. C., Ebeling H., Smith G. P., Kneib J.-P., Pimbblet K. A., 2007, ApJ, 661, 95
- Thomas et al. (2005) Thomas D., Maraston C., Bender R., Mendes de Oliveira C., 2005, ApJ, 621, 673
- van Dokkum et al. (2006) van Dokkum P. G., et al., 2006, ApJ, 638, L59
- Warren et al. (2007) Warren S. J., et al., 2007, MNRAS, 375, 213