SMA CO (2–1) Observations of CG 30: a Protostellar Binary System with a High-Velocity Quadrupolar Molecular Outflow
Abstract
We present interferometric observations in the 12CO (2–1) line and at 1.3 mm dust continuum of the low-mass protostellar binary system in the cometary globule CG 30, using the Submillimeter Array. The dust continuum images resolve two compact sources (CG 30N and CG 30S), with a linear separation of 8700 AU and total gas masses of 1.4 and 0.6 , respectively. With the CO images, we discover two high-velocity bipolar molecular outflows, driven by the two sources. The two outflows are nearly perpendicular to each other, showing a quadrupolar morphology. The northern bipolar outflow extends along the southeast (redshifted, with a velocity up to 23 km s-1) and northwest (blueshifted, velocity up to 30 km s-1) directions, while the southern pair has an orientation from southwest (blueshifted, velocity up to 13 km s-1) to northeast (redshifted, velocity up to 41 km s-1). The outflow mass of the northern pair, driven by the higher mass source CG 30N, is 9 times larger than that of the southern pair. The discovery of the quadrupolar molecular outflow in the CG 30 protobinary system, as well as the presence of other quadrupolar outflows associated with binary systems, demonstrate that the disks in (wide) binary systems are not necessarily co-aligned after fragmentation.
1 INTRODUCTION
Binarity/multiplicity is frequent among protostellar systems (see e.g., Looney et al. 2000). To probe these protostellar binary (protobinary) systems, high angular resolution observations of gas and optically thin dust emission at (sub-) millimeter (mm) wavelengths are needed, because protostellar systems are deeply embedded in molecular cloud cores and are surrounded by infalling envelopes and accretion disks. However, these observations were long limited by the low angular resolution of single-dish telescopes and have only become possible with the recent availability of large (sub-) mm interferometers. During the past few years, interferometric mm observations have enabled us to discover several protobinary systems (Launhardt 2004), and there is an increasing number of interferometric studies of binarity in the protostellar stage (e.g., Chen et al. 2007). Nevertheless, due to the large effort and observing time required, the number of known and well-studied protobinary systems is still very small.
CG 30 (also known as BHR 12, Bourke et al. 1995; or DC 253.31.6, Hartley et al. 1986) is a bright-rimmed cometary globule located in the Gum Nebula region at a distance of 400 pc (Reipurth 1983). With high resolution submm (SCUBA; Henning et al. 2001) and mm (ATCA; Chen et al. 2008, hereafter Paper I) dust continuum observations, we have identified in this globule a wide protobinary system with a projected separation of 217 ( 8700 AU) and bolometric luminosities of 13.6 0.8 and 4.3 0.5 for the northern and southern protostars, respectively. The two protostars appear to drive their own bipolar protostellar jets, which are roughly perpendicular to each other, as seen in the H2 1–0 (1) (Hodapp & Ladd 1995) and the IRAC 4.5 m images (Paper I). However, information on the molecular outflows in this protobinary system has been limited, although single-dish observations in the CO line (Nielsen et al. 1998) and CS line (Garay et al. 2002) had shown a large-scale (unresolved) bipolar outflow in the east-west direction. In this Letter, we report Submillimeter Array111The Submillimeter Array is a joint project between the Smithsonian Astrophysical Observatory and the Academia Sinica Institute of Astronomy and Astrophysics and is funded by the Smithsonian Institution and the Academia Sinica. (SMA; Ho et al. 2004) observations in the 12CO (2–1) line towards CG 30 with angular resolution sufficient to allow us, for the first time, to map the distribution of outflowing molecular gas from each member of the protobinary system.
2 OBSERVATIONS AND DATA REDUCTION
Observations at the SMA were carried out on 2008 March 7th in the compact configuration. Eight antennas were used in the array, providing baselines with projected lengths from 14.1 to 136 m. The digital correlator was set up to cover the frequency ranges 219.5221.3 GHz and 229.5231.3 GHz in the lower and upper sidebands, respectively. This setup includes three isotopic CO lines of 12CO (2–1) (230.538 GHz), 13CO (2–1) (220.399 GHz), and C18O (2–1) (219.560 GHz), which were observed with an uniform channel spacing equivalent to 0.5 km s-1. The 1.3 mm dust continuum emission was also recorded with a total bandwidth of 3.5 GHz ( 1.7 GHz USB and 1.8 GHz LSB). System temperatures ranged from 200 to 400 K (depending on elevation), with a typical value of 300 K. The primary beam is about 55′′ at 230 GHz. The quasar 3C84 was used for bandpass calibration, and the quasars 0747–331 and 0727–115 for gain calibration. Titan was used for absolute flux calibration, which we judge accurate to 20%, by comparison of the final quasar fluxes with the SMA calibration database.
The data were calibrated using the IDL MIR package (Qi 2005) and imaged using the Miriad toolbox (Sault et al. 1995). With robust uv weighting 2, cleaned maps of the 12CO (2–1) emission and the continuum emission were produced with effective synthesized beam sizes of 55 24 and 50 20, respectively. The 1 rms noise levels are 0.13 (width 0.5 km s-1) and 0.10 Jy beam-1 (width 2.0 km s-1) per velocity channel, and 4 mJy beam-1 for the continuum emission. The final images were uncorrected for the primary beam attenuation. Further analysis was performed with the GILDAS222see http://www.iram.fr/IRAMFR/GILDAS software package.
3 RESULTS
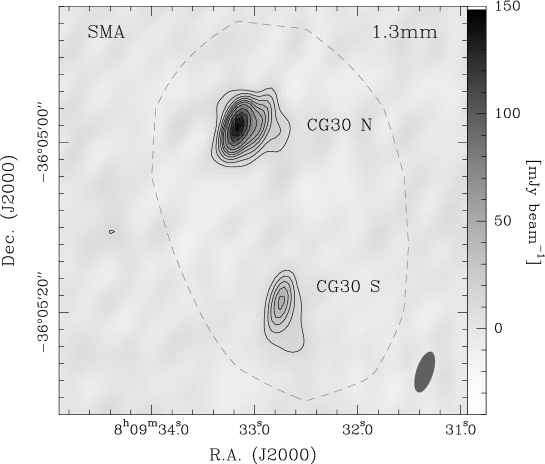
The SMA 1.3 mm dust continuum image of CG 30 (Fig. 1) shows two compact sources, which were previously detected in our ATCA 3 mm dust continuum image (see Paper I). The angular separation between the two sources is measured to be 218 05, consistent with the ATCA result. Following Paper I, we refer to the northern source as CG 30N (also consistent with IRAS 080763556) and to the southern source as CG 30S. From Gaussian plane fitting, we derive flux densities of 256 51 mJy for source N and of 99 20 mJy for source S. The large-scale common envelope (see Fig. 1), detected in the single-dish 1.3 mm maps with a total flux of 1500 mJy (R. Launhardt et al., in preparation), is resolved out by the interferometer, namely that 75% flux is missing in the SMA map.
From the continuum fluxes measured at 1.3 mm and 3 mm, we derive a spectral index 3.2 (where flux α) in both sources, suggesting optically thin emission. The total gas mass in the circumstellar envelope was then calculated with the same method described in Launhardt & Henning (1997). In the calculations, we adopt an interstellar hydrogen-to-dust mass ratio of 110 (Draine & Lee 1984) and a factor of 1.36 accounting for helium and heavier elements. For the two sources, we use a mass-averaged dust temperature333The dust temperature has been calculated in Paper I through the results of the spectral energy distribution (SED) and found to be 22 K for CG 30N and 27 K for CG 30S. Nevertheless, simple multi-component greybody fits to an SED to not properly treat temperature gradients and effects of very small, externally heated grains. Due to this uncertainty and to make the results for the two sources better comparable, we use one reference temperature for both sources. The actual dust masses must be scaled with the (not well-known) dust temperature. of = 20 K and an opacity of = 0.8 cm2 g-1, a typical value suggested by Ossenkopf & Henning (1994) for coagulated grains in protostellar cores. From the 1.3 mm dust continuum image, the total gas masses of sources N and S are estimated to be 1.4 0.3 and 0.6 0.1 , respectively, for the assumed distance of 400 pc. By contrast with the gas masses derived from the 3 mm dust continuum images, we estimate an opacity index of 1.5 () for the two sources, a fairly typical index found in protostellar cores (see Ossenkopf & Henning 1994).
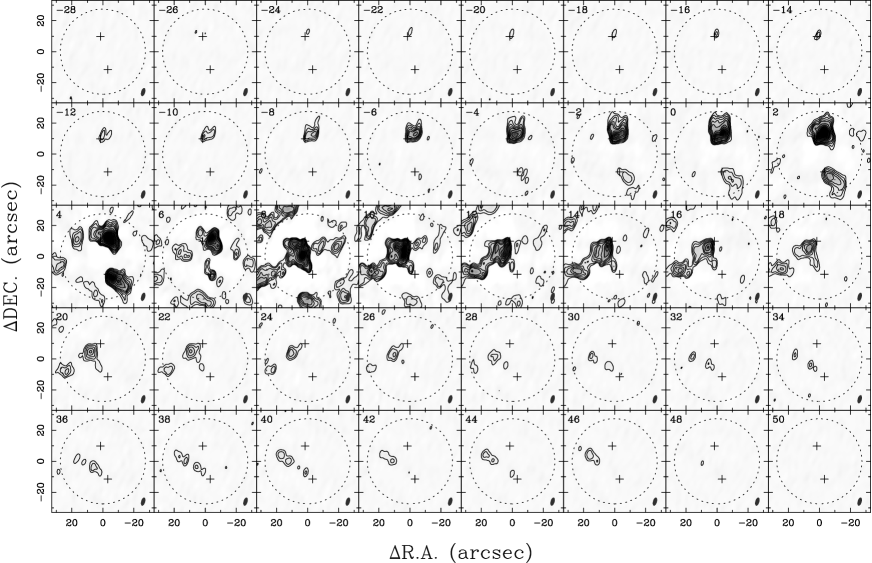
Figure 2 shows the velocity channel maps of the 12CO (2–1) emission. For display purpose, we have smoothed the channel maps into a velocity resolution of 2.0 km s-1. The CO emission is detected from = 26 km s-1 to 48 km s-1, with systemic velocity being 6.5 km s-1. We note that the emission near the systemic velocity is scattered over the field of view, because the extended emission has been resolved out by the interferometer. Also note that the emission in the northeast and southeast corners of the panels between 8 and 18 km s-1 is aliasing due to insufficient coverage. In each panel, the two crosses indicate the positions of the two dust continuum sources. The CO emission from the two sources can be clearly distinguished due to their wide separation. For source CG 30N, blueshifted emission (from = 24 km s-1 to 3 km s-1) is extending to northwest, while redshifted emission (from 8 km s-1 to 29 km s-1) is to southeast; For source CG 30S, blueshifted emission (from 6 km s-1 to 5 km s-1) is extending to southwest, while redshifted emission (from 30 km s-1 is to 48 km s-1) to northeast.
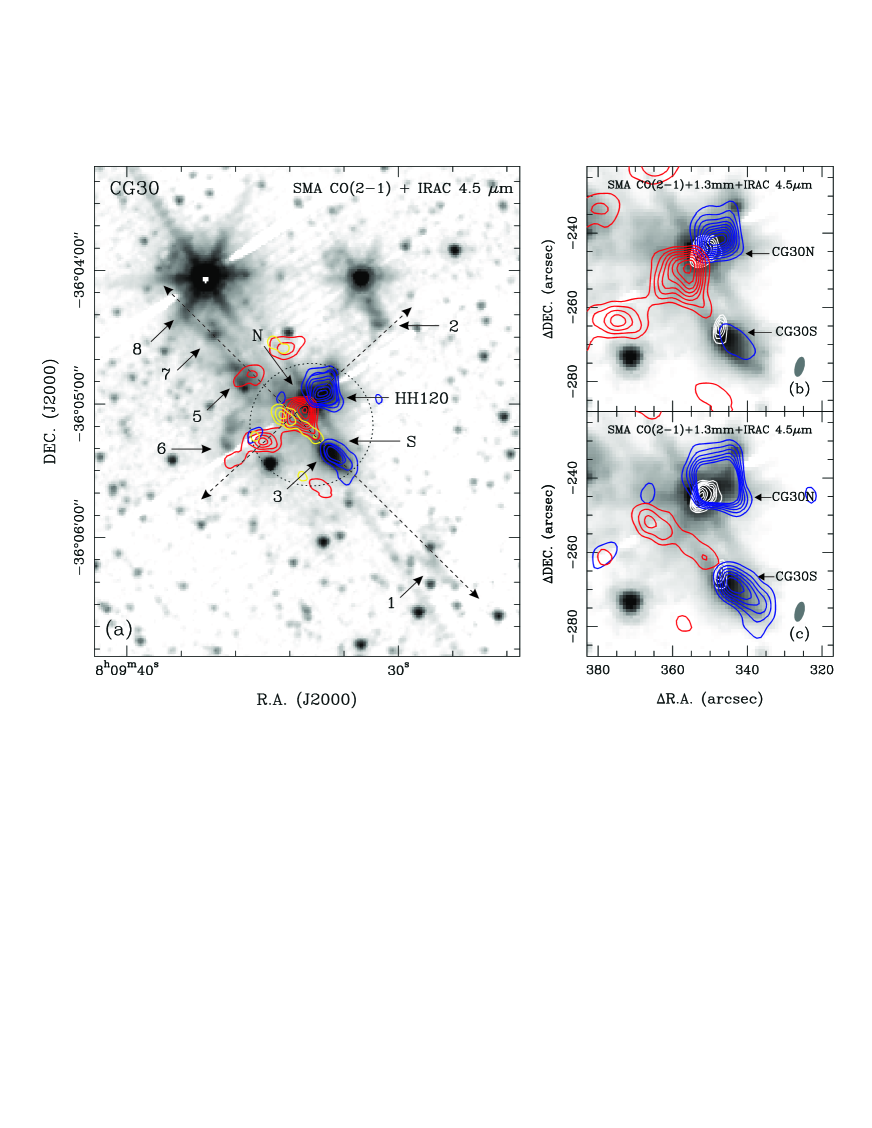
Figure 3 shows the integrated intensity maps of the CO (2–1) emission, plotted on the IRAC band 2 (4.5 m) image. Two separated bipolar outflows, with projected lengths of 27,000 AU (northern pair) and 20,000 AU (southern pair), are clearly seen in the images. The position angles (P.A., measured with respect to the red lobe) are 1285∘ for the northern pair and 573∘ for the southern pair, i.e., the two bipolar outflows are nearly perpendicular to each other. In the northern bipolar outflow, the blueshifted lobe is leaf-shaped and spatially coincident with the Herbig-Haro (HH) object HH 120 (see Fig 3b), while the redshifted lobe is double-peaked and pointing to the H2 knot No. 6 (Hodapp & Ladd 1995). H2 knot No. 2, located to the northwest of the blueshifted lobe, is also likely to be associated with the CG 30N outflow. Centered at CG 30S is a highly collimated bipolar jet seen in the IRAC 4.5 m image. The bipolar CO outflow driven by CG 30S is spatially coincident with this jet and also shows a collimated morphology, in particular the redshifted lobe (length to width ratio is 4). Its blueshifted lobe is spatially coincident with the near-infrared emission (knot No. 3), with the dust continuum source being located at the apex of both the CO and infrared emissions (Fig. 3c). This is consistent with our suggestion in Paper I that the infrared emission at CG 30S is due to scattered light in a cavity evacuated by the jet/outflow.
4 DISCUSSION
4.1 Outflow Physical Parameters
Thanks to the versatility of the SMA correlator, the 13CO (2–1) line was observed simultaneously with the 12CO (2–1) line towards CG 30, which allows us to estimate the outflow mass. For source CG 30N, the 13CO (2–1) blueshifted emission is detected at velocities from 2 to 3 km s-1, while redshifted emission is from 8 to 12 km s-1; For source CG 30S, however, no 13CO (2–1) outflow gas is found, although weak emission is detected around systemic velocity. The outflow masses are then calculated following Cabrit & Bertout (1990): for the southern bipolar outflow, as well as high-velocity component of the northern pair where 13CO (2–1) is not detected, the 12CO (2–1) emission is assumed to be optically thin, and the mass is calculated at each channel where outflow emission is detected, and then summed; for the low-velocity component of the northern pair, a correction for line opacity is performed at velocities where both the 12CO/13CO (2–1) emissions are detected. In the calculations, we assume LTE conditions, an excitation temperature of 20 K, an abundance ratio of [H2]/[13CO] equal to 8.9 105 (Cabrit & Bertout 1992), and an isotopic ratio of [12CO]/[13CO] = 71 (Wilson & Rood 1994). No correction for inclination effects was applied in the calculations.
The derived outflow masses, as well as other outflow properties (i.e., momentum , energy , mass-loss rate out, force , and mechanical luminosity ), are listed in Table 2. A simple comparison between the two bipolar outflows shows that the northern pair, driven by the higher (circumstellar envelope) mass source CG 30N, is much stronger than the southern pair ( 9 times in mass and 3 times in energy). The outflow parameters derived in CG 30 are relatively small in comparison with the general range of such parameters for sources of similar mass (see Wu et al. 2004). Nevertheless, we want to mention that the parameters in Table 2 only refer to the compact outflows detected in the SMA maps. The nature of the “extended outflow” components is unclear yet and requires confirmation by combining the SMA data with single-dish data to recover extended missing flux. Therefore, these parameters represent lower limits. Furthermore, as suggested by the two larger-scale jets, mosaicked CO observations are probably needed to fully map the two outflows.
4.2 Binarity v.s. Quadrupolar Outflows
The two bipolar outflows found in CG 30 resemble a combined quadrupolar morphology. A similar outflow morphology was also found in several other (low-mass) sources, like e.g., IRAS 16293–2422 (Mizuno et al. 1990), HH 288 (Gueth et al. 2001), and L 723 (Lee et al. 2002 and references therein). It is important to note that in all these sources protobinary systems have been discovered by high-resolution interferometric observations (IRAS 16293, Mundy et al. 1992; HH 288, Gueth et al. 2001; L 723, Launhardt 2004). This strongly supports the hypothesis that many quadrupolar outflows444Quadrupolar outflows are sources in which four outflow lobes are observed and seem to be driven by the same protostellar core (seen in current mm single-dish telescopes). are actually two independent outflows driven by a binary system (Anglada et al. 1991), although several other scenarios have been proposed (see Arce et al. 2007). Furthermore, assuming that binary systems are formed through the fragmentation of collapsing protostellar cores (see Goodwin et al. 2007), these quadrupolar outflows demonstrate that the disks in (wide) binary systems are not necessarily co-aligned after fragmentation.
On the other hand, if binarity among protostars occurs as frequently as among pre-main sequence stars, one would expect to find many quadrupolar/multipolar protostellar outflows. Such kind of outflows are however rare in our observations. One possible reason is that protostellar disks (jets) are preferentially aligned during fragmentation, and they may then drive one common large-scale outflow. An example is the source HH 30 (see Guilloteau et al. 2008 and references therein). At the same time, the outflow strength of protostars is proportional to the circumstellar envelope mass (Bontemps et al. 1996). Since binary protostars appear to have very unequal circumstellar masses (Launhardt 2004), their relative outflow strengths are expected to be also very unequal. Therefore, another possible reason is that the weaker outflow may often not be detected with current single-dish telescopes that do not have sufficient angular resolution and sensitivity. The discovery of an equal-mass protobinary system in L 723 (Launhardt 2004) and IRAS 16293 (Mundy et al. 1992) and of a weak secondary outflow from the lower-mass component in the unequal-mass protobinary systems CG 30 (this work), CB 230 (Launhardt 2004), and BHR 71 (Bourke 2001, Parise et al. 2006) supports this explanation. However, high-resolution outflow data so far exist only for very few systems, and it is unclear yet why multipolar protostellar outflows are so rare in our observations.
References
- Anglada et al. (1991) Anglada, G., Estalella, R., & Rodriguez, L. F., et al. 1991, ApJ, 376, 615
- Arce et al. (2007) Arce, H. G., Shepherd, D., & Gueth, F., et al. 2007, in Protostars and Planets V, ed. B. Reipurth, D. Jewitt, & K. Keil (Tucson: Univ. Arizona Press), 246
- Bourke (2001) Bourke, T. L. 2001, ApJ, 554, L91
- Bourke et al. (1995) Bourke, T. L., Hyland, A. R., & Robinson, G. 1995, MNRAS, 276, 1052
- Bontemps et al. (1996) Bontemps, S., André, P., Terebey, S., & Cabrit, S. 1996, A&A, 311, 858
- Cabrit & Bertout (1990) Cabrit, S., & Bertout, C. 1990, ApJ, 348, 530
- Cabrit & Bertout (1992) Cabrit, S., & Bertout, C. 1992, A&A, 261, 276
- Chen et al. (2007) Chen, X. P., Launhardt, R., & Henning, Th. 2007, ApJ, 669, 1058
- Chen et al. (2008) Chen, X. P., Launhardt, R., & Bourke, L. T. et al. 2008, ApJ, 683, 862 (Paper I)
- Draine & Lee (1984) Draine, B. T., & Lee, H. M. 1984, ApJ, 285, 89
- Garay et al. (2002) Garay, G., Mardones, D., Rodríguez, et al. 2002, ApJ, 567, 980
- Goodwin et al. (2007) Goodwin, S., Kroupa, P., Goodman, A., & Burkert A. 2007, in Protostars and Planets V, ed. B. Reipurth, D. Jewitt, & K. Keil (Tucson: Univ. Arizona Press), 133
- Gueth et al. (2001) Gueth, F., Schlike, P., & McCaughrean, M. J. 2001, A&A, 375, 1018
- Guilloteau et al. (2008) Guilloteau, S., Dutrey, A., Pety, J., & Gueth, F. 2008, A&A, 478L, 31
- Hartley et al. (1986) Hartley, M., Manchester, R. N., & Smith, R. M., et al. 1986, A&AS, 63, 27
- Henning et al. (2001) Henning, Th., Wolf, S., Launhardt, R., & Waters, R. 2001, ApJ, 561, 871
- Ho et al. (2004) Ho, P. T. P., Moran, J. M., & Lo, K. Y. 2004, ApJ, 616, L1
- Hodapp & Ladd (1995) Hodapp, K.-W., & Ladd, E. F. 1995, ApJ, 453, 715
- Launhardt (2004) Launhardt, R. 2004, in IAU Symp. 221, Star Formation at High Angular Resolution, ed. M. G. Burton, R. Jayawardhana, & T. L. Bourke (San Francisco: ASP), 213
- Launhardt & Henning (1997) Launhardt, R., & Henning, Th. 1997, A&A, 326, 329
- Lee et al. (2002) Lee, C.-F., Mundy, L. G., Stone, J. M., Ostriker, E. C. 2002, ApJ, 576, 294
- Looney et al. (2000) Looney, L. W., Mundy, L. G., & Welch, W. J. 2000, ApJ, 529, 477
- Mizuno et al. (1990) Mizuno, A., Fukui, Y., Iwata, T., Nozawa, S., & Takano, T. 1990, ApJ, 356, 184
- Mundy et al. (1992) Mundy, L. G., Wootten, A., Wilking, B. A., Blake, G. A., & Sargent, A. I. 1992, ApJ, 385, 306
- Nielsen et al. (1998) Nielsen, A. S., Olberg, M., Knude, J., & Booth, R. S. 1998, A&A, 336, 329
- Ossenkopf & Henning (1994) Ossenkopf, V., & Henning, Th. 1994, A&A, 291, 943
- Parise et al. (2006) Parise, B., Belloche, A., & Leurini, S. et al. 2006, A&A, 454, L79
- Qi (2005) Qi, C. 2005, MIR Cookbook (Cambridge: Harvard), http://cfa-www.harvard.edu/ cqi/mircook.html
- Reipurth (1983) Reipurth, B. 1983, A&A, 117, 183
- Sault et al. (1995) Sault, R. J., Teuben, P. J., & Wright, M. C. H. 1995, in ASP Conf. Ser. 77, Astronomical Data Analysis Software and Systems IV, ed. R. A. Shaw, H. E. Payne, & J. J. E. Hayes (San Francisco: ASP), 443
- Wilson & Rood (1994) Wilson, T. L., & Rood, R. T. 1994, ARA&A, 31, 191
- Wu et al. (2004) Wu, Y., Wei, Y., & Zhao, M. et al. 2004, A&A, 426, 503
| Source | a | FWHM sizesa | b | |
|---|---|---|---|---|
| [mJy] | maj.min. | P.A. | [] | |
| CG 30N | 25651 | 3418 | 865° | 1.40.3 |
| CG 30S | 9920 | 5523 | 117° | 0.60.1 |
| Massa | Momentuma | Energya | outb | Forceb | Luminosityb | |
|---|---|---|---|---|---|---|
| Component | [10-3 ] | [ km s-1] | [1043 ergs] | [10-6 yr-1] | [10-5 km s-1 yr-1] | [] |
| CG 30N blue | 17.4 | 0.19 | 3.1 | 7.3 | 8.1 | 0.11 |
| red | 37.9 | 0.48 | 8.7 | 16 | 19.8 | 0.30 |
| CG 30S blue | 3.6 | 0.047 | 0.6 | 2.1 | 2.7 | 0.03 |
| red | 2.3 | 0.095 | 4.0 | 1.3 | 5.6 | 0.19 |