High-Redshift Starbursting Dwarf Galaxies Revealed by -ray Burst Afterglows1,2
Abstract
We present a study of 15 long-duration -ray burst (GRB) host galaxies at . The GRBs are selected with available early-time afterglow spectra in order to compare interstellar medium (ISM) absorption-line properties with stellar properties of the host galaxies. In addition to five previously studied hosts, we consider new detections for the host galaxies of GRB 050820 and GRB 060206 and place 2- upper limits to the luminosities of the remaining unidentified hosts. We examine the nature of the host galaxy population and find that (1) the UV luminosity distribution of GRB host galaxies is consistent with expectations from a UV luminosity weighted random galaxy population with a median luminosity of ; (2) there exists a moderate correlation between UV luminosity and Si II absorption width, which together with the observed large line widths of Å for a large fraction of the objects suggests a galactic outflow driven velocity field in the host galaxies; (3) there is tentative evidence for a trend of declining ISM metallicity with decreasing galaxy luminosity in the star-forming galaxy population at ; (4) the interstellar UV radiation field is found higher in GRB hosts than the Galactic mean value; and (5) additional galaxies are found at from the GRB host in all fields with known presence of strong Mg II absorbers, but no additional faint galaxies are found at in fields without strong Mg II absorbers. Our study confirms that the GRB host galaxies (with known optical afterglows) are representative of unobscured star-forming galaxies at , and demonstrates that high spatial resolution images are necessary for an accurate identification of GRB host galaxies in the presence of strong intervening absorbers.
Subject headings:
gamma rays: bursts—ISM: abundances—ISM: kinematics—intergalactic medium1. INTRODUCTION
Gamma-ray bursts (GRBs) are among the most energetic events in the universe. In particular, long-duration GRBs are believed to originate in the catastrophic death of massive stars (e.g. Woosley 1993; Paczyński 1998; Bloom et al. 2002; Stanek et al. 2003; Hjorth et al. 2003; see Woosley & Bloom 2006 for a recent review). Since massive stars evolve rapidly, long-duration GRBs should probe instantaneous star formation out to the highest redshifts (e.g. Wijers et al. 1998) with the afterglows serving as signposts to starburst galaxies in the distant universe.
Many bursts are followed by optical afterglows that can briefly exceed the absolute brightness of any known quasar by orders of magnitude (e.g. Akerlof et al. 1999; Kann et al. 2007; Bloom et al. 2008) and serve as bright background sources for probing intervening gas along the line of sight. Early-time, high-resolution spectroscopy of GRB afterglows have revealed numerous absorption features produced by ground-state and excited-state ions in the interstellar medium (ISM) of the host galaxies (e.g. Vreeswijk et al. 2004; Prochaska, Chen, & Bloom 2006; Vreeswijk et al. 2007; D’Elia et al. 2008). Detailed studies based on comparisons of absorption-line strengths have yielded accurate constraints on the host ISM properties, including gas density, temperature, chemical composition, and kinematics of the GRB host environment (e.g. Fynbo et al. 2006; Savaglio 2006; Prochaska et al. 2007a). Specifically, roughly 50% of known GRBs at are found in ISM of neutral gas column density (Jakobsson et al. 2006; Chen et al. 2007a). In addition, the host ISM generally exhibit moderate chemical enrichment with a median metallicity of solar, although with a substantial scatter over the range from to solar values (Fynbo et al. 2006a; Savaglio 2006; Prochaska et al. 2007a). Comparisons of different ionic abundances also show that there exists a large differential depletion with dex and dex, confirming the presence of a large amount of gas mass and a chemical enrichment history dominated by massive stars (Savaglio 2006; Prochaska et al. 2007a). Finally, there is a lack of molecular gas despite the presence of a large (Fynbo et al. 2006; Tumlinson et al. 2007).
Interpretations of these absorption-line data are not straightforward. In particular, the observed low-metal content in the GRB host ISM, as opposed to optically selected luminous starburst galaxies (e.g. Shapley et al. 2004), can be explained if the progenitor stars originate in the outskirts of a luminous galaxy or if the host galaxies are underluminous and have on average lower metallicities. A local-galaxy analogue of this is seen with the so-called luminosity–metallicity relation (e,g. Tremonti et al. 2004 for nearby galaxies). Recently, Fynbo et al. (2008) considered both scenarios and showed that the metallicity distribution of GRB hosts is consistent with the expectation that these host galaxies represent a weighted star-forming galaxy population according to the on-going star formation rate (SFR). In addition, the large atomic gas column density in contrast to the lack of molecular gas may be due to either an enhanced UV radiation field in the star-forming regions near the GRB progenitor or a relatively low dust and metal content indicated in the absorption-line data (e.g. Tumlinson et al. 2007; Whalen et al. 2008). Recent detections of the 2175-Å dust absorption feature in GRBs 070802 (Krühler et al. 2008; Eliasdottir et al. 2008) and 080805 (Jakobsson et al. 2008) offer an important test for this scenario. Regardless, these issues have direct impact on our understanding of both the GRB progenitors and star formation physics. Supplemental imaging and spectroscopic observations of the host galaxies are necessary for accurate interpretations of the absorption-line measurements.
The transient nature of optical afterglows allows deep imaging and spectroscopic studies of galaxies close to the lines of sight, including the hosts, when the afterglows disappear (c.f. Møller et al. 2002a; Chen & Lanzetta 2003 for searches of damped absorbing galaxies along quasar sightlines). At , where accurate ISM abundance measurements are available based on afterglow absorption-line spectroscopy, only four host galaxies have been unambiguously identified (see Savaglio et al. 2008 for a compilation). Comparison studies between known ISM properties from afterglow absorption spectroscopy and the observed morphology and luminosity of the host galaxies have been published individually for GRB 000926 (Castro et al. 2003), GRB 011211 (Vreeswijk et al. 2006), GRB 021004 (Fynbo et al. 2005), and GRB 030323 (Vreeswijk et al. 2004). The four GRB host galaxies together show an order-of-magnitude scatter in their rest-frame UV luminosity and ISM metallicity.
At , where the majority of common ISM absorption features occur at ultraviolet wavelengths and spectroscopic observations become challenging on the ground, GRB host galaxies have been identified in late-time imaging follow-up. These known host galaxies provide important insights for understanding the nature of GRB progenitors at intermediate redshifts. First, Chary et al. (2002) compared the estimated SFR and total stellar mass for 12 GRB host galaxies and found that the host galaxies have on average higher SFR per unit stellar mass than local starburst galaxies. Le Floc’h et al. (2003) examined the optical and near-infrared colors and rest-frame -band luminosity function of 15 GRB host galaxies at . They found that these host galaxies have on average bluer colors and fainter luminosity () than random star-forming galaxies at the same redshift range. Additional mid-infrared imaging observations by these authors showed that this is not due to dust extinction (Le Floc’h et al. 2006). Similarly, Christensen et al. (2004) studied the optical and near-infrared spectral energy distributions (SEDs) of ten GRB host galaxies at . They found based on a comparison with galaxies identified at a similar redshift range in the Hubble Deep Fields that GRB host galaxies have on average younger stellar age and shorter characteristic star-forming time scale. In addition, Fruchter et al. (2006) compared HST images of GRB host galaxies at with the host galaxies of core-collapse supernovae (SNe). They found that the majority of GRB host galaxies exhibit irregular morphology, unlike the host galaxies of core-collapse SNe. Recently, independent studies by Castro Cerón et al. (2008) and Savaglio et al. (2008) show that GRB host galaxies contain on average lower stellar mass than field star-forming galaxies. Together, these results show that GRB host galaxies at represent a relatively young dwarf population that have experienced recent on-going star-forming episodes.
While GRB host galaxies based on the intermediate-redshift sample appear to be underluminous and low mass systems, it is not clear whether the long-duration GRBs originate preferentially in relatively metal dificient star-forming regions (c.f. Wolf & Podsiadlowski 2007; Modjaz et al. 2008). A low-metallicity environment is favored by popular progenitor models so that the progenitor star can preserve high spin and a massive stellar core to produce a GRB (e.g. Hirschi et al. 2005; Yoon & Langer 2005; Woosley & Heger 2006). Chemical abundance measurements for galaxies have been based primarily on emission line observations of associated H II regions. A subset of the host galaxies at have been followed up spectroscopically for measuring emission-line fluxes. A mean metallicity of roughly solar is found but with a large scatter (e.g. Sollerman et al. 2005; Modjaz et al. 2008; Savaglio et al. 2008). The accuracy of emission-line-based abundance estimates depends sensitively on the accuracy of the calibrations between different line diagnostics (e.g. Kewly & Dopita 2002; Skillman et al. 2003; Kennicutt et al. 2003). Whether or not there exists a maximum metallicity for forming a GRB remains an open question.
We have carried out an optical and near-infrared imaging survey of fields around 15 GRBs at . The GRBs are selected to have early-time afterglow spectra in order to compare ISM absorption-line properties with stellar properties. The goal is to identify the host galaxies and constrain their rest-frame UV and optical luminosities. The primary objectives are (1) to quantify the luminosity distribution of the GRB host galaxy populations and investigate whether or not the GRB host galaxies trace the typical star-forming galaxies at high redshift and (2) to examine whether there exists a correlation between the ISM metal content and host luminosity. The starburst nature of GRB hosts makes this galaxy sample a unique laboratory for studying star formation physics and stellar feedback at high redshift. We adopt a CDM cosmology, and , with a dimensionless Hubble constant throughout the paper.
2. The GRB SAMPLE
| Field | RA(J2000) | Dec(J2000) | Referencesaa(1): Vreeswijk et al. (2006); (2) Hjorth et al. (2003); (3) Vreeswijk et al. (2004); (4) Jakobsson et al. (2004); (5) Watson et al. (2006); (6) Chen et al. (2005); (7) Prochaska et al. (2007); (8) Fynbo, private communication; (9) Fynbo et al. (2006); (10) Chen et al. (2007), see also § 4.11; (11) Malesani et al. (2007); (12) Jensen et al. (2001); (13) Fynbo et al. (2002); (14) Fynbo et al. (2005), but see § 4.13 for discussion. | Instrument | Filter | EXPTIME (s) | FWHM (′′) | ||
|---|---|---|---|---|---|---|---|---|---|
| GRB 011211 | 11:15:17.98 | 21:56:56.2 | 2.140 | (1) | HST/STISbbThe imaging data were retrieved from the HST data archive; PID . The host galaxy was clearly detected in these images that have been analyzed and published in Jakobsson et al. (2003). | Clear | 19544 | 0.1 | |
| Magellan/PANIC | 12960 | 0.4 | |||||||
| GRB 020124 | 09:32:50.81 | 11:31:10.6 | 3.198 | (2) | HST/STISccThe imaging data were retrieved from the HST data archive; PID . A detailed analysis of these space images is published in Berger et al. (2002). No emission from the host galaxy was found. | Clear | 24798 | 0.1 | |
| Magellan/PANIC | 13860 | 0.4 | |||||||
| GRB 030323 | 11:06:09.38 | 21:46:13.3 | 3.372 | (3) | HST/ACS/WFCddThe imaging data were retrieved from the HST data archive; PID . The host galaxy was found in the first-epoch images (exptime 1920 s), which have been analyzed and published by Vreeswijk et al. (2004). | F606W | 5928 | 0.1 | |
| Magellan/PANIC | 14400 | 0.4 | |||||||
| GRB 030429 | 12:13:07.50 | 20:54:49.7 | 2.658 | (4) | Magellan/PANIC | 7740 | 0.4 | ||
| GRB 050401 | 16:31:28.81 | 02:11:14.2 | 2.899 | (5) | Magellan/PANIC | 6300 | 0.6 | ||
| Keck/LRIS | 2540 | 1.1 | |||||||
| Keck/LRIS | 2460 | 1.0 | |||||||
| GRB 050730 | 14:08:17.13 | 03:46:16.7 | 3.968 | (6) | Magellan/MagIC | 2700 | 0.6 | ||
| Keck/LRIS | 3900 | 1.2 | |||||||
| Keck/LRIS | 3900 | 1.0 | |||||||
| GRB 050820A | 22:29:38.11 | 19:33:37.1 | 2.615 | (7) | HST/ACS/WFCeeThe imaging data were retrieved from the HST data archive; PID . | F625W | 2238 | 0.1 | |
| HST/ACS/WFC | F775W | 4404 | 0.1 | ||||||
| HST/ACS/WFC | F850LP | 14280 | 0.1 | ||||||
| Magellan/PANIC | 8460 | 0.6 | |||||||
| Keck/LRIS | 2620 | 0.7 | |||||||
| Keck/LRIS | 2500 | 1.9 | |||||||
| GRB 050908 | 01:21:50.75 | 12:57:17.2 | 3.343 | (8) | Magellan/PANIC | 12150 | 0.5 | ||
| GRB 050922C | 21:09:33.08 | 08:45:30.2 | 2.199 | (7) | Magellan/PANIC | 12560 | 0.5 | ||
| Keck/LRIS | 3870 | 1.2 | |||||||
| Keck/LRIS | 3660 | 1.0 | |||||||
| GRB 060206 | 13:31:43.42 | 35:03:03.6 | 4.048 | (9) | HST/ACS/WFCffThe imaging data were obtained through our own program before ACS failed; PID . | F814W | 9886 | 0.1 | |
| GRB 060607 | 21:58:50.40 | 22:29:46.7 | 3.075 | (10) | Magellan/PANIC | 18540 | 0.5 | ||
| Keck/LRIS | 2550 | 1.0 | |||||||
| Keck/LRIS | 2430 | 1.5 | |||||||
| GRB 070721B | 02:12:32.97 | 02:11:40.4 | 3.626 | (11) | Magellan/PANIC | 10320 | 0.5 | ||
| Previously Published Fields | |||||||||
| GRB 000301C | 16:20:18.60 | 29:26:36.0 | 2.040 | (12) | HST/STISggThe imaging data were retrieved from the HST data archive; PID . The host galaxy was marginally detected in these images that have been analyzed and published in Fruchter et al. (2006). | Clear | 16422 | 0.1 | |
| GRB 000926 | 17:04:09.62 | 51:47:11.2 | 2.038 | (13) | Castro et al. (2003) | ||||
| GRB 021004 | 00:26:54.68 | 18:55:41.6 | 2.329 | (14) | Fynbo et al. (2005) | ||||
We generated a sample of 15 GRBs at for studying the nature of high-redshift GRB host galaxies and for comparing the host properties with those of field galaxies in deep surveys. The GRBs were selected to have early-time, moderate-to-high resolution afterglow spectra available for measuring the underlying neutral hydrogen column density. In addition, eight of the GRBs have sufficiently high-spectral resolution for constraining the chemical abundances of the host ISM. Only five of these fields have late-time images published in the literature. To identify the stellar counterpart of the host galaxies, we have carried out a near-infrared imaging survey of these fields using PANIC (Martini et al. 2004) and the filter on the Magellan Baade telescope on Las Campanas, Chile. In addition, we have obtained and analyzed late-time deep optical images available for some of these GRB fields from either our own observations using the Advance Camera for Surveys (ACS; Ford et al. 1998) or unpublished data found in the Hubble Space Telescope (HST) data archive111http://archive.stsci.edu/hst/.. A summary of the fields is presented in Table 1, where we list the GRBs, their coordinates, redshift, and inferred neutral hydrogen column density, , in columns (1) through (5). The corresponding references for the redshift and measurements are listed in column (6).
This GRB host sample presented here is the largest sample of GRBs at for which both ISM absorption properties and constraints on the emission properties of the host galaxies are available. It offers a unique opportunity to carry out a systematic study to understand the nature of starburst galaxies hosting GRBs at high redshift. The redshifts of the GRBs in our sample span a range from to (left panel of Figure 1). The neutral hydrogen column densities of the GRB host ISM span a range from to (right panel of Figure 1). The sample size is restricted by the amount of available observing time. In comparison to GRBs with known redshift or in the literature, we show in Figure 1 that our sample is representative of the spectroscopically identified GRB population in the redshift and parameter space. Note that three of the 15 known GRB host absorbers do not contain high () that would qualify them as a damped absorber (e.g. Wolfe et al. 2005). The observed low indicates that the ISM in front of these GRBs is mostly ionized.


3. IMAGING OBSERVATIONS AND DATA ANALYSIS
To constrain the star formation and/or stellar population of the host galaxies, we have carried out an optical and near-infrared imaging survey of nine GRB fields that have not been studied before. We have also obtained new near-infrared images of the fields around GRB 011211 (previously studied by Jakobsson et al. 2003) and GRB 030323 (previously studied by Vreeswijk et al. 2004), and analyzed additional HST images of the field around GRB 030323 that were not included in Vreeswijk et al. (2004). At , near-infrared images offer valuable constraints for the intrinsic luminosity of the host galaxies at rest-frame optical wavelengths, while optical images provide constraints for their rest-frame UV luminosities. Here we describe relevant imaging observations and data processing.
3.1. Optical Images from the Hubble Space Telescope
High spatial resolution and high sensitivity optical images obtained using the Wide Field Channel (WFC) of Advance Camera for Surveys (ACS) on board the Hubble Space Telescope (HST) are available for GRBs 030323, 050820A, and 060206. The field surrounding GRB 030323 was observed under program ID 9405 (PI: Fruchter) using ACS/WFC and the F606W filter during July 2003 and December 2003. The observations were carried out in a sequence of four exposures of between 480 and 522 s each. The images were retrieved from the HST data archive. The field surrounding GRB 050820A was observed under program ID 10551 (PI: Kulkarni) using ACS/WFC and the F625W, F775W, and F850LP filters during September 2005 and June 2006. The observations were carried out in a sequence of two to four exposures of between 400 and 807 s each. The images were retrieved from the HST data archive. The field surrounding GRB 060206 was observed under our own program (PID=10817; PI: Chen) using ACS/WFC and the F814W filter during November and December 2006. The observations were carried out in the standard “ACS-WFC-DITHER-BOX” pattern of exposures between 1215 and 1256 s each.
Individual exposures were reduced using standard pipeline techniques, corrected for geometric distortion using drizzle, registered to a common origin, filtered for deviant pixels based on a rejection criterion, and combined to form a final stacked image. A summary of the optical imaging observations is presented in columns (7) through (10) of Table 1, which lists for each field the instrument and filter used, total exposure time, and the full width at half maximum (FWHM) of the median point spread function (PSF) as determined from point sources. We note that in addition to the GRBs listed in Table 1 we will include in the following analysis previous HST imaging observations of GRB 000926 () and GRB 021004 () published by Fynbo et al. (2002), Castro et al. (2003) and Fynbo et al. (2005), respectively.
3.2. Optical and Near-infrared Images from the Magellan and Keck Telescopes
Optical images of GRB 050730 were obtained using MagIC on the Magellan Baade telescope in June 2008. The observations were carried out in one set of three exposures, 900 s in duration. Dither offsets of 15′′ were applied between exposures. The sky condition was photometric with a mean seeing of 0.6′′. Individual exposures were first corrected for pixel-to-pixel variation using a flat-field image formed by median filtering sky images obtained during even twilight. Fringes are not apparent in the MagIC- images. Next,the processed individual images obtained on the same night were registered to a common origin, filtered for deviant pixels based on a rejection criterion and a bad pixel mask formed using the flat-field frames, and stacked according to a weighting factor that is proportional to the inverse of the sky variance. The photometric zero points were determined using five SDSS southern standard stars (Smith et al. 2002) observed during the night.
Optical and images of GRBs 050401, 050730, 050820A, 050922C, and 060607 were obtained using the Low Resolution Imaging Spectrometer (LRIS; Oke et al. 1995) on the the Keck I telescope in May and July of 2006. Integration times varied from source to source and are given in Table 1, but generally consisted of dithered exposures of about 600 s each and total integration times of 40 to 65 minutes per field. Individual exposures were reduced and combined using standard techniques. Photometric calibration was performed using a series of exposures on the Landolt field Markarian A at three different elevations during the July run and a single visit to the PG 2213 field during the May run. The observation conditions were photometric. Astrometry was performed using a large sample of USNO B1.0 standard stars in each field.
Near-infrared images of GRBs 011211, 030323, 050401, 050820A, and 050922c were obtained using PANIC on the Magellan Baade telescope in February 2004, May 2006, and August 2007. The observations were carried out in five or nine sets of three to four exposures, 45 to 60 s in duration. Dither offsets of eight to 15 arcsec were applied between different sets of exposures in a slanted square pattern.
Individual exposures were first corrected for pixel-to-pixel variation using a flat-field image formed by median filtering all the images obtained on the same night. Next, we corrected for geometric distortion in individual flat-field images using the IRAF geomap task, according to a 2D distortion map provided by the PANIC instrument team. Next,the processed individual images obtained on the same night were registered to a common origin, filtered for deviant pixels based on a rejection criterion and a bad pixel mask formed using the flat-field frames, and stacked according to a weighting factor that is proportional to the inverse of the sky variance. Images obtained during non-photometric nights were scaled to match the fluxes of common objects observed during photometric conditions. Individual stacked images from different nights were combined to form a final image of each field. The photometric zero points were determined using three to five IR standard stars (Persson et al. 1998) observed under photometric conditions. A summary of the near-infrared imaging observations is presented in Table 1.
3.3. Astrometry
An accurate astrometric solution is necessary for the images obtained at late times, in order to correctly identify the host galaxies of the GRBs. To obtain an accurate astrometric solution for each final stacked image, we first calibrate the astrometry using USNO stars with a low-order polynomial fit. Next, we refine the astrometric solution using 2MASS stars in the image by adjusting field offsets and rotation. We find that the final astrometric solution is accurate to am r.m.s. of 0.2′′.
4. DESCRIPTION OF INDIVIDUAL FIELDS
Including previously published images around GRBs 000301C, 000926 and 021004, we have now collected deep optical and/or near-infrared images surrounding 15 GRBs at . All of these GRBs have early-time afterglow spectra available that allow us to determine both the gas properties of the GRB host galaxies and the line-of-sight properties of absorbers foreground to the hosts. We will show that known line-of-sight properties from afterglow spectra are important for accurately identifying the GRB host galaxies (e.g. GRB 030429, GRB 060206, GRB 070721B, and see Pollack et al. 2008 for a rich galaxy field around GRB 060418). Here we describe contraints on the emission properties of individual host galaxies from available imaging data, together with a brief description of known absorption-line properties from afterglow spectroscopy. A summary of the emission and absorption properties of these GRB host galaxies is presented in Table 3.
4.1. GRB 011211 at
This burst was detected by BeppoSAX and the optical transient was found hours later with (Grav et al. 2001). Low-resolution ( km s-1) optical spectra of the afterglow were taken by different groups, which revealed multiple absorption features indicating a source redshift of (Fruchter et al. 2001; Gladders et al. 2001). Analyzing existing afterglow spectra obtained using FORS2 on the VLT telescopes, Vreeswijk et al. (2006) reported a total neutral hydrogen column density of . In addition, the authors applied a curve-of-growth (COG) analysis over a series of absorption features found in the afterglow spectra and derived and 222Chemical abundances are measured relative to solar values and defined as .. The large indicates that even the weakest absorption features detected in the afterglow spectrum may be saturated due to the low resolution and low of the data. Here we consider the abundance measurements based on the COG analysis lower limits to the intrisic ISM metallicity and adopt for the ISM of the host galaxy. However, we note that the absence of relatively weak transitions such as Si II in the afterglow spectrum indicates . Finally, this line of sight exhibits no Mg II absorbers of rest-frame absorption equivalent width Å between and (Prochter et al. 2006).
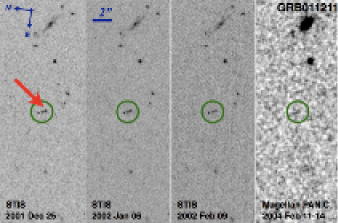
Imaging follow-up of the field around GRB 011211 was carried out during four different epochs with STIS and the clear filter on board HST. The imaging data were reduced and analyzed by Jakobsson et al. (2003), who reported the host galaxy has an -band magnitude of over a 1′′-diameter aperture. In addition, emission was detected in a ground-based narrow-band imaging survey by Fynbo et al. (2003a), who measured a total flux of erg s-1 cm-2 and derived an SFR of M⊙ yr-1.
We have observed this field using PANIC on Magellan in February 2004, and obtained a total integration of 216 minutes. The mean FWHM of the PSF was found to be based on an average of 10 stars across the PANIC field. The final stacked image is presented in Figure 2, together with HST STIS images obtained roughly 14, 26, and 32 days after the initial burst. The optical and images are registered to a common origin. The host galaxy is marked by a circle of 1′′ radius. The host appears to consist of three compact (presumably star-forming) regions in the STIS images, all of which are confirmed to be at the host redshift based on the presence of emission in the ground-based narrow-band images presented in Fynbo et al. (2003a). The GRB is found to originate in the faintest of the three blobs, southeast of the center one. Two of the compact regions are detected in the -band image, but the region directly associated with the burst does not exhibit any detectable flux. We measure an -band magnitude of over a 1′′ diameter aperture for the host galaxy.
At , the observed -band magnitude corresponds to a rest-frame absolute magnitude at 2000 Å of . The observed -band magnitude allows us to derive a rest-frame absolute -band magnitude of for the GRB host galaxy.
4.2. GRB 020124 at
This burst was detected by HETE (Ricker et al. 2002) and the optical transient was found hours later with (Price et al. 2002). Low-resolution ( km s-1) optical spectra of the afterglow were obtained using FORS1 on the VLT Melipal telescope, which revealed multiple absorption features indicating a source redshift of (Hjorth et al. 2003). The total neutral hydrogen column density derived based on the observed absorption line is (Hjorth et al. 2003). The low resolution and low () of the data did not allow an accurate measurement of the chemical content in the host ISM. No information is available for the line-of-sight properties of additional intervening absorbers.
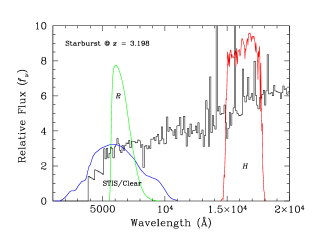
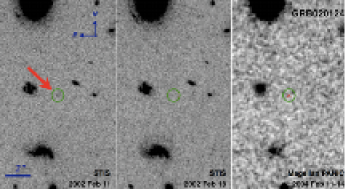
Imaging follow-up of the field around GRB 020124 was carried out roughly 18 and 21 days after the burst with STIS and the clear filter on board HST. The imaging data were reduced and analyzed by Berger et al. (2002). While the OT was detected in the first epoch image, no detectable flux was found at the OT position in the second epoch image. Berger et al. (2002) placed an upper limit for the -band magnitude of the host galaxy at . We have retrieved the imaging data from the HST archive and determined a 5- limit of the second epoch image at over a 0.5′′ diameter aperture. To derive the corresponding detection limit, we take into account the bandpass difference between STIS/clear and and the IGM opacity that reduces most of the light at Å for sources at (Figure 3). We apply a 0.4 mag offset in the photometric zero point and conclude that the host galaxy is fainter than at the 5- level of significance.
We have also observed this field using PANIC on Magellan in February 2004, and obtained a total integration of 231 minutes. The mean FWHM of the PSF was found to be . The final stacked image is presented in Figure 4, together with available HST STIS images. The optical and images are registered to a common origin. The -band image has been smoothed using a Gaussian kernel of . The position of the GRB is marked by a circle of 0.5′′radius. No detectable flux is found at the location of the GRB, but some emission features are observed with at angular distance away. We place a 2- limit in the observed -band magnitude of over a 0.5′′ diameter aperture for the host galaxy. At , the observed -band magnitude limit allows us to derive a limiting rest-frame absolute magnitude of for the GRB host galaxy.
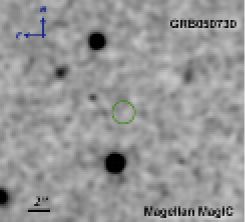
4.3. GRB 030323 at
This burst was detected by HETE-2 (Graziani et al. 2003) and the optical transient was found hours later with (Gilmore et al. 2003a). Moderate-resolution ( km s-1) optical spectra of the afterglow, covering Å, were taken using FORS2 on the VLT Yepun telescope by Vreeswijk et al. (2004), revealing multiple absorption features from ions in both ground states and excited states that are consistent with a source redshift of . These authors estimated the total neutral hydrogen column density of in the host ISM and chemical abudances of and . The observed large column densities of various ions suggest that these reported values represent only lower limits to the intrinsic abundances of these ions. We therefore adopt for the ISM of the host galaxy. This line of sight exhibits no strong Mg II absorbers at (Prochter et al. 2006).
Imaging follow-up of the field around GRB 030323 was carried out during two different epochs with ACS and the F606W filter on board HST. The first epoch imaging data with a total exposure time of 1920 s were reduced and analyzed by Vreeswijk et al. (2004), who identified the host galaxy at from the position of the OT and measured over a 0.3′′ diameter aperture. Additional imaging data were obtained five month later with HST using the same instrument setup. A stack of all available imaging data from the HST data archive shows a clear detection of the host galaxy at from the position of the OT. This position is consistent with the position of Vreeswijk et al. to within the astrometric uncertainties. After correcting for the Galactic extinction ( according to Schlegel et al. 1998), we measure a total flux of over a 0.5′′ diameter aperture.
We have also observed this field using PANIC on Magellan in February 2004, and obtained a total integration of 240 minutes. The mean FWHM of the PSF was found to be . The final stacked image is presented in Figure 5, together with a stack of available ACS/F606W images. The optical and images are registered to a common origin. The host galaxy is marked by a circle of 0.5′′ radius. The host appears to be extended in the ACS image, but not detected in the stacked image. We place a 2- limit in the observed -band magnitude of over a 0.5′′ diameter aperture for the host galaxy.
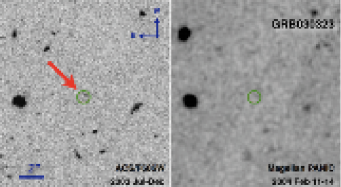
At , the observed F606W magnitude corresponds to for the GRB host galaxy. The observed -band magnitude limit allows us to derive a limiting rest-frame absolute magnitude of for the GRB host galaxy.
4.4. GRB 030429 at
This burst was detected by HETE-2 (Doty et al. 2003) and the optical transient was found hours later (Gilmore et al. 2003b) at southeast of an extended source of (Fynbo et al. 2003b). Low-resolution ( km s-1) optical spectra of the afterglow and the extended source were obtained using FORS1 on the VLT Melipal telescope. The spectrum of the afterglow exhibits multiple absorption features that are consistent with (Jakobsson et al. 2004). In contrast, the spectrum of the extended source exhibits a single emission feature at Å. Jakobsson et al. (2004) identified this emission as [O II] at , which is supported by the presence of an absorption feature in the afterglow spectrum if interpreted as a Mg II absorber at . The GRB host galaxy therefore remains unidentified. These authors also reported a total neutral hydrogen column density of based on the observed absorption feature. The low resolution of the spectrum did not allow an accurate measurement of the chemical content in the host ISM.
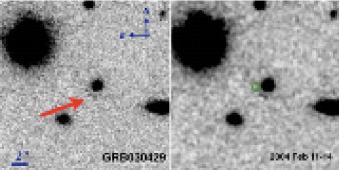
We have observed the field around GRB 030429 using PANIC on Magellan in February 2004, and obtained a total integration of 129 minutes. The mean FWHM of the PSF was found to be . The final stacked image is presented in Figure 6, together with a smoothed version with a Gaussian kernel of . The position of the GRB is marked by a circle of 0.5′′radius. No detectable flux is found at the immediate location of the GRB, but additional emission features are present at southwest of the OT, or 1.3′′ south of the galaxy at . We measure for the foreground galaxy, and for the host candidate.
The emission morphology resembles those found for the hosts of GRB 000926 and GRB 011211, with the OT originating in the faintest of the three emission blobs. The close proximity to the foreground galaxy suggests that the host may be gravitationally lensed by this foreground object, although the large angular separation implies that the foreground galaxy would have to be as massive as the Milky Way (see also Jakobsson et al. 2004). Additional images at optical wavelengths are necessary to investigate this lensing hypothesis further.
If the extended feature is associated with the host galaxy, then the OT would be at a projected distance of kpc from the center of the galaxy. In the following discussion, we consider the observed brightness as an upper limit to the brightness of the GRB host and derive a rest-frame -band magnitude of for the GRB host galaxy.
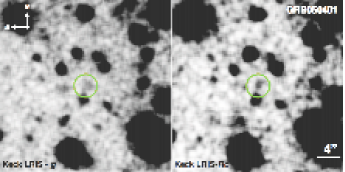
4.5. GRB 050401 at
This burst was detected by Swift (Barbier et al. 2005) and prompt localization of the source was reported by Angelini et al. (2005) from the X-ray afterglow. The optical transient was found hour later with (McNaught & Price 2005). Low-resolution ( km s-1) optical spectra of the afterglow were taken using FORS2 on the VLT Antu telescope (Watson et al. 2006), revealing multiple absorption features from ions in both ground states and excited states that are consistent with a source redshift of . Watson et al. (2006) estimated the total neutral hydrogen column density of in the host ISM and metallicity of . Similiar to the other GRB hosts where only low-resolution afterglow spectra are available, the observed large column densities of various ions suggest that these reported values represent only lower limits to the intrinsic abundances of these ions. We therefore adopt for the ISM of the host galaxy. An additional set of ionic transitions (such as Al II and Fe II) was also reported at by Watson et al. (2006).
We have observed the field around GRB 050401 using PANIC on Magellan in May 2006, and obtained a total integration of 105 minutes. The mean FWHM of the PSF was found to be . No detectable flux is seen at the immediate location of the GRB. We place a 2- limit in the observed -band magnitude of over a 1′′ diameter aperture for the host galaxy. At , the observed -band magnitude limit allows us to derive a limiting rest-frame absolute magnitude of for the GRB host galaxy.
Optical images of the field around GRB 050401 have also been obtained using LRIS and the and filters on the Keck I telescope in May 2006. The mean FWHM of the PSF was found to be in the combined image and in the combined image. The stacked images are presented in Figure 7, which have been smoothed with a Gaussian kernel of . The position of the GRB is marked by a circle of 2′′ radius. At the location of the afterglow reported by (McNaught & Price 2005), we detect faint emission in both images at roughly 2- significance level. We estimate a total brightness of and over a 2′′ diameter aperture for the object. Due to the presence of a strong absorber at , the identification of the observed faint emission is uncertain. We note, however, that at the IGM forest is expected to absorb a large fraction of flux in the band, resulting in mag for a flat spectrum source. Additional HST imaging data are necessary to confirm the host identification. At , the observed -band magnitude would imply a rest-frame absolute magnitude of for the candidate host galaxy.
4.6. GRB 050730 at
This burst was detected by Swift (Holland et al. 2005). An optical transient was found promptly using the Ultraviolet-Optical Telescope (UVOT) on board Swift with about three minutes after the burst trigger (Holland et al. 2005). We obtained an echelle spectrum of the afterglow, using the MIKE spectrograph (Bernstein et al. 2003) on the Magellan Clay telescope, four hours after the initial trigger. Descriptions of the data were presented in Chen et al. (2005) and Prochaska et al. (2007b). The spectrum covers a full spectral range from 3300 Å through 9400 Å with a spectral resolution of km s-1 at wavelength Å and km s-1 at Å. The host of the GRB exhibits a strong damped absorption feature with , and metallicity and (see also Starling et al. 2005; D’Elia et al. 2007). The low metallicity and low -element enhancement implies a nearly dust free medium. No trace of H2 is found despite the large . The high-resolution, high echelle data allow us to place a sensitive limit on the molecular fraction of the host ISM at (Tumlinson et al. 2007). Additional strong absorbers are found at , , , and (Chen et al. 2005).
We have observed the field around GRB 070530 using MagIC and the filter on Magellan in June 2008, and obtained a total integration of 45 minutes. The mean FWHM of the PSF was found to be . The final stacked image is presented in Figure 8, which has been smoothed using a Gaussian kernel of . The position of the GRB is marked by a circle of 1′′ radius. No detectable flux is seen at the immediate location of the GRB. We place a 2- limit in the observed -band magnitude of over a 1′′ diameter aperture for the host galaxy. At , observed -band magnitude limit allows us to derive a limiting rest-frame absolute magnitude of for the GRB host galaxy.
Optical images of the field around GRB 050730 have also been obtained using LRIS and the and filters on the Keck I telescope in May 2006. The mean FWHM of the PSF was found to be in the combined image and in the combined image. No detectable flux is seen at the immediate location of the GRB. We place 2- limits of and over a 2′′ diameter aperture for the host galaxy. Taking into account that at the IGM forest and the large amount of neutral gas in the host ISM absorb a large fraction of flux in the and bands, we find that the flux limits derived from the LRIS images are consistent with the flux limit seen in the MagIC -band data.
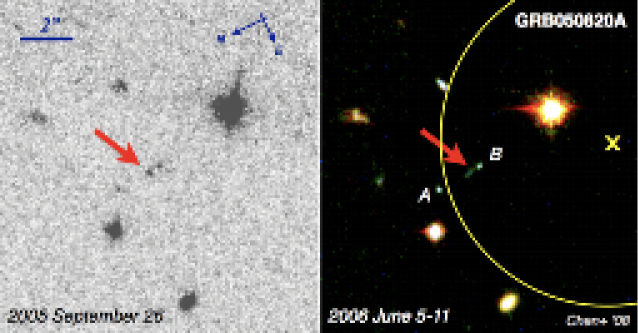
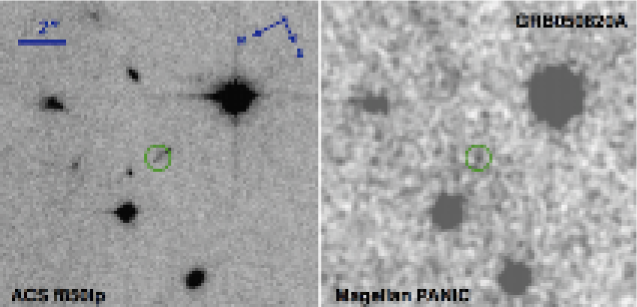
4.7. GRB 050820A at
This burst was detected by Swift (Page et al. 2005a). An optical transient, reported less than 1 hour after the GRB, was identified in data taken shortly after the trigger (Fox & Cenko 2005; Vestrand et al. 2006). High-resolution ( km s-1) echelle spectra of the afterglow obtained shortly after the burst are available from both our own observations using HIRES (Vogt et al. 1994) on the Keck I telescope and the ESO data archive for UVES (D’Odorico et al. 2000). These two spectra together cover a full spectral range from 3300 Å through 10,000 Å, allowing accurate estimates of chemical abudances in the ISM of the GRB host galaxy. Based on multiple absorption features from both ground-state and excited-state ions, we determine a source redshift of and a total neutral hydrogen column density of (Prochaska et al. 2007b; Ledoux et al. 2005). An absorption-line analysis of various ions shows that and (Prochaska et al. 2007b), from which we derive a dust-to-gas ratio that is comparable to what is seen in the Small Magellanic Cloud (SMC). Adopting the SMC dust-to-gas ratio (Gordon et al. 2003), we estimate a visual extinction in the host ISM of . Finally, no trace of H2 is found despite the large and moderate metallicity. The high-resolution, high echelle data allow us to place a sensitive limit on the molecular fraction of the host ISM at (Tumlinson et al. 2007).
Imaging follow-up of the field around GRB 050820A was carried out with ACS and the F625W, F775W, F850LP filters on board HST in two epochs, roughly 37 days, and nine months after the burst (PID10551). We retrieved the imaging data from the HST data archive and processed the images following the descriptions in § 3. Stacked images from the two epochs are presented in Figure 9. The OT was clearly detected in the first epoch image, but faded in the second epoch image which reveals faint extended emission features of the host galaxy. In addition to the extended low-surface feature seen at the position of the OT, which is identified as the host galaxy, we identify two compact sources at north of the OT (Object ) and south of the OT (Object ) from the afterglow lines of sight. We measure isophotal magnitudes of the host and Objects and . The isophotal apertures are defined based on the extent of objects found in a “white light” image, which is a stack of the F625W, F775W, and F850LP images. This “white light” image has the optimal for recovering faint emission features and allows us to determine a common aperture for every object across different bandpasses. We correct the observed brightness to account for intrinsic absorption in the Milky Way ( along the line of sight according to Schlegel et al. 1998). The photometric measurements are presented in Table 2.
We have also observed this field using PANIC on Magellan in August 2007, and obtained a total integration of 141 minutes. The mean FWHM of the PSF was found to be . The final stacked image is presented in Figure 10, together with the second-epoch ACS/F850LP image. The optical and images are registered to a common origin, and the -band image has been smoothed using a Gaussian kernel of . The position of the GRB is marked by a circle of 0.5′′ radius. Extended emission at the position of the host galaxy is detected in the image at level of significance. We measure an -band magnitude of within the isophotal aperture defined for the host galaxy in the “white light” image described above.
At , the observed F775W magnitude of the host galaxy corresponds to a rest-frame absolute magnitude at 2000 Å of . The observed -band magnitude allows us to derive a rest-frame absolute -band magnitude of for the GRB host galaxy. Adopting estimated above from absorption-line abundance ratios and the SMC extinction law (Gordon et al. 2003), we derive extinction corrected rest-frame absolute magnitudes of and .
Neither Object or exhibits detectable flux in the image. We place a 2- limit of for the two sources. The -band photometric measurements are also presented in Table 2. The observed optical and near-infrared colors of Objects and are relatively bluer than those of the GRB host galaxy and inconsistent with the expectations for star-forming objects. This suggests that these are likely foreground galaxies. At these small angular separations (), objects at have projected distances of kpc to the afterglow line of sight, and are expected to imprint strong Mg II absorption features in the afterglow spectrum (e.g. Chen & Tinker 2008).
Incidentally, two strong Mg II absorbers are found at and with Å and Å in the rest frame, respectively. The Mg II absorber exhibits a complex kinematic profile with multiple absorption components spreading over a line-of-sight velocity interval of km s-1, and a non-negligible amount of Ca+ ions (see Figure 13 in Prochaska et al. 2007b). The complex kinematic profile of the absorber and the presence of Ca+ together may be explained by a sightline passing through an interacting system, simliar to the Milky Way and the Magellanic Stream (e.g. Gibson et al. 2000; Putman et al. 2003). Attributing both Objects and to the absorber implies a total absolute -band magnitude of . Follow-up near-infrared H spectroscopy is necessary to provide conclusive identifications of these two sources.
Optical images of the field around GRB 050820A have also been obtained using LRIS and the and filters on the Keck I telescope in July 2006. The mean FWHM of the PSF was found to be in the combined image and in the combined image. The effective seeing was significantly compromised in the images due to a focus problem with the LRIS red-side. Faint emission is clearly detected at the position of the afterglow, but we are unable to obtain accurate measurements of the host magnitude due to contaminating light from galaxies and (Figure 9) in the ground-based images.
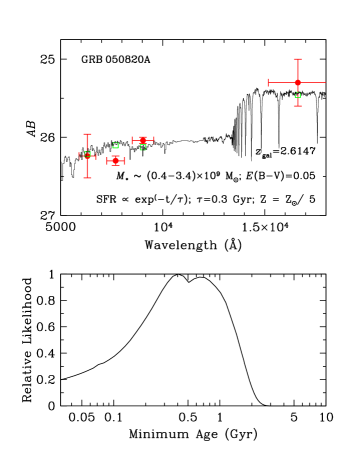
For the host galaxy, the optical and -band photometric measurements presented in Table 2 allow us to examine the star formation history and constrain the stellar mass based on the observed spectral energy distribution (SED). To constrain the underlying stellar population, we consider a suite of synthetic stellar population models generated using the Bruzual & Charlot (2003) spectral library. We adopt a Salpeter initial mass function with a range of metallicity from solar to solar and a range of star formation history from a single burst to exponentially declining SFR of e-folding time Myr or 1 Gyr. We include intrinsic dust extinction that follows the SMC extinction law. Comparing the observed SED with model predictions allows us to constrain the stellar age. The results are presented in Figure 11, where the observed SED of the galaxy is shown in the top panel together with the best-fit model. It is clear that the -band photometry provides the necessary measurement for constraining the stellar population based on the 4000-Å flux decrement. The bottom panel of Figure 10 shows the likelihood distribution function versus stellar age, indicating that the last major episode of star formation occurred at Myr ago.
Adopting the best-fit stellar synthetic model, we infer a total stellar mass of M⊙. We argue that our inferred stellar mass is accurate, despite an absence of rest-frame near-infrared flux measurements. This is supported by previous studies, which show that stellar masses determined based on the observed 4000-Å flux decrement are consistent with those determined based on rest-frame near-infrared luminosity to within the uncertainties (cf. Chen & Marzke 2004 and Yan et al. 2004 for red galaxies identified in the Hubble Ultra Deep Field and see also Shapley et al. 2005 for a detailed comparison based on 72 star-forming galaxies at ). The inferred stellar mass for the host galaxy of GRB 050820A at is comparable to those derived for GRB host galaxies (e.g. Castro Cerón et al. 2006, 2008; Savaglio et al. 2008) but falls in the bottom 2% of the UV luminous galaxies studied by Shapley et al. (2005).
| Objects | (′′) | (F625W) | (F775W) | (F850LP) | () |
|---|---|---|---|---|---|
| Host | … | ||||
4.8. GRB 050908 at
This burst was detected by Swift (Goad et al. 2005) and the optical afterglow was reported by Torii (2005) 14 minutes after the trigger to have . We obtained moderate-resolution ( km s-1) optical spectra of the afterglow, using GMOS on the Gemini north telescope (Foley et al. 2005) and DEIMOS on the Keck II telescope (Prochaska et al. 2005). The two spectra together provides contiguous spectral coverage over Å (Chen et al. 2007b). The afterglow spectra exhibit a suite of absorption features, consistent with a source redshift of . Contrary to the majority of GRB host galaxies, the line-of-sight toward GRB 050908 displays only a modest amount of neutral gas in the host galaxy. Our initial estimate based on the observed absorption line suggest . However, an additional spectrum obtained by Fugazza et al. (2005) and analyzed by Fynbo and collaborators displays non-negligible flux at Å (corresponding to rest-frame wavelength range Å at ), indicating (Johan Fynbo 2007, private communication). This source repressents one of a few GRB sightlines observed so far that do not pass through neutral gas clouds in the host galaxies. Other known sources are GRB 021004 at with , GRB 060526 at with (Jakobsson et al. 2006), and GRB 060607 at with (see further discussion in §§ 4.11 and 4.13). A strong Mg II absorber is found at in the afterglow spectrum (Prochter et al. 2006).
We have observed the field around GRB 050908 using PANIC on Magellan in August 2007, and obtained a total integration of 203 minutes. The mean FWHM of the PSF was found to be . The final stacked image is presented in Figure 12, which has been smoothed using a Gaussian kernel of . The position of the GRB is marked by a circle of 1′′ radius. No detectable flux is seen at the immediate location of the GRB. We place a 2- limit in the observed -band magnitude of over a 0.5′′ diameter aperture for the host galaxy. At , the observed -band magnitude limit allows us to derive a limiting rest-frame absolute magnitude of for the GRB host galaxy.
4.9. GRB 050922C at
This burst was detected by Swift (Norris et al. 2005) and the optical afterglow was reported by Rykoff et al. (2005) ten minutes after the trigger to have mag. Spectroscopic follow-up was carried out roughly 1.5 hours after the trigger by Jakobsson et al. (2006), who reported based on a series of absorption features. A foreground damped absorber (DLA) was also found at along this sightline. Additional high-resolution ( km s-1) echelle spectra of the afterglow were obtained roughly 3.5 hours after the trigger using UVES on the VLT Kueyen telescope (D’Elia et al. 2005). The spectra were retrieved from the ESO data archive and processed using our own reduction software.
The combined echelle spectrum covers a spectral range over Å, allowing accurate estimates of chemical abudances in the ISM of the GRB host galaxy. Based on multiple absorption features from both ground-state and excited-state ions, we determine a total neutral hydrogen column density of . An absorption-line analysis of various ions shows that , and (Prochaska et al. 2007b; Piranomonte et al. 2008). These measurements together imply a dust-to-gas ratio roughly of what is seen in the SMC. Adopting the SMC dust-to-gas ratio (Gordon et al. 2003), we estimate a visual extinction in the host ISM of (see also Prochaska et al. 2007b). Searches for H2 absorption features in the echelle spectrum has also yielded null results, placing a 4- upper limit on the ISM molecular fraction of the host at (Tumlinson et al. 2007). Additional strong absorbers are found at , and (Piranomonte et al. 2008).
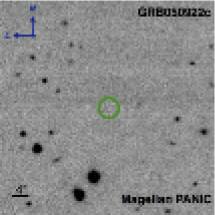
We have observed the field around GRB 050922C using PANIC on Magellan in August 2007, and obtained a total integration of 209 minutes. The mean FWHM of the PSF was found to be . The final stacked image is presented in Figure 13, which has been smoothed using a Gaussian kernel of . The position of the GRB is marked by a circle of 2′′ radius. No detectable flux is seen at the immediate location of the GRB. We place a 2- limit in the observed -band magnitude of over a 0.5′′ diameter aperture for the host galaxy. At , observed -band magnitude limit allows us to derive a limiting rest-frame absolute magnitude of for the GRB host galaxy.
Optical images of the field around GRB 050922c have also been obtained using LRIS and the and filters on the Keck I telescope in July 2006. The mean FWHM of the PSF was found to be in the combined image and in the combined image. No detectable flux is seen at the immediate location of the GRB. We place 2- limits of and over a 2′′ diameter aperture for the host galaxy. At , observed -band magnitude limit allows us to derive a limiting rest-frame absolute magnitude of for the GRB host galaxy. This is comparable to the flux limit in the -band imaging data based on a mean color of for star-forming galaxies (Shapley et al. 2005).
4.10. GRB 060206 at
This burst was detected by Swift (Morris et al. 2006). An optical transient was nearly instantaneously identified with (Fynbo et al. 2006b; Boyd et al. 2006). Spectroscopic follow-up of the afterglow was carried out by multiple groups (Fynbo et al. 2006a; Prochaska et al. 2006; Aoki et al. 2006; Hao et al. 2007). The host galaxy at is found to have and based on moderate resolution ( km s-1) afterglow spectra (Fynbo et al. 2006a; Thöne et al. 2008). No H2 is detected to a 4- limit of (c.f. Fynbo et al. 2006; Tumlinson et al. 2007). In addition to the GRB host, two strong Mg II absorbers are found along the line of sight at and with Å and Å, respectively (Aoki et al. 2006; Hao et al. 2007; Thöne et al. 2008).
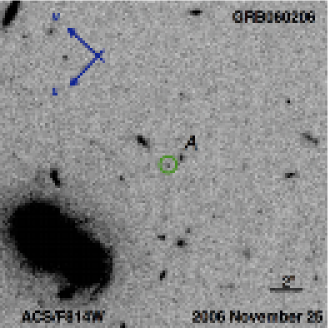
We obtained late-time images of the field around GRB 060206 on November 25, 2006, using ACS and the F814W filter on board HST (PID10817). The images were processed and registered using the standard pipeline technique. A stacked ACS/F814W image is presented in Figure 14. At the position of the OT (marked by a circle of 0.5′′ radius), we clearly detect a faint source of . We identify the source as the host galaxy of GRB 060206. At , the observed F814W magnitude corresponds to a rest-frame absolute magnitude of for the GRB host galaxy.
At southwest of the host, we note the presence of galaxy with . This galaxy was also seen in a deep, ground-based -band image published in Thöne et al. (2008). The authors initially identified galaxy as a candidate for the GRB host galaxy, but revised the identification after analyzing the HST images. Given the large angular distance to the OT (corresponding to kpc at ) and the presence of at least two strong Mg II absorbers in the afterglow spectra, we conclude that galaxy is likely a foreground galaxy associated with one of the Mg II absorbers.
4.11. GRB 060607 at
This burst was detected by Swift and the optical afterglow was detected one minute after the trigger by UVOT and the white filter ( Å) on board the satellite (Ziaeepour et al. 2006). The initial brightness was estimated mag (Ziaeepour et al. 2006). A series of high-resolution ( km s-1) optical spectra of the afterglow were obtained using UVES on the VLT telescope by Ledoux et al. (2006), starting 7.5 minutes after the trigger. These authors identified the GRB host at and noted two probable DLAs at and . We retrieved the echelle spectra from the ESO data archive and processed the data using our own reduction software.
The afterglow spectrum of GRB 060607 exhibits a number of unusual features. First, the GRB host appears to arise in a weak absorber at , with associated Si IV and C IV absorption feature but no trace of low-ionization species. We determine based on a simultaneous Voigt profile analysis of the Lyman absorption series, using the VPFIT333http://www.ast.cam.ac.uk/~rfc/vpfit.html software package. This system represents the only optically thin absorber detected in a GRB host galaxy (Jakobsson et al. 2006; Chen et al. 2007a). Second, the strong absorber at , km s-1 blueshifted from the host, is a Lyman limit system of with weak metal absorption lines detected, implying a metallicity solar. Third, the strong absorber at exhibits complex kinematic profiles in various ionic transitions, spreading over km s-1. We measure .
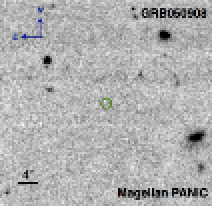
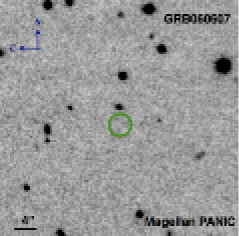
We have observed the field around GRB 060607 using PANIC on Magellan in August 2007, and obtained a total integration of 309 minutes. The mean FWHM of the PSF was found to be . The final stacked image is presented in Figure 15, which has been smoothed using a Gaussian kernel of . The position of the GRB is marked by a circle of 2′′ radius. Despite the discovery of three strong absorbers at , no detectable flux is seen at the immediate location of the GRB. We place a 2- limit in the observed -band magnitude of over a 0.5′′ diameter aperture for the host galaxy. At , observed -band magnitude limit allows us to derive a limiting rest-frame absolute magnitude of for the GRB host galaxy.
Optical images of the field around GRB 060607 have also been obtained using LRIS and the and filters on the Keck I telescope in July 2006. The mean FWHM of the PSF was found to be in the combined image and in the combined image. The effective seeing was compromised in the images due to a focus problem with the LRIS red-side. No detectable flux is found at the immediate location of the GRB. We place 2- limits of and over a 2′′ diameter aperture for the host galaxy. At , observed -band magnitude limit allows us to derive a limiting rest-frame absolute magnitude of for the GRB host galaxy.
4.12. GRB 070721B at
This burst was detected by Swift (Ziaeepour et al. 2007) and the optical afterglow was detected one minute after the trigger by UVOT and the white filter ( Å) on board the satellite (Schady et al. 2007). The initial brightness was estimated mag (Schady et al. 2007). Spectroscopic follow-up was carried out by Malesani et al. (2007), who reported based on the presence of a strong feature and a series of metal absorption lines. The host galaxy is found to have based on moderate resolution afterglow spectra (Jakobsson et al. 2008, in preparation). A additional intervening damped absorber is found at .
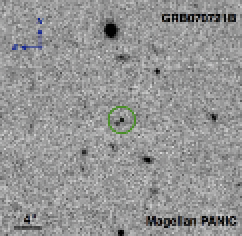
We have observed the field around GRB 070721B using PANIC on Magellan in August 2007, and obtained a total integration of 172 minutes. The mean FWHM of the PSF was found to be . The final stacked image is presented in Figure 16, which has been smoothed using a Gaussian kernel of . The position of the GRB is marked by the cross within a circle of 2′′ radius. No detectable flux is seen at the immediate location of the GRB. However, an extended source is seen at sourtheast of the OT with . This source has been confirmed to be at , associated with the foreground DLA along the line of sight (Fynbo 2008, private communication; Milvang-Jensen et al. 2008, in preparation). This represents by far the most luminous DLA galaxy found at (e.g. Møller et al. 2002a). At , the projected distance between the foreground DLA and the extended source would be kpc. We therefore consider the GRB host galaxy missing in our -band image and place a 2- limit of over a 0.5′′ diameter aperture for the host galaxy. At , observed -band magnitude limit allows us to derive a limiting rest-frame absolute magnitude of for the GRB host galaxy.
4.13. GRBs 000301C, 000926, & 021004
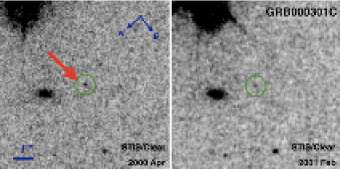
Early-time imaging and spectroscopic observations of the afterglow of GRB 000301C have been presented in Jensen et al. (2001), who reported based on low-resolution afterglow spectra that the source is at . The host ISM in front of the afterglow was found to have . Multi-epoch imaging follow-up was carried out using STIS on board HST and the clear filter under program # 8189 (PI: Fruchter; see also Fruchter et al. 2006). We retrieved available imaging data from the HST data archive and analyzed the images ourselves. In the left panel of Figure 17, we present a stacked image of the field obtained in April 2000 with a total exposure time of 9391 s. The optical transient is clearly visible in this early epoch image. In contrast, the images (total exposure time of 7031 s) obtained in February 2001 (right panel of Figure 17) exhibit only faint emission at the location of the GRB. Attributing the faint emission to the host galaxy, we measure a total flux of over a 0.5′′ diameter aperture. This is consistent with the measurement reported by Fruchter et al. (2006). Accounting for the bandpass difference (e.g. Figure 3), we derive and .
Both GRB 000926 and GRB 021004 have been studied extensively by previous authors. Their host galaxies are identified in early effort to carry out imaging follow-up with HST. Here we briefly review known emission and absorption properties of the two host galaxies to complete the discussion of individual GRB hosts.
Detailed spectroscopic and imaging studies of GRB 000926 are presented in Harrison et al. (2001), Fynbo et al. (2001), and Castro et al. (2003). The afterglow spectrum displays a DLA of and a series of metal absorption features at with an estimated metallicity of and metal abundance ratio of (Castro et al. 2003). Adopting the dust-to-gas ratio and the SMC extinction law, we derive a visual extinction of and .
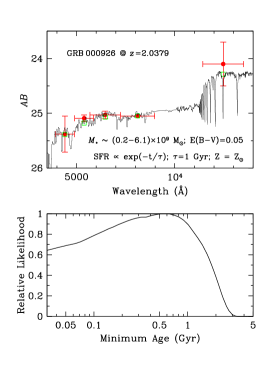
The host galaxy is identified both in emission on the ground (Fynbo et al. 2002) and in space images obtained using HST WFPC2 and the F606W filter (Castro et al. 2003). It displays a disturbed morphology at rest-frame UV wavelengths with extended emission over a kpc projected size. Additional near-infrared -band images show that the host has (Christensen et al. 2004) which, together with available WFPC2 photometry, constrains its absolute magnitudes at rest-frame UV and optical wavelengths. Including the intrinsic extinction correction estimated from absorption line analysis, we find and . Comparing the observed SED with a suite of stellar synthetic models described in § 4.6, we find the host galaxy is best decribed with a mean stellar age of Myr and an exponentially declined SFR of e-folding time 1 Gyr (left panels of Figure 18). Adopting the best-fit stellar synthetic model, we can constrain the total underlying stellar mass to be M⊙, consistent with M⊙ estimated by Savaglio et al. (2008).
Detailed spectroscopic and imaging studies of GRB 021004 are presented in Møller et al. 2002b, Mirabal et al. 2003, Schaefer et al. 2003, Fiore et al. 2005, and Fynbo et al. 2005. The afterglow spectrum displays a combination of emission and absorption due to the hydrogen transition and a series of metal absorption lines at . The presence of emission in the afterglow spectrum makes it difficult to determine precisely. Based on the absence of Lyman limit photons, Fynbo et al. (2005) derive . This is therefore one of the four GRB Lyman limit absorbers published so far (including GRB 060526 in Jakobsson et al. 2006). We have retrieved available echelle spectra of the OT from the ESO data archive. Based on the absorption strengths of Si II and Fe II observed in the combined spectrum, we take into account necessary corrections for the ionization fraction of the gas and place an upper limit to the metallicity of the gas at .
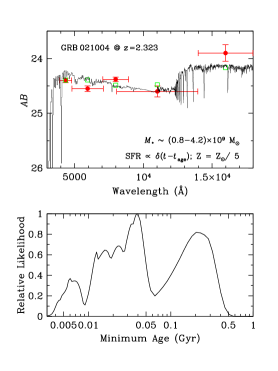
Optical and near-infrared photometry of the host galaxy of GRB 021004 are reported and analyzed in Fynbo et al. (2005). The authors estimate a mean stellar age of Myr. Adopting the optical and near-infrared photometric measurements of Fynbo et al. (2005), we derive a rest-frame absolute magnitude of or . Comparing the observed SED with a suite of stellar synthetic models described in § 4.6, we find the host galaxy is best decribed by a single starburst episode that occurred Myr ago, and constrain the total underlying stellar mass to be M⊙. This is smaller than M⊙ estimated by Savaglio et al. (2008). The discrepancy may be understood by the poorly constrained star formation history, displayed in the right panels of Figure 18.
We note that two strong Mg II absorbers are found at and with Å and Å, respectively. The large absorption width of these foreground absorbers imply possible contaminating light in the host imaging observation (c.f. Pollack et al. 2008). Indeed, the host galaxy is clearly resolved into two compact clumps in available HST images (e.g. Fynbo et al. 2005; Chen et al. 2007b), but extended emission is detected in ground-based narrow-band imaging follow-up (Jakobsson et al. 2005). In the following discussion, we consider the derived absolute magnitude as an upper limit to the intrinsic luminosity of this host galaxy.
5. DISCUSSION
We have carried out an optical and near-infrared imaging survey of the fields around 15 GRBs at . The GRBs are selected to have early-time afterglow spectra in order to compare ISM absorption-line properties with stellar properties. The redshifts of the GRBs span a range from to , and the neutral hydrogen column densities of the GRB host ISM span a range from to (Figure 1).
In addition to the five previously known GRB host galaxies, we report new detections for the host galaxies of GRB 050820 and GRB 060206. The seven identified GRB host galaxies have rest-frame UV absolute magnitudes spanning from to mag. For sources with a known dust-to-gas ratio from afterglow absorption-line analysis, we correct the rest-frame UV magnitude for dust extinction assuming an SMC extinction law. The inferred SFR spans a range from 0.6 to 3.8 M⊙ yr-1. We are able to constrain the underlying stellar populations for three host galaxies, GRB 000926, GRB 021004, and GRB 050820, based on comparisons of the observed optical and near-infrared broad-band colors and a suite of stellar population synthetic models . We estimate total stellar masses of between M⊙ for these hosts. We also place 2- upper limits for the rest-frame luminosities of the remaining eight GRB host galaxies based on the depths in available optical and near-infrared images. Finally, high spatial resolution images from the HST allow us to deblend the GRB host galaxies from foreground absorbers and to unveil a range of rest-frame UV morphology between compact (e.g. GRB 060206) and extended (e.g. GRB 050820) emission features of the hosts.
A summary of known absorption-line properties and stellar properties of the 15 GRB host galaxies is presented in Table 3. Combining early-time, high-resolution afterglow spectra and the results of late-time imaging survey of the GRB fields allows us to address a number of issues regarding both the nature of GRB progenitor environment and star-forming physics in distant starburst galaxies.
5.1. The Luminosity Distribution of GRB Host Galaxies
First, we examine the luminosity distribution of GRB host galaxies above based on the survey result of our sample. The goal is to characterize the nature of GRB host galaxies based on comparisons of their luminosity distribution and the luminosity distribution of a randomly selected sample from the field galaxy population. We incorporate the non-detections in our follow-up imaging survey by evaluating the cumulative maximum fraction of GRB host galaxies that are fainter than a given UV absolute magnitude (solid histogram in Figure 19). For the host of GRB 030429, we have a constraint only for the rest-frame -band magnitude. We infer its corresponding UV magnitude based on the mean color of (with an r.m.s. scatter of 0.3 mag) observed for luminous starburst galaxies at in Shapley et al. (2005). For the host of GRB 060607, we have estimated limiting magnitudes both in the rest-frame UV and bands. We adopt the more sensitive limit based on the conversion of 444We note that while there is no apparent trend between and in the luminous starburst sample of Shapley et al. (2005), it is possible that that fainter dwarf starburst galaxies may be bluer. Given that only two fields (GRB 030429 and GRB 060607) are affected by this conversion, we find that the results presented in this section are not sensitive to the adopted color.. The empirical observations of the sample of 15 GRB fields confirm the previous understanding for GRB hosts (e.g. Le Floc’h et al. 2003): as much as 70% of long-duration GRBs may originate in galaxies fainter than .
At , the field galaxy population is now well characterized by a Schechter luminosity function at rest-frame UV wavelengths with , , and a faint-end slope (Bouwens et al. 2007; Reddy et al. 2008). If the GRB host galaxies are representative of the field galaxy population, then we expect that the fraction of host galaxies found in a luminosity interval is proportional to the space density of galaxies in the luminosity range. The expected cumulative maximum fraction of the host galaxies versus UV magnitude can be estimated following
| (1) |
where the first term extends over known host galaxies that have , the second term extends over unidentified host galaxies that may be as luminous as , and is the galaxy luminosity function. The luminosity distribution is expected to resemble the galaxy luminosity function with a dominant fraction attributed to faint dwarf galaxies (e.g. Jakobsson et al. 2005; Fynbo et al. 2008).
We test this hypothesis by calculating for a sample of 15 random galaxies that share the known luminosities of the seven identified GRB host galaxies and the empirical 2- upper limits for the remaining eight GRB host galaxies. We experiment with different (with corresponding minimum luminosity ) in Equation (1). The results for and for are shown as the dashed curves in Figure 19. Smaller models predict a larger contributions from fainter galaxies. The model expections for different adopted clearly deviate from the observed distribution. The hypothesis that the host galaxies of long-duration GRBs trace random field galaxies is rejected at % confidence level based on a Kolmogorov–Smirnov (KS) test.
Next, under the assumption that GRBs trace instantaneous star formation, galaxies with higher on-going SFR are expected to have higher probability to host a GRB event. Applying the rest-frame UV luminosity as a measure of the on-going SFR, we modify Equation (1) to include a UV luminosity weighting, , for calculating the expected ,
| (2) | |||||
The results are shown as solid and dotted curves in Figure 19. The observations are best described under this hypothesis for (solid curve) based on a KS test, but we cannot rule out models with (lower dotted curve) or (upper dotted curve).
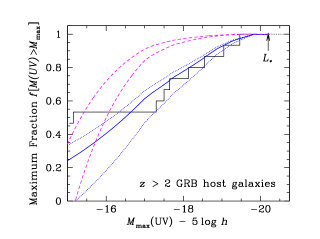
In summary, the sample of seven known GRB host galaxies and eight upper limits for unidentified hosts allows us to determine the cumulative maximum fraction of the host galaxy population as a function of rest-frame UV magnitude. Adopting rest-frame UV luminosity as a measure of on-going SFR, we find that the empirical sample is best described by a SFR-weighted sample of the field galaxy population. Models that do not include SFR weighting can be ruled out at % confidence level. Based on the best-fit SFR-weighted model, we estimate a median luminosity for the GRB host galaxies at .
A similar analysis has been presented in Jakobsson et al. (2005), who derived constraints for the luminosity function of GRB host galaxies under the assumption that the observed brightness distribution of the hosts follows a luminosity weighted field galaxy population. Our study differs from the approach of Jakobsson et al. in that our analysis is based on a uniform set of photometric measurements from our own imaging survey. Then we adopt the known UV luminosity function of the field galaxy population (with a faint-end slope of ) and examine different hypotheses for generating the observed GRB host galaxy sample. We confirm that the host galaxy population is representative of a UV luminosity weighted sample. The difference between the host luminosity function of Jakobsson et al. and the best-fit luminosity of star-forming galaxies at may be due to uncertainties in published photometric data of the host galaxies in their sample and uncertainties in the line-of-sight absorption properties.
We note that although the selection criterion of our GRB sample is based on available afterglow spectra that presumably includes only GRBs with relatively bright optical afterglows, the broad range in the isotropic energy release of the GRBs (see Table 1 in Chen et al. 2007a) indicates that the GRBs in our sample are not an overly biased portion of the long-duration GRB population. That is, we have selected a representative subsample of the unobscured GRB host galaxy population. However, the presence of 20% dark bursts that do not have optical afterglows found (e.g. Tanvir & Jakobsson 2007) suggests that some GRBs originate in heavily obscured star-forming regions that are not included in our sample and are likely missed in the UV selected field galaxy sample as well. To constrain the fraction of dust obscured star-forming galaxies requires an independent study of the fields around dark bursts.
5.2. The Luminosity–Metallicity Relation in GRB Host Galaxies

We combine known absorption-line properties with estimated galaxy UV luminosity to investigate the gas kinematics and chemical enrichment in the ISM of GRB host galaxies. The goals of this study are (1) to examine the physical processes that determine the observed absorption-properties in the host ISM, (2) to investigate whether there is a metallicity cutoff in GRB host galaxies as favored by various theoretical models (e.g. Hirschi et al. 2005; Yoon & Langer 2005; Woosley & Heger 2006), and (3) to probe the luminosity–metallicity relation below the magnitude limit of most previous studies at (e.g. Erb et al. 2006; Maiolino et al. 2008).
We first compare rest-frame absorption equivalent widths of the Si II transition observed in the host with the absolute UV magnitude. For this study, we consider only host DLAs because the lyman limit absorbers do not include neutral ISM in the host galaxies. The Si II transition is typically saturated at Å. The line width provides a measure of the velocity field of cool clouds along the line of sight through a galactic halo, rather than the total gas column density (e.g. Prochaska et al. 2008). We adopt the measurements published in Prochaska et al. (2008). Including additional measurement for GRB 060206 in public afterglow spectra from Subaru Science Data Archive (Aoki et al. 2006), we have assembled eight GRB hosts galaxies for this study.
Figure 20 shows that there exists a relatively significant trend with stronger Si II transitions appearing in more luminous hosts. Including upper limits, we find based on a generalized Kendall test that the probability of a positive correlation between and is nearly 95%. While the positive correlation is similar to the mass-metallicity relation seen in field galaxies (e.g. Erb et al. 2006; Maiolino et al. 2008) , we note that half of the host galaxies have Å, corresponding to a velocity width of km s-1. Attributing the large line width to gravitational motion of clouds within the host dark matter halos would require a halo mass , comparable to the mass scale found for halos that host luminous starburst galaxies at (e.g. Conroy et al. 2008) but at odds with expectations for starburst galaxies of low stellar mass and low luminosity. But because serves as a measure of the on-going SFR, the observed versus correlation implies that the velocity field observed in GRB host galaxies is driven by galactic outflows.
Next, we examine whether there exists a correlation between host luminosity and ISM metallicity, in comparison to what is known for luminous starburst galaxies published by Erb et al. (2006). We note two apprarent caveats in our study. First, chemical abundances of the GRB host galaxies in our sample are determined for the cold neutral medium using absorption-line techniques, whereas the metallicities of field galaxies are determined from the integrated emission-line fluxes of their H II regions. Although extensive studies have yet to be undertaken to examine possible systematic differences between absorption- and emission-line abundance measurements, available evidence based on limited studies of nearby starburst galaxies have yielded consistent metallicity measurements using either absorption-line or emission-line techniques (see Russell & Dopita 1992 and Welty et al. 1997, 1999 for the Large and Small Magellanic Clouds; Lecavelier des Estangs et al. 2004 for I Zw 18; and Schulte-Ladbeck et al. 2005 and Bowen et al. 2005 for SBS 1543593). In the few cases where emission and absorption line measurements have been compared in galaxies at , the two methods have been found to give consistent answers to within a factor of (e.g. Pettini 2006).
Second, absorption-line measurements are for the ISM along the afterglow line of sight, whereas emission-line observations are integrated measurements averaged over the entire galaxies. A large metallicity gradient is commonly seen in nearby galaxies with a slope varying between dex / kpc to dex / kpc (e.g. Zaritsky et al. 1994; van Zee et al. 1998; Kennicutt et al. 2003). Therefore, a metallicity measurement for individual sightlines may not be representative of the global mean value of the entire host galaxy. We note, however, that galaxies are relatively compact with typical half light radii of kpc (Bouwens et al. 2004; Law et al. 2007). Previous observations (e.g. Bloom et al. 2002; Fruchter et al. 2006) and current findings for GRB 050820 and GRB 060206 show that the GRBs occur within kpc radius of their host galaxies. This is also consistent with the large observed in the afterglow spectra with the exception of four non-DLAs. Spatial variation of the observed metallicity across distant star-forming galaxies is therefore not expected to exceed 0.2 dex. We proceed with an analysis that compares the ISM metal content of GRB galaxies with those of known starburst galaxies at .
Figure 21 shows the the luminosity–metallicity relation reproduced from Erb et al. (2006) for starburst galaxies at (open squares). The oxygen abundances are measured using the index, which is a measure of the flux ratio between the observed [N II] to H lines555See Erb et al. 2006 for a discussion of possible systematic uncertainties associated with the index. While it is known that the index saturates at solar metallicity, the saturation does not affect our comparison because GRB host galaxies appear to have mostly sub-solar abundances (e.g. Prochaska et al. 2007a).. The rest-frame -band magnitudes published in Erb et al. have been converted to UV magnitude according to to facilitate comparisons with the GRB host galaxy population and with predictions from numerical simulations (crosses in Figure 21, reproduced from Fynbo et al. 2008). The color conversion is estimated based on the mean colors for these galaxies in Shapley et al. (2005).
We include in Figure 21 measurements for nine GRB host galaxies for which measurments (solid points) or constraints (open circles) on the ISM metallicity are available. Only known host DLAs are considered in the comparison here. Left arrows represent the fields (GRB 050401, GRB 050922c and GRB 050730) for which no hosts have been found and 2- upper limits to the intrinsic luminosity are shown. The lower limits represent those GRB fields for which only moderate resolution afterglow spectra are available and the observed absorption-line strengths represent a lower limit to the intrinsic values (e.g. Prochaska 2006).
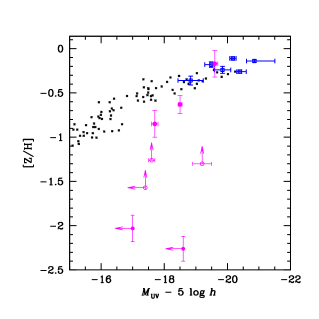
Three interesting features are seen in Figure 21. First, the majority of the GRB host galaxies are fainter than the faintest starburst galaxies studied in magnitude-limited surveys (open squares) and offer a promising probe to extend the studies of ISM metal enrichment to fainter luminosity limits than existing faint galaxy surveys (Djorgovski et al. 2004). Second, the metallicities found in GRB host galaxies span two orders of magnitude from dex below solar to below solar, while the rest-frame UV luminosity of the galaxies extends from to fainter than . There is no apparent upper metallicity cutoff in the sample of GRB host galaxies at . Finally, we include predictions from numerical simulations performed by Sommer-Larsen & Fynbo (2008) that include SNe feedback. The crosses are reproduced from Fynbo et al. (2008) for comparison with observations. Despite the presence of lower limits in the metallicities of three GRB hosts, there is a moderate trend that suggests a steeper luminosity–metallicity relation than what is seen in simulations. We note that this is unlikely due to a selection bias against metal enriched faint galaxies based on the study presented in § 5.1, which shows that the GRB host galaxies are consistent with an SFR selected field galaxy sample.
Different theoretical studies have been carried out to understand the key astrophysical processes that determine the luminosity–metallicity relation found in galaxies from different epochs (e.g. Dekel & Woo 2003; Tassis et al. 2008; Brooks et al. 2007; Finlator & Davé 2008). The steep decline in ISM metallicity toward fainter magnitudes may be interpreted as a signature of SNe driven outflows that removes metals more effectively in lower-mass halos than in more massive ones (e.g. Dekel & Woo 2003), or as a signature of inefficient star formation in low mass halos due to low gas density (e.g. Tassis et al. 2008; Robertson & Kravtsov 2008). The model expectations presented in Figure 20 includes SNe feedback but no ISM radiation field to account for subsequent destruction of molecules in star-forming regions. The observed steeper luminosity–metallicity relation in faint galaxies and the absence of molecular gas in GRB host ISM (Tumlinson et al. 2007) suggests that an enhanced ISM radiation field from young stars may be important to effectively reduce subsequent star formation and ISM chemical enrichment in dwarf galaxies.
5.3. Empirical Constraints for the ISM Radiation Field in GRB Host Galaxies
To understand the lack of molecular gas in GRB host ISM, Tumlinson et al. (2007) performed a comparison between observations and predictions from a grid of models that cover a parameter space spanned by four unknown properties. These include gas density, metallicity, clouds size and interstellar radiation field. The authors showed that the lack of molecular gas in the host ISM can be understood by a combination of low metallicity (low grain production rate) and high interstellar UV radiation field in the host ISM. Recently, Whalen et al. (2008) carried out a set of numerical simulations to examine whether the absence of molecular gas is due to the afterglow radiation field or an enhanced interstellar UV radiation field from a pre-existing H II region where the progenitor star resides. Taking into account known metallicities from afterglow absorption analysis, Whalen et al. concluded that, similar to what is found in the Magellanic Clouds, ISM radiation fields of intensities up to 100 times the Galactic mean are necessary to explain the absence of H2 in the host ISM.
With the resolved galaxy morphologies seen in the HST images of GRB 000926, GRB 030323, GRB 050820A, and GRB 060206, we can measure directly the mean radiation field in the ISM of the host galaxies at near UV wavelengths ( Å). The mean UV radiation intensity is determined by averaging the observed UV flux over the extent of each host galaxy. For comparison with models, we convert from the observed mean radiation intensity at near UV wavelengths to the far UV Lyman-Warner band ( eV) based on the Galactic UV radiation spectrum of Gondhalekar et al. (1980). The estimated far UV radiation fields of individual host galaxies are presented in Table 3. Adopting a mean Galactic radiation field at far UV wavelengths of photons cm-2 s-1 Hz-1 (Gondhalekar et al. 1980), we find that, despite a moderate SFR, the ISM radiation field in the GRB host galaxies spans a range over the Galactic mean value due to a relatively compact size. The observations provide empirical support for the previous theoretical understanding (e.g. Whalen et al. 2008) that strong UV radiation fields in low-metallicity ISM environment may be a dominant factor for suppressing the formation of molecules and therefore subsequent star formation in dwarf galaxies.
5.4. Properties of Foreground Mg II Absorbing Galaxies
A puzzling observation of the absorption properties along GRB lines of sight is the apparent overdensity of strong (rest-frame absorption equivalent width Å) Mg II absorbers (Prochter et al. 2006). Afterglow spectra exhibit on average more strong Mg II absorbers than random QSO spectra (Prochter et al. 2006; Sudilovsky et al. 2007), although such over abundance is not seen in C IV absorbers at somewhat higher redshift (Sudilovsky et al. 2007; Tejos et al. 2007). Various scenarios have been considered to explain this discrepancy, including dust extinction due to the presence of these absorbers that biases observations of QSO sightlines, the GRBs being gravitationally lensed by the foreground absorbers, and the absorbers being intrinsic to the GRBs (Prochter et al. 2006; Porciani et al. 2007). However, none of these scenarios alone is found sufficient to explain the observed overabundance along afterglow sightlines. A different scenario has been proposed by Frank et al. (2007), who consider different beam sizes between QSOs and GRB afterglows as a possible explanation, but two important consequences are associated with this scenario. First, a partial covering of Mg II gas is expected along QSO sightlines. Second, a skewed frequency distribution of Mg II absorbers is also expected along GRB sightlines. None is confirmed in empirical data (e.g. Pontzen et al. 2007). We refer the readers to Porciani et al. (2007) for a detailed discussion.
Late-time HST images of the fields around known GRBs offer a detailed view of the galaxy environment around known foreground Mg II absorbers along the sightlines toward the GRBs (e.g. Pollack et al. 2008). Six of the 15 GRBs sightlines in our sample have known strong Mg II absorbers of Å in the foreground (e.g. Prochter et al. 2006), three of which have deep HST images available. Including the field around GRB 060418 (Pollack et al. 2008), we find that in all four cases the HST images have uncovered at least one galaxy at angular separation from the afterglow sightlines. In contrast, such galaxies at small are clearly absent in fields with no known strong Mg II absorbers (Figure 22). A summary of the known Mg II absorbers and possible candidate absorbing galaxies is presented in Table 4.

Although only one of the candidate galaxies in Table 4 has been spectroscopically confirmed (the Mg II absorber at toward GRB 030429), the finding of additional faint galaxies along the GRB sightlines strongly disfavors the absorbers being intrinsic to the GRBs. In addition, these candidate galaxies exhibit a broad range of optical-infrared colors (c.f. the blue colors of galaxies toward GRB 050820 shown in Table 2 and Figure 9 and those found toward GRB 060418 in Pollack et al. 2008). Dust extinction does not appear to be a uniform factor across different GRB sightlines that results in the higher incidence of strong Mg II absorbers. Comparisons of the absorbing galaxy properties found along afterglow and QSO sightlines (O’Meara et al. 2006; Becker et al. in preparation) should provide further insights for understanding the differential incidences of Mg II absorbers. The morphology of additional faint emission near the absorbing galaxy toward GRB 030429 (Figure 6) is suggestive of a lensed event. Additional optical imaging and spectroscopic data are necessary to test the lensing hypothesis for this source.
A conclusive answer to the observed overdensity of foreground Mg II absorbers along GRB sightlines requires a larger sample of imaging and spectroscopic data of the candidate absorbing galaxies. Based on the current finding, however, we caution that the presence of intervening galaxies at small angular distances to the GRBs introduces non-negligible contamination for identifying GRB host galaxies based on imaging data alone. High spatial resolution images are crucial for resolving the host galaxies from foreground absorbers. While the properties of the Mg II absorbers are beyond the scope of this paper, we emphasize that in the absence of spectroscopic observations it will be necessary to take into account line-of-sight absorption-line properties in afterglow spectra when evaluating the uncertainty of an imaging identification of GRB host galaxies.
6. Summary
We present a study of faint galaxies uncovered along GRB lines of sight, based on an optical and near-infrared imaging survey of the fields around 15 GRBs at . The GRBs are selected with available early-time afterglow spectra in order to compare ISM absorption-line properties with stellar properties. The redshifts of the GRBs span a range from to . The neutral hydrogen column densities of the GRB host ISM span a range from to . Our analysis differs from previous studies in that we have obtained a uniform set of photometric data from our own imaging survey, reducing systematic uncertainties in photometric measurements of the host galaxies.
In addition to the five previously studied GRB host galaxies, we consider new detections for the host galaxies of GRB 050820 and GRB 060206. We also place 2- upper limits for the rest-frame luminosities of the remaining eight GRB host galaxies based on the depths in available optical and near-infrared images. Combining early-time, high-resolution afterglow spectra and late-time imaging survey of the GRB fields allows us to address a number of issues regarding both the nature of GRB progenitor environment and star-forming physics in distant starburst galaxies. The line-of-sight properties uncovered in the afterglow spectra have also proven to be valuable for filtering potential contaminations due to foreground galaxies. The results of our study are summarized as the following:
1. GRB host galaxies exhibit a broad range of rest-frame UV absolute magnitudes spanning from to . The distribution of rest-frame UV luminosities shows that the GRB host galaxy population is best described by a UV luminosity weighted random galaxy population with a median luminosity of . Models that include no luminosity weighting are ruled out at % confidence level. This result demonstrates that GRB host galaxies are representative of unobscured star-forming galaxies at .
2. There exists a relatively significant correlation between UV luminosity and Si II transition in GRB host galaxies. A generalized Kendall test including upper limits indicates that the probability of a positive correlation between and is nearly 95%. Attributing the observed large line widths of Å to gravitational motions of gaseous clouds would require massive halos that are also more rare at . Adopting as a measure of on-going SFR and the lack of correlation between SFR and total stellar mass in star-forming galaxies at , we therefore interpret the observed versus correlation as indicating that the velocity field observed in GRB host galaxies is driven by galactic outflows.
3. GRB host ISM exhibit a broad range of chemical enrichment, from solar to solar. No apparent metallicty cutoff is seen in the high-redshift host galaxy population. Similar to nearby galaxies, a tentative trend of declining ISM metallicity toward fainter () luminosities is seen in the star-forming galaxy population at . The slope is steeper than what is expected in some numerical simulations that incorporate supernovae feedback. Together with an absence of molecular gas and the presence of large amounts atomic gas, the observed luminosity–metallcity relation may be explained by low star formation efficiency in dwarf galaxies.
4. We measure the interstellar radiation field using resolved rest-frame UV morphologies in available HST images. We find that the UV radiation field in GRB host ISM spans a range over higher than the Galactic mean value. The strong ISM radiation field observed in GRB host galaxies is expected to increase the formation threshold of molecules and suppress subsequent star formation, supporting the hypothesis that star formation efficiency in dwarf galaxies is reduced due to the strong radiation field of existing H II regions.
5. We examine the galaxy environment in available HST images of strong Mg II absorbers found along GRB sightlines. In all fields with known strong absorbers, we identify at least one faint galaxy at from the afterglow position. In contrast, such galaxies at small are clearly absent in fields with no known strong Mg II absorbers. The finding of additional faint galaxies along the GRB sightlines strongly disfavors the strong absorbers being intrinsic to the GRBs. Additional imaging and spectroscopic data of the candidate absorbing galaxies are necessary to investigate the effect of dust and gravitational magnification, but the presence of intervening galaxies at small angular distances to the GRBs increases the ambiguity of identifying GRB host galaxies. It is necessary to combine high spatial resolution images and early-time afterglow spectra for accurate identifications of the host galaxies.
References
- (1)
- (2)
- (3) Adelberger, K. L. & Steidel, C. C. 2000, ApJ, 544, 218
- (4)
- (5) Akerlof, C. et al. 1999, Nature, 398, 400
- (6)
- (7) Angelini, L. et al. 2005, GCN Circ. 3161
- (8)
- (9) Aoki, K. et al. 2006, GCN Circ. 4703
- (10)
- (11) Barbier, L. et al. 2005, GCN Circ. 3162
- (12)
- (13) Berger, E. et al. 2002, ApJ, 581, 981
- (14)
- (15) Bernstein, R. et al. 2003, Proc. SPIE, 4841, 1694
- (16)
- (17) Bloom, J. S., Kulkarni, S. R., & Djorgovski, S. G. 2002, AJ, 123, 1111
- (18)
- (19) Bloom, H. S. et al. 2008, ApJ submitted (arXiv: 0803.3215)
- (20)
- (21) Bouwens, R. J., Illingworth, G. D., Blakeslee, J. P., Broadhurst, T. J., & Franx, M. 2004, ApJ, 611, L1
- (22)
- (23) Bouwens, R. J., Illingworth, G. D., Franx, M., & Ford, H. 2007, ApJ, 670, 928
- (24)
- (25) Bowen, D. V., Jenkins, E. B., Pettini, M., & Tripp, T. M. 2005, ApJ, 635, 880
- (26)
- (27) Boyd, P., Hunsberger, S., & Gronwall, C. 2006, GCN Circ. 4684
- (28)
- (29) Brooks, A. M., Governato, F., Booth, C. M., Willman, B., Gardner, J. P., Wadsley, J., Stinson, G., & Quinn, T. 2007, ApJ, 655, L17
- (30)
- (31) Bruzual, G., & Charlot, S. 2003, MNRAS, 344, 1000
- (32)
- (33) Castro, S. et al. 2003, ApJ, 586, 128
- (34)
- (35) Castro Cerón, J. M., Michalowski, M J., Hjorth, J., Watson, D., Fynbo, J. P. U., & Gorosabel, J. 2006, ApJ, 653, L85
- (36)
- (37) Castro Cerón, J. M., Michalowski, M J., Hjorth, J., Malesani, D., Gorosabel, J., Watson, D., & Fynbo, J. P. U. 2008, ApJ submitted (arXiv:0803.2235)
- (38)
- (39) Chary, R., Becklin, E. E., & Armus, L. 2002, AJ, 566, 229
- (40)
- (41) Chen, H.-W. & Lanzetta, K. M. 2003, ApJ, 597, 706
- (42)
- (43) Chen, H.-W. & Marzke, R. O. 2004, ApJ, 615, 603
- (44)
- (45) Chen, H.-W., Prochaska, J. X., Bloom, J. S., & Thompson, I. B. 2005, ApJ, 634, L25
- (46) Chen, H.-W., Prochaska, J. X., & Gnedin, N. 2007a, ApJ, 667, L125
- (47)
- (48) Chen, H.-W., Prochaska, J. X., Ramirez-Ruiz, E., Bloom, J. S., Dessauges-Zavadsky, M., & Foley, R. J. 2007b, ApJ, 663, 420
- (49)
- (50) Chen, H.-W. & Tinker, J. L. 2008, ApJ in press (arXiv:0801.2169)
- (51)
- (52) Christensen, L., Hjorth, J., & Gorosabel, J. 2004., A&A, 425, 913
- (53)
- (54) Conroy, C., Shapley, A. E., Tinker, J. L., Santos, M. R., & Lemson, G. 2008, ApJ, 679, 1192
- (55)
- (56) Dekel, A. & Woo, J. 2003, MNRAS, 344, 1131
- (57)
- (58) D’Elia, V. et al. 2005, GCN Circ. 4044
- (59)
- (60) D’Elia, V. et al. 2007, A&A, 467, 629
- (61)
- (62) D’Elia V. et al. 2008, ApJL submitted (arXiv:0804.2141)
- (63)
- (64) Djorgovski, S. G., et al. 2004, in ASP Conf. Ser., Gamma-Ray Bursts in the Afterglow Era, ed. L. Piro & M. Feroci (San Francisco: ASP), p. 249
- (65)
- (66) D’Odorico, S., Cristiani, S., Dekker, H., et al. 2000, in SPIE 4005, Discoveries and Research Prospects from 8- to 10-Meter-Class Telescopes, ed. J. Bergeron, 121
- (67)
- (68) Doty, J. et al. 2003, GCN Circ. 2211
- (69)
- (70) Eliasdottir et al. 2008, ApJ submitted
- (71)
- (72) Erb, D. K., Shapley, A. E., Pettini, M., Steidel, C. C., Reddy, N. A., & Adelberver, K. L. 2006, ApJ, 644, 813
- (73)
- (74) Finlator, K. & Davé, R. 2008, MNRAS, 385, 2181
- (75)
- (76) Fiore, F. et al. 2005, ApJ, 624, 853
- (77)
- (78) Foley, R. J., Chen, H.-W., Bloom, J. S., & Prochaska, J. X. 2005, GCN Circ. 3949
- (79)
- (80) Ford, H. C., et al. 1998, Proc. SPIE, 3356, 234
- (81)
- (82) Fox, D. B. & Cenko, S. B. 2005, GCN Circ. 3829
- (83)
- (84) Frank, S., Bentz, M. C., Stanek, K. Z., Mathur, S., Dietrich, M., Peterson, B. M., & Atlee, D. W. 2007, Ap&SS, 312, 325
- (85)
- (86) Fruchter, A., Vreeswijk, P., Rhoads, J., & Burud, I. 2001, GCN Circ. 1200
- (87)
- (88) Fruchter, A. et al. 2006, Nature, 441, 463
- (89)
- (90) Fugazza, D. et al. 2005, GCN Circ. 3948
- (91)
- (92) Fynbo, J. P. U. et al. 2001, A&A, 373, 796
- (93)
- (94) Fynbo, J. P. U. et al. 2002, A&A, 388, 425
- (95)
- (96) Fynbo, J. P. U. et al. 2003a, A&A, 406, L63
- (97)
- (98) Fynbo, J. P. U. et al. 2003b, GCN Circ. 2185
- (99)
- (100) Fynbo, J. P. U. et al. 2005, ApJ, 633, 317
- (101)
- (102) Fynbo, J. P. U. et al. 2006a, A&A, 451, L47
- (103)
- (104) Fynbo, J. P. U. et al. 2006b, GCN Circ. 4683
- (105)
- (106) Fynbo, J. P. U., Prochaska, J. X., Sommer-Larsen, J., Dessauges-Zavadsky, M., & Möller, P. 2008, ApJ in press (arXiv:0801.3273)
- (107)
- (108) Gehrels, N. et al. 2004, ApJ, 611, 1005
- (109)
- (110) Gibson, B. K., Giroux, M. L., Penton, S. V., Putman, M. E., Stocke, J. T., & Shull, J. M. 2000, AJ, 120, 1830
- (111)
- (112) Gilmore, A., Kilmartin, P., & Henden, A. 2003a, GCN Circ. 1949
- (113)
- (114) Gilmore, A., Kilmartin, P., & Henden, A. 2003b, GCN Circ. 2184
- (115)
- (116) Gladders, M., Holland, S., Garnavich, P. M., Jha, S., Stanek, K. Z., Bersier, D., & Barrientos, L. F., 2001, GCN Circ. 1209
- (117)
- (118) Goad, M. et al. 2005, GCN Circ. 3942
- (119)
- (120) Gondhalekar, P. M., Phillips, A. P., & Wilson, R. 1980, A&A, 85, 272
- (121)
- (122) Gordon, K. D., et al. 2003, ApJ, 594, 279
- (123)
- (124) Grav, T. et al. 2001, GCN Circ. 1191
- (125)
- (126) Graziani, C. et al. 2003, GCN Circ. 1956
- (127)
- (128) Hao, H. et al. 2007, ApJ, 659, L99
- (129)
- (130) Harrison, F. A. et al. 2001, ApJ, 559, 123
- (131)
- (132) Hirschi, R., Meynet, G., & Maeder, A. 2005, A&A, 443, 581
- (133)
- (134) Hjorth, J. et al. 2003, ApJ, 597, 699
- (135)
- (136) Holland, S. T. et al. 2005, GCN Circ. 3704
- (137)
- (138) Jakobsson, P. et al. 2003, A&A, 408, 941
- (139)
- (140) Jakobsson, P. et al. 2004, A&A, 427, 785
- (141)
- (142) Jakobsson, P. et al. 2005, MNRAS, 362, 245
- (143)
- (144) Jakobsson, P. et al. 2006, A&A, 460, L13
- (145)
- (146) Jakobsson, P., Fynbo, J.P.U., Vreeswijk, P. M., & de Ugarte Postigo, A. 2008, GCN Circ. 8077
- (147)
- (148) Jensen, B. L. et al. 2001, A&A, 370, 909
- (149)
- (150) Kann, D. A., Masetti, N., & Klose, S. 2007, AJ, 133, 1187
- (151)
- (152) Kennicutt, R. C., Jr., Bresolin, F., & Garnett, D. R. 2003, ApJ, 591, 801
- (153)
- (154) Kewley, L. J. & Dopita, M. A. 2002, ApJS, 142, 35
- (155)
- (156) Krühler, T., Küpcü Yoldaş, A., Greiner, J., Clemens, C., McBreen, S., Primak,N., Savaglio, S., Yoldaş, A., & Szokoly, G. P. 2008, ApJ in press (arXiv:0805.2824)
- (157)
- (158) Law, D. R., Steidel, C. C., Erb, D. K., Pettini, M., Reddy, N. A., Shapley, A. E., Adelberger, K. L., & Simenc, D. J. 2007, ApJ, 656, L1
- (159)
- (160) Lecavelier des Etangs, A., Désert, J.-M., Kunth, D., Vidal-Madjar, A., Callejo, G., Ferlet, R., Hébrard, G., & Lebouteiller, V. 2004, A&A, 413, 131
- (161)
- (162) Ledoux, C. et al. 2005, GCN Circ. 3860
- (163)
- (164) Ledoux, C. et al. 2006, GCN Circ. 5237
- (165)
- (166) Le Floc’h, E., et al. 2002, A&A, 400, 499
- (167)
- (168) Le Floc’h, E., Charmandaris, V., Forrest, W. J., Mirabel, I. F., Armus, L., & Devost, D. 2006, ApJ, 642, L636
- (169)
- (170) Maiolino, R. et al. 2008, A&A in press (arXiv:0806.2410)
- (171)
- (172) Martini, P., Persson, S.E. Murphy, D.C., Birk, C., Shectman, S.A., Gunnels, S.M., & Koch, E. 2004, Proc. SPIE, 5492, 1653
- (173)
- (174) McNaught, R. & Price, P, A. 2005, GCN Circ. 3163
- (175)
- (176) Malesani, D. et al. 2007, GCN Circ. 6713
- (177)
- (178) Modjaz, M., Kewley, L., Kirshner, R. P., Stanek, K. Z., Challis, P., Garnavich, P. M., Greene, J. E., Kelly, P. L., & Prieto, J. L. 2008, AJ, 135, 1136
- (179)
- (180) Møller, P., Warren, S.J., Fall, S.M., Fynbo, J.U., & Jakobsen, P. 2002a, ApJ, 574, 51
- (181)
- (182) Møller, P. et al. 2002b, A&A, 396, L21
- (183)
- (184) Morris, D. et al. 2006, GCN Circ. 4682
- (185)
- (186) Norris, J. et al. 2005, GCN Circ. 4013
- (187)
- (188) Oke, J. B., et al. 1995, PASP, 107, 375
- (189)
- (190) O’Meara, J. M., Chen, H.-W., & Kaplan, D. L. 2006, ApJ, 642, L9
- (191)
- (192) Paczyński, B. 1998, ApJ, 494, 45
- (193)
- (194) Page, M. et al. 2005a, GCN Circ. 3830
- (195)
- (196) Page, M. et al. 2005b, GCN Circ. 3837
- (197)
- (198) Persson, S.E., Murphy, D.C., Krzeminski, W., Roth, M., & Rieke, M.J. 1998, AJ, 116, 2475
- (199)
- (200) Pettini, M. 2006 in The Fabulous Destiny of Galaxies: Bridging Past and Present, V. LeBrun, A. Mazure, S. Arnouts & D. Burgarella eds., (Paris: Frontier Group), 319 (astro-ph/0603066)
- (201)
- (202) Piranomonte, S. et al. 2008, A&A submitted
- (203)
- (204) Pollack, L. K., Chen, H.-W., Prochaska, J. X., & Bloom, J. S. 2008, ApJ submitted
- (205)
- (206) Porciani, C., Viel, M., & Lilly, S. J. 2007, ApJ, 659, 218
- (207)
- (208) Pontzen, A., Hewett, P., Carswell, R., & Wild, V. 2007, MNRAS, 381, L99
- (209)
- (210) Price, P. A. et al. 2002, GCN Circ. 1221
- (211)
- (212) Prochaska, J. X. et al. 2005, GCN Circ. 3971
- (213)
- (214) Prochaska, J. X., Chen, H.-W., & Bloom, J. S. 2006, ApJ, 648, 95
- (215)
- (216) Prochaska, J. X. 2006, ApJ, 650, 272
- (217)
- (218) Prochaska, J. X. et al. 2006, GCN Circ. 4701
- (219)
- (220) Prochaska, J. X., Chen, H. -W., Dessauges-Zavadsky, M., & Bloom, J. S. 2007a, ApJ, 666, 267
- (221)
- (222) Prochaska, J. X., Chen, H. -W., & Bloom, J. S. et al. 2007b, ApJ, 168, 231
- (223)
- (224) Prochter, G. E., Prochaska, J. X., Chen, H.-W., Bloom, J. S., Dessauges-Zavadsky, M., Foley, R. J., Lopez, S., Pettini, M., Dupree, A. K., & Guhathakurta, P. 2006, ApJ, 648, L93
- (225)
- (226) Putman, M. E., Staveley-Smith, L., Freeman, K. C., Gibson, B. K., & Barnes, D. G. 2003, ApJ, 586, 170
- (227)
- (228) Reddy, N. A., Steidel, C. C., Pettini, M., Adelberger, K. L., Shapley, A. E., Erb, D. K., & Dickinson, M. 2008, ApJS, 175, 48
- (229)
- (230) Ricker, G. R., et al. 2002, GCN Circ. 1220
- (231)
- (232) Robertson, B. E. & Kravtsov, A. V. 2008, ApJ, 680, 1083
- (233)
- (234) Russell, S. C. & Dopita, M. A. 1992, ApJ, 384, 508
- (235)
- (236) Rykoff, E. S., Yost, S. A., & Rujopakarn, W. 2005, GCN Circ. 4011
- (237)
- (238) Savaglio, S. 2006, New Journal of Physics, 8, 195
- (239)
- (240) Savaglio, S., Glazebrook, K., & Le Borgne, D. 2008, ApJ submitted (arXiv:0803.2718)
- (241)
- (242) Schady, P. et al. 2007, GCN Circ. 6641
- (243)
- (244) Schaefer, B. et al. 2003, ApJ, 588, 387
- (245)
- (246) Schlegel, D. J., Finkbeiner, D. P., & Davis, Marc 1998, ApJ, 500, 525
- (247)
- (248) Schulte-Ladbeck, R. E. et al. 2005, ApJ, 625, L79
- (249)
- (250) Shapley, A. E., Erb, D. K., Pettini, M., Steidel, C. C., & Adelberger, K. L. 2004, ApJ, 612, 108
- (251)
- (252) Shapley, A. E., Steidel, C. C., Erb, D. K., Reddy, N. A., Adelberver, K. L., Pettini, M., Barmby, P., & Huang, J. 2005, ApJ, 626, 698
- (253)
- (254) Skillman, E. D., Côté, S., & Miller, B. W. 2003, AJ, 125, 610
- (255)
- (256) Smith, J. A. et al. 2002, AJ, 123, 2121
- (257)
- (258) Sollerman, J., Östlin, G., Fynbo, J.P.U., Hjorth, J., Fruchter, A., & Pedersen, K. 2005, New Astronomy, 11, 103
- (259)
- (260) Sommer-Larsen, J. & Fynbo, J. P. U. 2008, MNRAS, 385, 3
- (261)
- (262) Stanek, K. Z. et al. 2003, ApJ, 591, L17
- (263)
- (264) Starling, R. L. C., et al. 2005, A&A, 442, L21
- (265)
- (266) Sudilovsky, V., Savaglio, S., Vreeswijk, P., Ledoux, C., Smette, A., & Greiner, J. 2007, ApJ, 669, 741
- (267)
- (268) Tanvir, N. R. & Jakobsson, P. 2007, Phil. Trans. Royal Society A, 366, 1377
- (269)
- (270) Tassis, K., Kravtsov, A. V., & Gnedin, N. Y. 2008, ApJ, 672, 888
- (271)
- (272) Tejos, N., Lopez, S., Prochaska, J. X., Chen, H.-W., & Dessauges-Zavadsky, M. 2007, ApJ, 671, 622
- (273)
- (274) Thöne, C. C. et al. 2008, A&A in press (arXiv:0708.3448)
- (275)
- (276) Torii, K. 2005, GCN Circ. 3943
- (277)
- (278) Tremonti, C. A. et al. 2004, ApJ, 613, 898
- (279)
- (280) Tumlinson, J., Prochaska, J. X., Chen, H.-W., Dessauges-Zavadsky, M., & Bloom, J. S. 2007, ApJ, 668, 667
- (281)
- (282) van Zee, L., Salzer, J. J., Haynes, M. P., O’Donoghue, A. A., & Balonek, T. J. 1998, AJ, 116, 2805
- (283)
- (284) Vestrand, W. T. et al. 2006, Nature, 442, 172
- (285)
- (286) Vogt, S. S., et al. 1994, Proc. SPIE, 2198, 362
- (287)
- (288) Vreeswijk, P. et al. 2004, A&A, 419, 927
- (289)
- (290) Vreeswijk, P. et al. 2006, A&A, 447, 145
- (291)
- (292) Vreeswijk, P. M. et al. 2007, A&A, 468, 83
- (293)
- (294) Watson, D. et al. 2006, ApJ, 652, 1011
- (295)
- (296) Welty, D. E., Lauroesch, J. T., Blades, J. C., Hobbs, L. M., & York, D. G. 1997, ApJ, 489, 672
- (297)
- (298) Welty, D. E., Frisch, P. C., Sonneborn, G., & York, D. G. 1999, ApJ, 512, 636
- (299)
- (300) Whalen, D., Prochaska, J. X., Heger, A., & Tumlinson, J. 2008, ApJ in press (arXiv:0802. 0737)
- (301)
- (302) Wijers, R. A. M. J., Bloom, J. S., Bagla, J. S., & Natarajan, P. 1998, MNRAS, 294, L13
- (303)
- (304) Wolf, C. & Podsiadlowski, P. 2007, MNRAS, 375, 1049
- (305)
- (306) Wolfe, A. M., Gawiser, E., & Prochaska, J. X. 2006, ARA&A, 43, 861
- (307)
- (308) Woosley, S. E. 1993, ApJ, 405, 273
- (309)
- (310) Woosley, S. E. & Heger, A. 2006, ApJ, 637, 914
- (311)
- (312) Woosley, S. E. & Bloom, J. S. 2006, ARA&A, 44, 507
- (313)
- (314) Yan, H. et al. 2004, ApJ, 616, 63
- (315)
- (316) Yoon, S.-C. & Langer, N. 2005, A&A, 443, 643
- (317)
- (318) Zaritsky, D., Kennicutt, R.C. Jr., & Huchra, J.P. 1994, ApJ, 420, 87
- (319)
- (320) Ziaeepour, H. Z. et al. 2006, GCN Circ. 5233
- (321)
- (322) Ziaeepour, H. Z. et al. 2007, GCN Circ. 6640
- (323)
| Absorption Properties | Galaxy Properties | |||||||||||
|---|---|---|---|---|---|---|---|---|---|---|---|---|
| Field | (Å) | (photons/cm2/s/Hz) | ( M⊙) | |||||||||
| GRB 000301C | 2.040 | … | … | … | … | … | … | … | ||||
| GRB 000926 | 2.038 | 0.15 | ||||||||||
| GRB 011211 | 2.140 | … | … | … | … | |||||||
| GRB 021004 | 2.329 | … | … | … | … | |||||||
| GRB 020124 | 3.198 | … | … | … | … | … | … | … | ||||
| GRB 030323 | 3.372 | … | … | 18.8 | … | |||||||
| GRB 030429 | 2.658 | … | … | … | … | … | … | |||||
| GRB 050401 | 2.899 | … | … | … | … | |||||||
| GRB 050730 | 3.968 | 0.00 | … | … | … | |||||||
| GRB 050820A | 2.615 | 0.08 | ||||||||||
| GRB 050908 | 3.343 | … | … | … | … | … | … | … | ||||
| GRB 050922C | 2.199 | 0.01 | … | … | ||||||||
| GRB 060206 | 4.048 | … | … | … | … | |||||||
| GRB 060607 | 3.075 | … | … | … | … | … | … | |||||
| GRB 070721B | 3.626 | … | … | … | … | … | … | … | ||||
| Mg II Properties | Galaxy Properties | |||||||
|---|---|---|---|---|---|---|---|---|
| Field | aaRest-frame absorption equivalent width of Si II in the host ISM. The measurements of all but the one for GRB 060206 are adopted from Prochaska et al. (2008). The measurement for GRB 060206 is determined using public spectra in Subaru Science Data Archive (Aoki et al. 2006). | Filter | ||||||
| GRB 021004 | 2.329 | 1.38 | 1.81 | F606W | ||||
| 1.60 | 1.53 | F606W | ||||||
| GRB 030429 | 2.658 | 0.84 | 3.30 | |||||
| GRB 050820A | 2.615 | 0.69 | 2.99 | F625W | ||||
| 1.43 | 1.89 | F625W | ||||||
| GRB 060206 | 3.548 | 2.26 | 1.60 | F814W | ||||
| GRB 070721B | 3.626 | 3.09 | … | |||||