The 15–43-GHz Parsec-scale Circular Polarization of 41 Active Galactic Nuclei
Abstract
We present the results of parsec-scale circular polarization measurements based on Very Long Baseline Array data for a number of radio-bright, core-dominated Active Galactic Nuclei obtained simultaneously at 15, 22 and 43 GHz. The degrees of circular polarization for the VLBI core region at 15 GHz are similar to values reported earlier at this wavelength, with typical values of a few tenths of a percent. We find that as often rises as falls with increasing frequency between 15 and 22 GHz, while the degree of circular polarisation at 43 GHz is in all cases higher than at 22 and 15 GHz. This behaviour seems contrary to expectations, since the degree of circular polarization from both synchrotron radiation and Faraday conversion of linear to circular polarization – the two main mechanisms considered thus far in the literature – should decrease towards higher frequencies if the source is homogeneous. The increase in at 43 GHz may be due to the presence of regions of both positive and negative circular polarisation with different frequency dependences (but decreasing with increasing frequency) on small scales within the core region; alternatively, it may be associated with the intrinsic inhomogeneity of a Blandford–Königl-like jet. In several objects, the detected circular polarization appears to be near, but not coincident with the core, although further observations are needed to confirm this. We find several cases of changes in sign with frequency, most often between 22 and 43 GHz. We find tentative evidence for transverse structure in the circular polarization of 1055+018 and 1334127 that is consistent with their being generated by either the synchrotron mechanism or Faraday conversion in a helical magnetic field. Our results confirm the earlier finding that the sign of the circular polarization at a given observing frequency is generally consistent across epochs separated by several years or more, suggesting stability of the magnetic field orientation in the innermost jets.
keywords:
galaxies: active – galaxies: jets – quasars:1 Introduction
The radio emission of core-dominated, radio-loud Active Galactic Nuclei (AGN) is synchrotron radiation generated in the relativistic jets that emerge from the nucleus of the galaxy, presumably along the rotational axis of a central supermassive black hole. Synchrotron radiation can be highly linearly polarized, to in the case of a uniform magnetic (B) field (Pacholczyk 1970), and linear polarization observations can yield unique information about the orientation and degree of order of the B field in the synchrotron source, as well as the distribution of thermal electrons and the B-field geometry in the immediate vicinity of the AGN (e.g., via Faraday rotation of the plane of polarization).
Techniques for deriving circular-polarization (CP) information on parsec scales were pioneered by Homan and his collaborators in the late 1990s (Homan & Wardle 1999; Homan, Attridge & Wardle 2001) using data taken on the NRAO111The National Radio Astronomy Observatory of the USA is operated by Associated Universities, Inc., under co-operative agreement with the US NSF. Very Long Baseline Array (VLBA). Recently, CP measurements for the first epoch of the MOJAVE project (monitoring of 133 AGN at 15 GHz with the VLBA) were published by Homan and Lister (2006). Circular polarization was detected in 34 of these objects at the 2 level or higher. These results confirmed previously noted trends: the circular polarization is nearly always coincident with the VLBI core, with typical degrees of polarization being a few tenths of a percent. Homan & Lister (2006) found no evidence for any correlation between and any of 20 different optical, radio and intrinsic parameters of the AGN. Interestingly, five of the 34 AGN displayed CP in their jets, well outside the VLBI-core region, suggesting that the mechanism generating the circular polarization is capable of operating effectively in optically thin regions (although, strictly speaking, direct spectral-index measurements were not available at the corresponding epoch, since the MOJAVE measurements were made only at 15 GHz).
The two main mechanisms that are usually considered to be the most likely generators of the observed CP are the synchrotron mechanism and the Faraday conversion of linear to circular polarization [Legg & Westfold 1968, Jones & O’Dell 1977; see also the reviews by Beckert & Falcke (2002) and Wardle & Homan (2003)]. Although the intrinsic CP generated by synchrotron radiation may be able to reach a few tenths of a percent at 15 GHz for the magnetic-field strengths characteristic of the observed VLBI cores of AGN (typically G; Lobanov 1998, O’Sullivan & Gabuzda, in preparation), the highest observed values seem too high to plausibly be attributed to this mechanism. This suggests that Faraday conversion plays a role, possibly the dominant one, since it is expected to be more efficient at generating CP than the synchrotron mechanism for the conditions in radio cores (Jones & O’Dell 1977).
Faraday conversion (Jones & O’Dell 1977, Jones 1988) occurs because the component of the linear-polarization electric vector parallel to the conversion magnetic field, E∥, gives rise to oscillations of free charges in the conversion region, while the component orthogonal to this magnetic field, E⟂, cannot (the charges are not free to move orthogonal to the magnetic field). This leads to a delay of E∥ relative to E⟂, manifest as the introduction of a small amount of circular polarization. We recently obtained intriguing evidence that the CP in AGN may be generated by Faraday conversion in helical jet magnetic fields (Gabuzda et al. 2008). In this scenario, linearly polarized radiation emitted at the far side of the jet is partially converted to circular polarization as it passes through the magnetic field at the near side of the jet on its way to the observer. In the simple model considered, the sign of the generated CP is determined by the pitch angle of the helical field, which can be approximately deduced from the observed linear polarization structure, and the helicity of the helical field, which can be deduced from the direction of the Faraday-rotation gradient across the VLBI jet, due to the systematically changing line-of-sight component of the helical field. The inferred helicity depends on whether the longitudinal component of the field corresponds to a “North” or “South” pole of the central black hole. After identifying 8 AGN with both detected VLBI-scale CP and transverse Faraday rotation gradients, Gabuzda et al. (2008) determined the CP signs that should be observed for the cores of these AGN based on the inferred pitch angles and the helicities for their helical fields, if the jets were emerging from the North or South magnetic pole of the black hole. The result was clearly not random: in all 8 cases, the observed CP signs agreed with the signs predicted by the simple helical-field model for the case of the longitudinal field corresponding to South polarity. Although the physical origin of this result is not clear, it strongly suggests a close connection between CP and the presence of helical jet magnetic fields; the probability of finding that 8 of 8 of these AGN had CP signs corresponding to one particular polarity is less than 1%. The apparent predominance of jets associated with South magnetic poles may have cardinal implications for the intrinsic magnetic-field structures of the central black holes; for example, one way to understand this result is if the central fields are quadrupolar, with a predomint tendency for the two South poles to correspond to the jets and the two North poles to lie in the plane of the accretion disc, for reasons that are not yet understood.
We present here new CP measurements for 41 AGN at 15, 22 and 43 GHz, as well as for an additional 18 AGN at 15 GHz only. Parsec-scale CP was detected at two of the three frequencies in 5 of the 41 AGN, and at all three frequencies in another 5 AGN. Our 15-GHz results are generally in excellent agreement with the first-epoch MOJAVE CP values (Homan & Lister 2006). The results do not show any universal frequency dependence for the degree of CP , and both rising and falling spectra with frequency are observed. Unexpectedly, we find to be higher at 43 GHz than at the lower two frequencies. We also find tentative evidence for transverse CP structure consistent with the CP being produced in a helical magnetic field geometry in two objects.
2 The Data and their Reduction
We derived our multi-frequency CP measurements from simultaneous 15.285, 22.285 and 43.131 GHz VLBA polarization observations of compact AGN obtained at epochs 7 August 2002, 5 March 2003, 1 November 2004, 15 March 2005 and 26 September 2005. We also present 15-GHz results derived from data obtained on 27 December 1999. The data were all obtained in a “snapshot” mode, with about 10 scans of 3–4 min duration of each source at each frequency spread throughout the time the object was visible with all or nearly all of the VLBA antennas. The preliminary calibration, D-term calibration and imaging were done in the NRAO AIPS package following standard techniques; for further information about the calibration procedures used, see Gabuzda et al. (2006), where some total intensity, linear polarization and rotation-measure maps for objects observed in August 2002 and March 2003 are presented.
The CP calibration of the gains was done using the well established gain-transfer (GT) technique of Homan and Wardle (1999), described in detail both in that paper and by Vitrishchak & Gabuzda (2007). In this method, estimates of the right-to-left (R/L) gain ratios for various sources at various times are collated and smoothed to obtain a master R/L gain calibration table, which is then applied to the data for each source. Sources known or suspected of having detectable CP are excluded from those used to make this master calibration table. In all cases, we applied a Gaussian smoothing function with a full width at half maximum of four hours. The successful application of this technique depends on observing a sufficiently large number of sources over a sufficiently long time. This criterion was met reasonably well by all our observations, as we typically observed 10–12 objects in 24 hours in each experiment.
The uncertainties in the CP values were determined in essentially the same way as is described by Homan, Attridge & Wardle (2001), including contributions for uncertainty (i) in the smoothed antenna gains, (ii) due to real CP in the calibrators, and (iii) due to random scan-to-scan gain variations. We also added the fractional CP corresponding to the rms in the map in quadrature. This uncertainty-estimation procedure is relatively conservative, and we are in the course of investigating a Monte Carlo approach to estimating the CP uncertainties, similar to that used by Homan & Lister (2006).
| Source | Optical Class | Epoch | 15 GHz | 22 GHz | 43 GHz | ||||
| (%) | (%) | (%) | |||||||
| 0048097 | B | 05 Mar 2003 | |||||||
| 01 Nov 2004 | |||||||||
| 0109+224 | B | 27 Dec 1999 | 2.7 | – | – | – | – | ||
| 0133+476 | 0.859 | Q | 26 Sept 2005 | 3.6 | 2.3 | ||||
| 0138097 | 0.733 | B | 05 Mar 2003 | ||||||
| 26 Sept 2005 | |||||||||
| 0215+015 | 1.715 | B | 27 Dec 1999 | – | – | – | – | ||
| 0256+075 | 0.893 | B | 05 Mar 2003 | – | – | ||||
| 01 Nov 2004 | |||||||||
| 0300+470 | B | 27 Dec 1999 | 3.0 | – | – | – | – | ||
| 0306+102 | 0.863 | B | 27 Dec 1999 | – | – | – | – | ||
| 0420014 | 0.915 | Q | 15 Mar 2005 | ||||||
| 0422+004 | B | 27 Dec 1999 | – | – | – | – | |||
| 0735+178 | B | 05 Mar 2003 | |||||||
| 0745+241 | 0.409 | B | 15 Mar 2005 | ||||||
| 0754+100 | 0.266 | B | 27 Dec 1999 | – | – | – | – | ||
| 0804+499 | 1.432 | Q | 01 Nov 2004 | ||||||
| 0808+019 | B | 27 Dec 1999 | – | – | – | – | |||
| 0814+425 | B | 26 Sept 2005 | |||||||
| 0818128 | B | 27 Dec 1999 | – | – | – | – | |||
| 0823+033 | 0.506 | B | 05 Mar 2003 | 2.2 | |||||
| 0829+046 | 0.174 | B | 27 Dec 1999 | – | – | – | – | ||
| 0851+202 | 0.306 | B | 05 Mar 2003 | 2.0 | |||||
| 26 Sept 2005 | 2.3 | 1.7 | 1.9 | ||||||
| 0859+470 | 1.470 | Q | 15 Mar 2005 | ||||||
| 0906+430 | 0.670 | Q | 01 Nov 2004 | ||||||
| 0953+254 | 0.712 | Q | 15 Mar 2005 | ||||||
| 1055+018 | 0.888 | Q | 15 Mar 2005 | 5.0 | 1.7 | See Table 3 | |||
| 1034293 | 0.312 | B | 27 Dec 1999 | 3.1 | – | – | – | – | |
| 1147+245 | 0.200 | B | 05 Mar 2003 | ||||||
| 1156+295 | 0.729 | Q | 07 Aug 2002 | 2.6 | |||||
| 01 Nov 2004 | |||||||||
| 26 Sept 2005 | |||||||||
| 1215+303 | 0.130 | B | 27 Dec 1999 | – | – | – | – | ||
| 1253055 | 0.538 | Q | 07 Aug 2002 | 1.7 | |||||
| 04 Mar 2003 | 8.3 | 2.5 | 3.3 | ||||||
| 15 Mar 2005 | 2.9 | 1.4 | 6.1 | ||||||
| 1307+121 | B | 27 Dec 1999 | – | – | – | – | |||
| 1334127 | 0.539 | Q | 05 Mar 2003 | 3.0 | 1.8 | See Table 3 | |||
| 1413+135 | 0.247 | B | 27 Dec 1999 | – | – | – | – | ||
| 1418+546 | 0.153 | B | 07 Aug 2002 | ||||||
| 1510089 | 0.36 | Q | 15 Mar 2005 | 2.6 | 7.1 | ||||
| 1514+197 | 1.070 | B | 27 Dec 1999 | – | – | – | – | ||
| 1514241 | 0.049 | B | 27 Dec 1999 | – | – | – | – | ||
| 1538+149 | 0.605 | B | 07 Aug 2002 | ||||||
| 05 Mar 2003 | |||||||||
| 1611+343 | 1.401 | Q | 26 Sept 2005 | ||||||
| 1633+382 | 1.807 | Q | 01 Nov 2004 | 5.7 | 5.0 | ||||
| 1637+574 | 0.751 | Q | 15 Mar 2005 | ||||||
| 1641+399 | 0.594 | Q | 01 Nov 2004 | ||||||
| 1652+398 | 0.034 | B | 26 Sept 2005 | ||||||
| 1717+178 | 0.137 | B | 27 Dec 1999 | – | – | – | – | ||
| 1732+389 | 0.970 | B | 07 Aug 2002 | ||||||
| 05 Mar 2003 | |||||||||
| 1739+522 | 1.379 | Q | 15 Mar 2005 | ||||||
| 1749+096 | 0.322 | B | 27 Dec 1999 | 2.4 | – | – | – | – | |
| 07 Aug 2002 | 2.5 | ||||||||
| 1823+568 | 0.663 | B | 27 Dec 1999 | – | – | – | – | ||
| 07 Aug 2002 | |||||||||
| 1954+513 | 1.220 | Q | 15 Mar 2005 | ||||||
| Source | Optical Class | Epoch | 15 GHz | 22 GHz | 43 GHz | ||||
| (%) | (%) | (%) | |||||||
| 2032+107 | 0.601 | B | 27 Dec 1999 | – | – | – | – | ||
| 2131021 | 1.285 | B | 07 Aug 2002 | ||||||
| 2134+004 | 1.932 | Q | 01 Nov 2004 | ||||||
| 2145+067 | 0.999 | Q | 26 Sept 2005 | 5.0 | 2.3 | ||||
| 2155155 | 0.672 | Q | 26 Sept 2005 | ||||||
| 2200+420 | 0.069 | B | 07 Aug 2002 | ||||||
| 2223052 | 1.404 | Q | 27 Dec 1999 | 2.8 | – | – | – | – | |
| 2230+114 | 1.037 | Q | 01 Nov 2004 | 7.2 | 6.6 | ||||
| 2251+158 | 0.859 | Q | 26 Sept 2005 | See Table 3 | 2.4 | 1.6 | |||
| 2254+074 | 0.190 | B | 07 Aug 2002 | ||||||
3 Results
Table 1 gives a list of the AGN observed in the 6 experiments, together with their redshifts, optical classes, the epochs at which they were observed, and our estimated degrees of core CP at each of the three frequencies, , obtained by taking the ratio of the peaks of the Stokes (circular polarization) and (total intensity) images (when the and peaks were coincident or nearly coincident). These values for were derived using the beam sizes appropriate for each frequency. The errors are also indicated; when CP was not detected, is given as the upper limit. A dash in the 22 and 43-GHz columns for and indicates that the source was not observed at those frequencies for the indicated experiment.
Table 1 lists several tentative measurements with significances between and . We have included these when there was some supporting evidence of their reality, in particular, detection of CP at the other frequencies observed or detection of CP with the same sign in the first-epoch MOJAVE experiments (Homan & Lister 2006). However, it should be borne in mind that these should not be considered firm detections until they are confirmed by further measurements, and the skeptical reader should feel free to consider these upper limits equal to the indicated CP values plus . All of the objects with measured CP in Table 1 have CP measurements with significances of or higher at at least one frequency.
The BL Lac object 1034293 was the only object for which we detected CP that is not included in the MOJAVE sample. Table 2 gives a comparison of our results for the remaining 16 sources with the first-epoch 15-GHz MOJAVE results (Homan & Lister 2006). In all 8 cases when CP is detected in both our experiments and the MOJAVE first-epoch experiments, the sign of the CP at 15 GHz for the two datasets agree. We did not detect 15-GHz CP in 1510089, but the sign of CP we detect at 22 GHz agrees with the sign of the MOJAVE measurements. In several other sources, our detections are consistent with the MOJAVE upper limits. This all shows the reliability of our measurements, and demonstrates that a self-consistent picture is emerging from the accumulating data, despite the difficulty of these measurements.
| Source | 15 GHz | Comments | |
|---|---|---|---|
| Our result | MOJAVE result | ||
| (%) | (%) | ||
| 0109+224 | Our measurement consistent with upper limit | ||
| 0133+476 | |||
| 0300+470 | |||
| 0823+033 | Our measurement consistent with upper limit | ||
| 0851+202 | |||
| 1055+018 | |||
| 1156+295 | |||
| 1253055 | |||
| 1334127 | |||
| 1510089 | We find at 22 GHz | ||
| 1633+382 | |||
| 1749+096 | |||
| 2145+067 | |||
| 2223052 | Our measurement consistent with upper limit | ||
| 2230+114 | |||
| 2251+158 | |||
We have detected CP in the jet, significantly displaced from the peak, in several sources, namely 3C279 (15, 22 GHz), 1334127 (43 GHz) and possibly 1055+018 (43 GHz). We estimated the corresponding degrees of circular polarization using the total and fluxes in a -pixel region around the peak. These values are listed in Table 3, and are discussed below.
| Source | Epoch | Frequency | Location | (%) | |
| 1055+018 | 15 March 2005 | 43 GHz | Northern/Southern side of jet | 7.2/4.1 | |
| 1253055 | 15 GHz | Inner jet | +0.44 | 4.4 | |
| 22 GHz | Inner jet | +0.79 | 3.1 | ||
| 1334127 | 04 March 2003 | 43 GHz | Western side of jet | 25.0 |
3.1 Techniques Used to Test and Refine our Results
The data in Tables 1 and 2 correspond to the CP maps we obtained using the gain-transfer method of Homan and Wardle (1999). In several cases, these images suggested that the peak was shifted from the total-intensity () peak. To test whether these shifts were real, we made a new image after applying one round of phase self-calibration assuming zero , as described by Homan & Lister (2006). If the CP signal in question is not real, the apparent peak will tend to disappear from the new image. If the CP in the image is real, but the shift from the phase center is due to phase errors, the peak of the new image should be nearly the same, but the peak will now coincide with the peak. If the CP is real and its shifted position from the phase center is also real, the effect of applying the phase self-calibration assuming zero depends on the structure. If the structure is extended, this additional phase self-calibration may remove phase errors while leaving the fundamental information in the phases intact, as was demonstrated by Homan & Lister (2006). However, if the structure is very compact, so that the phases are close to zero, applying this phase-only self-calibration can corrupt the phases, giving rise to a false symmetrical structure about the phase center. Thus, the appearance of such a symmetrical structure upon application of one phase self-calibration assuming zero to the data obtained from the gain-transfer procedure can be used as a test of the reality of the CP signal and its shift from the phase center. We will refer to the application of one phase self-calibration assuming zero as the PHC procedure.
| Source | Epoch | Frequency | Procedure∗ | peak | Lowest contour | Peak | Lowest contour |
| 0851+202 | 26 September 2005 | 15 GHz | GT | 2.2 | 3120 | 2.1 | |
| PHC | 1.9 | 3125 | 2.1 | ||||
| 1055+018 | 15 March 2005 | 43 GHz | GT | 6.3 | 2261 | 5.0 | |
| 1253055 | 04 March 2003 | 15 GHz | GT | +55.0 | 4.6 | 6659 | 19.5 |
| 22 GHz | GT | +44.9 | 17.0 | 7271 | 15.4 | ||
| 15 March 2005 | 43 GHz | GT | 41.1 | 9571 | 25.1 | ||
| PHC | 29.5 | 9478 | 24.6 | ||||
| 1334127 | 05 March 2003 | 43 GHz | GT | +13.3 | 5.9 | 1855 | 4.1 |
| PHC | +10.2 | 4.6 | 1857 | 4.0 | |||
| 2223052 | 27 December 1999 | 15 GHz | GT | 2.6 | 5074 | 4.6 | |
| ∗GT = gain-transfer; PHC = phase self-calibration assuming zero ; | |||||||
| RLC = separe and self-calibration. | |||||||
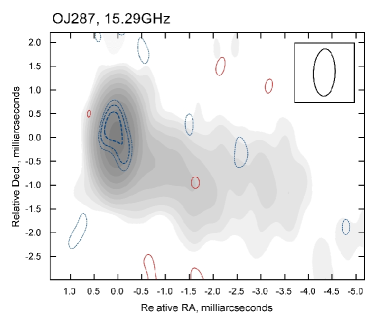
Figs. 1–5 show images of the sources discussed below. The gain-transfer images for all other objects in Table 1 show a single compact feature close to the phase center. Table 4 lists the and peaks and lowest shown levels for the maps. The lowest contours correspond to twice the map rms and the contours increase in steps of a factor of two; the lowest contours correspond to 2.5 times the map rms, and the contours increase in steps of a factor of . In each figure, the convolving beam is shown in a corner of the maps.
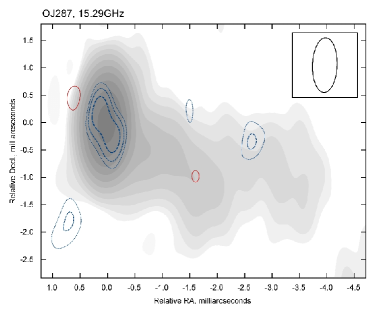
OJ287 (0851+202). Our 15-GHz gain-transfer map for epoch 26 September 2005 is shown in Fig. 1 (left). The distribution is resolved in the direction of the jet, with the peak slightly displaced “upstream” from the peak. When we apply the PHC procedure (Fig. 1, right), the amplitude of the peak is reduced, and a structure symmetrical about the phase center appears, as is expected if the true structure consists of a single component that is shifted from the phase center. Formally speaking, we cannot be sure which peak in the GT image (upstream or downstream) corresponds to the real component; however, since the upstream peak is stronger, this more likely represents the real position of this component. Accordingly, we conclude that there is likely a small, real upstream displacement of the peak in this source.
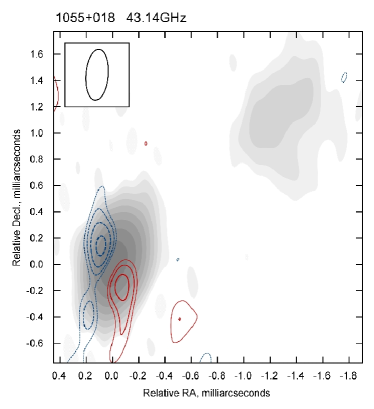
1055+018. Our 15 and 22-GHz gain-transfer maps for this AGN both show point-like distributions that are well centered on the corresponding peaks. In contrast, our gain-transfer image at 43 GHz shows regions of positive and negative CP placed on either side of the innermost VLBI jet (Fig. 2). Spurious antisymmetrical structure of this sort can appear along the VLBI jet in sources with extended structure, due to slight misalignments of the and maps, as is discussed by Homan & Lister (2006). However, the structure observed in 1055+018 is across the jet, and the structure is fairly compact at this frequency. Unfortunately, we cannot test the reality of this structure using the PHC procedure, because this procedure will lead to a cancelling out of the two signals, even if they are real. Thus, we can make no judgement about whether this structure is real or not, although we note that it is somewhat difficult to understand what calibration errors would lead to a transverse misalignment between the and images. If this structure is real, the positive and negative peaks correspond to degrees of circular polarization and , which are within the range of the core CP values at 43 GHz in Table 1.
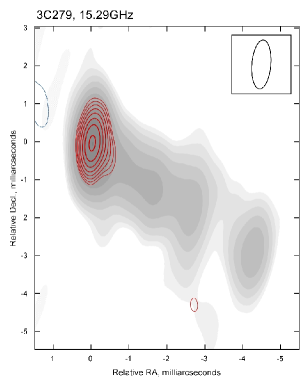
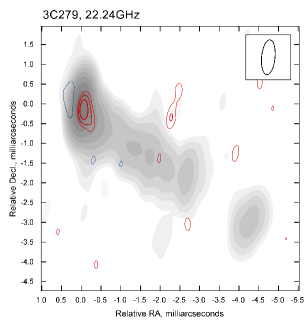
3C279 (1253055). Our 15 and 22-GHz gain-transfer images for 3C279 for epoch 04 March 2003 are dominated by a compact component that is essentially coincident with the peak, but in both, CP is also detected in the inner jet (Figs. 3, top). We estimate the degree of jet CP to be and at 15 and 22 GHz, within the range of core values for at these frequencies.
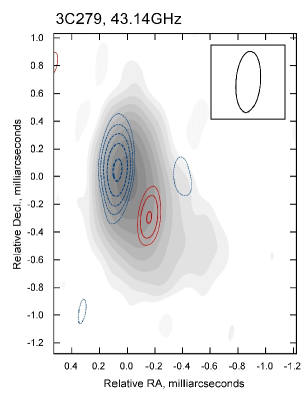
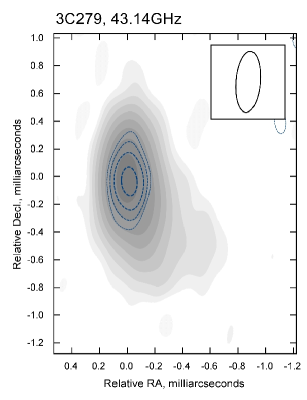
3C279 is probably the single AGN for which the most CP measurements have been made, most of them at 15 GHz. The sign of the 15-GHz CP has been consistently positive (Homan & Wardle 1999, Homan & Lister 2006, Table 1). Both of our 22-GHz measurements also yield positive CP. In contrast, we detected weak positive CP at 43-GHz at epoch 14 March 2003, but negative CP at 43-GHz at epoch 15 March 2005. The gain-transfer image for this last dataset shows a negative component slightly upstream of the peak and a weaker positive component out in the jet (Fig. 3, bottom left). This type of antisymmetric structure along the VLBI jet is consistent with / misalignments, and applying the PHC procedure leads to partial cancellation, leaving only a somewhat weaker negative peak that is well centered on the peak (Fig. 3, bottom right). We note, however, that this does not rule out the possibility that the structure displayed in the bottom left panel in Fig. 3 is real: such a structure could come about if the “core” CP changed sign from positive to negative, while the “jet” CP observed in March 2003 remained relatively stable.
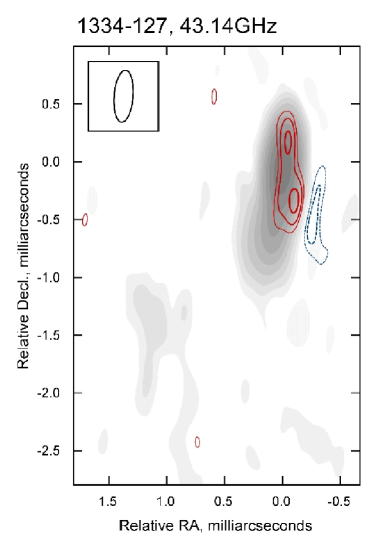
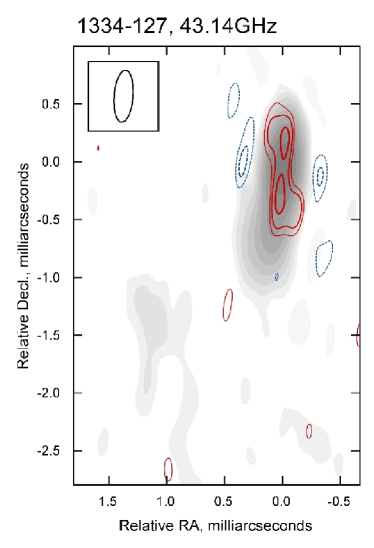
1334127. The 15-GHz parsec-scale CP in this object seems very stable, with the two measurements in Table 2 and the earlier measurement of Vitrishchak & Gabuzda (2007) all agreeing to within much less than the quoted errors: . Our 15-GHz and 22-GHz GT images show compact emission well centered on the phase center. Our 43-GHz GT image shows a double structure with components with the same sign straddling the peak, with the Southern component being somewhat stronger (Fig. 4, left). This structure is reminiscent of what we would expect if there were real CP offset from the peak, but the phases were not fully calibrated, and were overly biased toward values near zero. Application of the PHC procedure produces a very symmetrical structure about the phase center, consistent with the data containing a real CP signal that is shifted from the phase center (Fig. 4, right). Therefore, the 43-GHz CP detection is firm, and includes at least some CP offset from the phase centre, probably to the South of the core (where the peak of the GT map is located); however, we cannot be sure of the distribution of the CP, since residual phase errors may still be present in our GT image. The inferred degree of CP for the peak of the CP distribution, which is located toward the Southwestern edge of the jet, is . Although this is high, it is only about a factor of two higher than the strong jet CP detected in 3C84 (Homan & Wardle 2004).
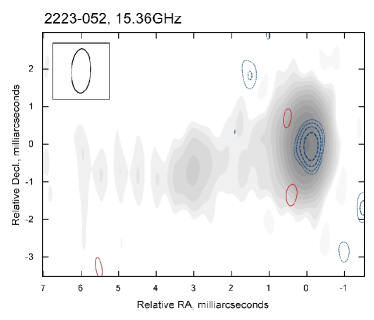
2223052. Our 15-GHz gain-transfer image is resolved along the jet direction, with its peak slightly upstream of the peak (Fig. 5). The shape of the distribution mimics that of the corresonding distribution, suggesting that both include substantial contributions from inner jet emission that is close to the observed core.
4 Discussion
4.1 Location of Detected CP in the VLBI Core Region and Inner Jet
In most cases, the CP we have detected at all frequencies has been coincident with the peak, which should be close to the position of the VLBI core at these frequencies. This is also true of virtually all previous CP measurements (Homan & Wardle 1999, Homan & Lister 2006, Vitrishchak & Gabuzda 2007). This has been taken as evidence that the mechanism generating the CP operates efficiently near the base of the jet, at the surface, where is the optical depth (Homan & Wardle 1999). However, it is important to note that the “core” as the optically thick base of the jet (Blandford & Königl 1979) is a theoretical concept, and will correspond to the observed “core” only for observations with sufficient resolution; the observed VLBI “core” will actually correspond to a combination of the genuine optically thick core and optically thin emission from the inner jet. Thus, the detection of CP coincident with the observed VLBI “core” does not necessarily mean that the signal arises predominantly near the surface. This view is supported by the fact that jet CP has now been directly detected in nine AGN (Homan & Lister 2006, Vitrishchak & Gabuzda 2007, the current paper).
At the same time, our 15 and 22-GHz CP images for OJ287 reveal peaks that are shifted slightly upstream of the peak, with the reality of these shifts demonstrated by our tests using the PHC procedure. The position of the core is frequency-dependent, and will be shifted from the true jet origin in the direction of the VLBI jet (e.g. Lobanov 1998), typically mas at these frequencies. This suggests that the position of the peak is slightly closer to the true jet origin. In general, the location of the peak will depend on magnetic-field strength and electron density; one possibility is that the appearance of the peak slightly upstream of the peak is associated with the imminent birth of a new VLBI component. There is some support for this from a comparison of our 15-GHz linear-polarization map with the MOJAVE linear polarization maps for epochs shortly before and after our own. In particular, the peaks for the two MOJAVE maps preceeding our own 15-GHz observations were 2200 mJy (02 December 2004) and 2040 mJy (03 June 2005), with the core polarization angle close to orthogonal to the jet direction, which lies in position angle ; at our epoch roughly four months later (26 September 2005), the core polarization angle retains this same orientation, but the peak has increased to 3120 mJy; by the following MOJAVE epoch (28 April 2006), the peak had increased to 4570 mJy, and the core polarizaton angle had rotated to a nearly vertical position. By 06 January 2007, the MOJAVE peak had gone back down to 2340 mJy. Thus, it is clear that the core was in the process of undergoing an outburst during our VLBA epoch; we can speculate that the location of the peak slightly upstream of the peak may have been related to this outburst, but time series of CP measurements are needed to determine the likelihood of this scenario.
The idea that the CP detected in the observed VLBI “core” may often be associated with (partially) optically thin regions in the innermost jet is consistent with CP generated by either the synchrotron mechanism or the Faraday conversion of linear to circular polarization. In either case, the CP can be generated to some extent on all scales in the jets, but it is natural that the innermost jet (within the observed VLBI “core”) dominates the CP signal, due to the strong B fields and plasma densities in this region. We have argued recently that the CP is likely generated by Faraday conversion in helical jet magnetic fields, with linearly polarized synchrotron emission radiated at the far side of the jet relative to the observer being partially converted to circular polarization in the near side of the jet (Gabuzda et al. 2008).
| Source | 15 GHz | 22 GHz | 43 GHz | ||||||
| (%) | (%) | (%) | 15–22 | 22–43 | 15–43 | 15–22 | 22–43 | 15–43 | |
| 0133+476 | – | – | – | +0.11 | +0.00 | ||||
| 0851+202 | +0.12 | ||||||||
| 1055+018 | * | – | – | +0.15 | |||||
| 1253055 | +0.37 | ||||||||
| +0.16 | +0.04 | ||||||||
| 1334127 | * | – | – | ||||||
| 1510089 | – | – | – | ||||||
| 1633+382 | – | – | – | +0.09 | |||||
| 2145+067 | – | – | – | ||||||
| 2230+114 | – | – | – | +0.48 | +0.46 | +0.48 | |||
| †All , and values determined after convolution with 15 GHz beam. | |||||||||
| ∗CP possibly detected off core. | |||||||||
4.2 Spectra of the Degree of Polarization
We can define spectral indices for the degree of CP, (), and total intensity, (). Table 5 presents , and for the cores in which CP was detected. We are using as an indicator of the frequency dependence of the degree of CP, independent of the CP sign, and so consider only the magnitude of when determining . In this sense, characterises the frequency dependence of the efficiency of the CP generation.
There is no clear universal trend for the frequency dependence of the degree of circular polarization, although a few patterns can be noted. When CP is detected at 43 GHz, the degree of CP at this frequency is higher than at the lower frequencies. In other words, all the values for between 22 and 43 GHz and between 15 and 43 GHz are positive. We are confident that this result is not due to observational effects. The average value for for the 15-GHz measurements in Table 5 is , while the average at 22 GHz is , and the average at 43 GHz is . This shows clearly that the average degrees of CP at 15 and 22 GHz essentially coincide, while the average degree of CP at 43 GHz is appreciably larger. This demonstrates that, treated as a group, as well as on a source-by-source basis, the 43-GHz values are systematically higher than the values at the lower two frequencies. In contrast, roughly half the values between 15 and 22 GHz are positive and half are negative; i.e., the values are as often higher as lower at 22 GHz compared to 15 GHz.
The ranges for several of the 15–22 GHz values encompass the nominal spectral index expected for intrinsic CP from a homogeneous source in the optically thin regime, . However, given the large range of observed 15–22-GHz values (from +2.38 to ), this may well be a coincidence, particularly since the associated errors are fairly large, and all the cores have intensity spectral indices indicating that they are partially optically thick. The nominal spectrum expected for CP generated by Faraday conversion in a homogeneous source is substantially steeper than any of the observed negative CP spectral indices, .
One way in which it might be possible to obtain a wide range of CP spectral indices for the core region is if there are several regions of CP contributing to the observed “core” CP. If we are observing the sum of two or more CP components, possibly having different signs and somewhat different spectra, this could lead to a fairly wide range of both positive and negative values for , as is observed. There is some basis for this type of picture. For example, Homan & Wardle (2004) found very different values for three CP components in the inner jet of the nearby () radio galaxy 3C84: for a component with positive CP in a predominantly optically thin region and and +1.7 for two components with negative CP in partially optically thick regions. These three regions would all be within the observed “core” if the galaxy were at a redshift more typical of the AGN considered here, and it is possible that we are seeing precisely the effect of such a mixing of contributions from different components in our “core” CP spectra. Both intrinsic CP and CP generated by Faraday conversion in a helical B-field geometry can also have comparably strong regions of CP of different signs in different regions of the jet (e.g. on different sides of the jet; see Fig. 6 of Gabuzda et al. 2008), which could be blended in the observed “core.”
It is also quite possible – even likely – that the frequency dependence for the observed CP is associated to a considerable extent with the intrinsic inhomogeneity of the jets. Wardle & Homan (2003) discuss the approximate frequency dependences that might be expected for a Blandford–Königl (1979) jet under various conditions. Such a jet is essentially self-similar, with the magnetic field and electron density falling off with distance from the jet base as and . This leads to the expectation that, like the observed core total intensity, intrinsic CP from the inner jet should have a roughly flat spectrum; scaling arguments suggest that the expected spectrum for CP generated by Faraday conversion driven by Faraday rotation is also roughly flat. On the other hand, if the unidirectional magnetic field falls off as , which conserves the poloidal magnetic flux, scaling arguments suggest that both intrinsic CP and CP due to Faraday-rotation-driven conversion will have an inverted spectrum, . Physically, this essentially comes about due to the characteristic fall-offs in and with distance from the jet base, combined with the shift of the location of the surface closer to the true jet base with increasing frequency, assuming that the dominant contribution to the CP is made by regions roughly in the vicinity of the surface.
The expected frequency dependence for the case of CP generated by Faraday conversion in a helical B field associated with a Blandford–Königl jet is not obvious. Independent of frequency, the degree of CP will depend on the pitch angle, with the conversion being most efficient for pitch angles near and (i.e. for angles between the “background” and “foreground” components of the helical B field being or ), if the internal Faraday rotation arising in the jet is not too large (Gabuzda et al. 2008). If internal Faraday rotation is substantial, this could either increase or decrease the amount of Faraday conversion, depending on the pitch angle of the jet and whether the Faraday rotation drives the angle between the plane of polarisation for the synchrotron radiation emitted at the back of the jet and the B field at the front of the jet toward or away from (or ). Since, as in the cases of intrinsic CP and CP due to Faraday-rotation-driven conversion, helical-field-driven conversion is governed by the ordered B field, which we suppose to fall off with distance from the jet base more rapidly than the disordered field component, it seems plausible that similar scaling arguments can be applied for the CP generated in this case, giving rise to an inverted spectrum for CP generated roughly in the vicinity of the surface.
In a nutshell, what this means is that it is not easy to definitively distinguish between the synchrotron mechanism and either Faraday-rotation-driven or helical-field-driven Faraday conversion based purely on the observed spectra. This leaves the observed degrees of CP as a possible means of constraining the mechanism at work. It has been argued in previous studies (e.g. Homan & Wardle 2004) that intrinsic CP has trouble explaining the highest observed degrees of circular polarization. The degree of intrinsic CP is
where is a constant that has values ranging roughly from 0.45–1.40 for (as is observed for most of our cores); is the component of the uniform magnetic field that is responsible for generating the circular polarization; is the mean field component in the plane of the sky, which includes both the transverse part of the total uniform magnetic field and any disordered field that contributes to but not ; and is the gyrofrequency for in MHz (Jones & O’Dell 1977; Wardle & Homan 2003). Assuming as fairly reasonable and typical values for AGN with relativistic jets and , we can obtain values up to about 0.40%, 0.30% and 0.25% at 15, 22 and 43 GHz, respectively, for G, consistent with estimates of core magnetic fields derived from the frequency-dependent core shift (Lobanov 1998, O’Sullivan & Gabuzda, in prep.). Thus, while some of the observed values could, in principle, potentially be generated by the synchrotron mechanism, an appreciable number of the observed degrees of CP at all three of our frequencies would require either magnetic fields that were implausibly high, G, or fields that were implausibly well ordered, . The very high degree of CP observed for the VLBI core of 1510089 at 43 GHz, (Table 1), is particularly problematic for the synchrotron mechanism.
Overall, it seems likely that the observed CP is predominantly generated by Faraday conversion, and that the observed values of are determined by effects associated with the intrinsic inhomogeneity of the jets, as well as the possible presence of several regions of CP of either one or both signs contributing to the observed “core” CP. Based on the arguments presented by Gabuzda et al. (2008), we suggest that the predominant mechanism generating the observed CP is helical-field-driven Faraday conversion.
4.3 Sign Changes with Frequency
It has been known for some time that the sign of the CP in a particular AGN is usually stable over several years, or even decades (Homan & Wardle 1999). In contrast, little has been known about the frequency dependence of the CP sign. We have detected CP at more than one frequency in 10 AGN. Of the 9 AGN for which CP is detected at both 15 and 22 GHz, 8 show the same sign at these two frequencies, the exception being 2251+158. Of the 6 AGN for which CP was detected at both 22 and 43 GHz, 4 show sign changes between these two frequencies (0851+202, 1253055, 1510089, 2251+158). The appearance of more frequency CP sign changes in the transition between 22 and 43 GHz appears to suggest optical depth effects; i.e., that the regions being sampled are optically thin between 22 and 43 GHz, but optically thick between 15 and 22 GHz. However, there is no evidence that this transition occurs in our frequency range from the spectral indices (Table 5), which are similar between 15–22 GHz and 22–43 GHz. The values for these two frequency ranges for 0851+202 (OJ287) are +0.12 and ; for 1253055 (3C279) are +0.16 and ; for 1510089 are and ; and for 2251+158 are and .
Previous measurements of the VLBI-core CP of 3C279 at 15 GHz have all showed it be positive (Homan & Wardle 1999, Homan & Lister 2006). Our data likewise show the 15 GHz CP of 3C279 to be positive at epoch 07 August 2002, and the CP at all three frequencies at epoch 04 March 2003. In contrast, the 43-GHz CP had changed to negative two years later, at epoch 15 March 2005. This was accompanied by a substantial weakening of the degree of CP observed at 15 and 22 GHz, suggestive of the growth of a component with negative CP that partially cancelled the previously present positive CP component at the two lower frequencies, and already dominated at the highest frequency. This behaviour could be due to the frequency dependences of the two components (positive and negative), or alternatively to the spatial scales on which they are present. According to the MOJAVE 15-GHz polarization images, this possible development of a negative CP component was accompanied by a substantial brightening of the 15-GHz VLBI core: the 15-GHz peak rose from 9540 mJy/beam on 11 June 2004 to 10,380 mJy/beam on 05 March 2005, then to 12,440 mJy/beam on 15 June 2005, subsequently falling to 10,990 mJy/beam by mid-September 2005. The 43-GHz VLBA monitoring of the Boston University group confirms that there was an outburst in the VLBA core of 3C279 peaking in early 2005, which appears to have been associated with the birth of a new VLBI component in late 2004 (Chatterjee et al., in preparation). This suggests that the inferred appearance of a negative CP component may have been associated with the emergence of this new VLBI component, but this is only speculative at present, due to the limited observational information available.
4.4 Transverse CP Structures
We have found tentative evidence for transverse CP structures in 1055+018 and 1334127 at 43 GHz. Our tests of the reality of the off-core CP in 1334127 using the PHC procedure provide support for the presence of off-core CP, probably slightly South of the core and displaced toward the edge of the jet. The PHC test is unfortunately not suitable for the transverse CP structure in 1055+018, since it consists of features with quite similar intensities and opposite signs located on opposite sides of the jet, nearly symmetrically about the core, and so could come about due to a slight misalignment between the and images. We argue above that it is much more natural for such misalignments to come about in the direction of the jet rather than orthogonal to it, and for this reason we have kept 1055+018 on our list of sources possibly displaying transverse CP structure.
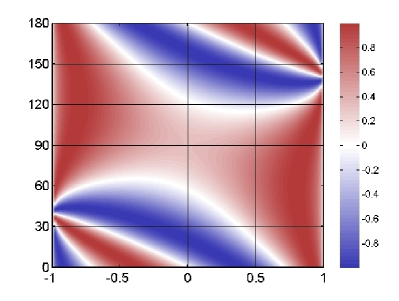
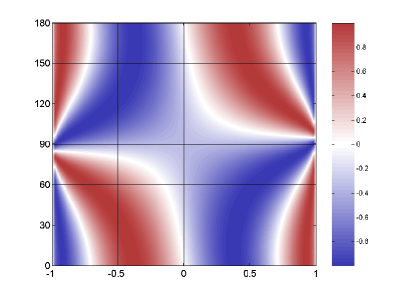
One reason we feel behooved to include our 43-GHz CP map for 1055+018 in this paper, even though we cannot firmly demonstrate that the observed structure is real, is that transverse CP structures such as those our analysis suggest for 1055+018 and 1334127 would come about naturally if the CP is generated in helical jet B fields, independent of whether the CP is due to the synchrotron mechanism or helical-field-driven Faraday conversion. Gabuzda et al. (2008) considered a simple model in which the CP in AGNs is generated by the latter mechanism; the sign of the CP is determined essentially by the angle between the B fields at the far side and near side of the jet relative to the observer, which changes across the jet. Whether the CP is dominated by a single sign throughout the jet cross section or includes contributions of both positive and negative CP on opposite sides of the jet is determined by the pitch angle and viewing angle. This is illustrated in Fig. 6, which shows the sign of CP generated by Faraday conversion in a helical jet B field as a function of the relative location across the jet and the angle at which the jet is viewed in the jet rest frame. A viewing angle of in the observer’s frame corresponds to a viewing angle of in the jet rest frame, where is the jet Lorentz factor; the most likely viewing angle has been estimated to be slightly smaller than this, , which corresponds to a viewing angle in the jet rest frame of about for Lorentz factors thought to be typical of the VLBI jets (). Thus, the jets of core-dominated radio-loud AGN are essentially all observed at rest-frame angles .
In this context, it is interesting that the linear polarization structures of 1055+018 and 1334127 both correspond to the pitch-angle regime that is expected to give rise to the observed transverse CP structure. 1055+018 displays a “spine+sheath” linear polarization structure, with predominantly orthogonal inferred B field along the jet ridge line and longitudinal B field at the jet edges (Attridge et al. 1999, Pushkarev et al. 2005). This type of polarization structure will arise naturally if the jet has a helical B field, if the pitch angle is relatively high and the viewing angle is not too far from in the jet rest frame (Lyutikov, Pariev & Gabuzda 2005); the more symmetrical the CP structure, the closer to a viewing angle of in the jet rest frame. This is precisely the combination of pitch angle and viewing angle that is required in the helical-field CP model to obtain roughly symmetrical regions of positive and negative CP on opposite sides of the jet. 1334127 is one of a minority of AGN classified as BL Lac objects whose inner-jet B fields are predominantly longitudinal, indicating that, if its jet has a helical field, the pitch angle is not greater than about (i.e., the longitudinal component of the helical field is stronger than the toroidal component). Furthermore, the field is predominantly longitudinal in the VLBI core: quasi-simultaneously optical and 15+22+43-GHz VLBA polarization observations showed that the optical and Faraday-rotation-corrected VLBI core polarization angles were aligned to within , with both being orthgonal to the jet direction (Gabuzda et al. 2006); since the optical emission is clearly optically thin, this implies a longitudinal core B field. Thus, the observed transverse CP structure in 1334127 is also consistent with its linear polarisation structure: the simple helical-field CP model of Gabuzda et al. (2008) predicts that CP of a single sign that is displaced toward one edge of the jet should be observed for jets whose helical fields have pitch angles somewhat less than and are viewed at angles not too different from in the jet rest frame.
Thus, our CP images for 1334127 and 1055+018 provide tantalizing evidence that a self-consistent picture of the observed intensity, linear polarisation and circular polarisation structures may be beginning to emerge. While this is somewhat speculative at the moment, these results certainly indicate the value of further high-resolution CP measurements, as well as the development of further techniques for testing the reality of tentatively detected transverse structures.
5 Conclusion
We have presented the results of parsec-scale circular polarization measurements for 41 AGN at 15+22+43 GHz and an additional 18 at 15 GHz alone. We have detected parsec-scale CP in 8 sources for the first time, and confirm previous detections in an additional 9 objects. In all 7 AGN in which 15-GHz CP was detected in both our measurements and in the MOJAVE first-epoch measurements (Homan & Lister 2006), the signs of the CP agree, demonstrating that a consistent picture is beginning to emerge from the collected results.
The first-epoch MOJAVE measurements revealed the presence of jet CP in five AGN (3C84, 3C273, 2128123, 2134+004 and 2251+158). Vitrishchak & Gabuzda (2007) reported the presence of jet CP in 1334127 and 3C279, and we have confirmed jet CP in these objects and added 2223052 to this list.
These are among the very first multi-frequency VLBI CP measurements. We have measured CP at more than one frequency for 10 of the 41 AGN. No simple picture of the frequency dependence of the CP emerges. For example, comparable numbers of the AGN displaying measureable CP at both 15 and 22 GHz display higher values at the higher or lower of these frequencies. At the same time, there is a clear tendency for the degrees of CP to be higher at 43 GHz than at the two lower frequencies. While virtually all the signs for the CP measured at 15 and 22 GHz agree, the sign of the observed core-region CP often changes between 15/22 and 43 GHz (in 4 of 6 sources). This suggests the action of optical-depth effects, or some other mechanism giving rise to a systematic change in the CP sign with distance from the jet base.
None of the observed CP spectra correspond in a straightforward way to the frequency dependence expected for either intrinsic CP or CP generated by Faraday conversion operating in a homogeneous source, which both predict that the CP should decrease with increasing frequency. The fact that we have found to increase with frequency in several sources, and to universally be higher at 43 GHz compared to our lower frequencies, is intriguing in light of the scaling arguments presented by Wardle & Homan (2003), which point out that CP from either synchrotron radiation or Faraday conversion in a Blandford–Königl jet could have an inverted CP spectrum, . This suggests that our measurements are probing scales on which the intrinsic inhomogeneity of the jet plays an appreciable role in determining the observed CP and its spectrum. In addition, the picture may be complicated by the fact that the core CP measurements may represent the superposition of CP contributions from several different regions in the core and innermost jet, as has been directly observed in the nearby radio galaxy 3C84 (Homan & Wardle 2004).
Although we cannot distinguish between various CP-generation mechanisms based on the observed spectra, we argue, as have previous authors, that the synchrotron mechanism has trouble explaining the growing number of measurements indicating degrees of CP of the order of 1% or more. Therefore, it remains most likely that the detected CP is generated primarily by Faraday conversion (possibly with a smaller contribution by the synchrotron mechanism in some objects). Gabuzda et al. (2008) have argued that the CP is generated predominantly by Faraday conversion in helical B fields inherently associated with the jets.
We have found tentative evidence for transverse structure in the CP distributions of 1055+018 and 1334127. In fact, transverse CP structures of the sort observed in 1334127 and tentatively detected in 1055+018 would come about naturally if the CP is generated in helical jet B fields. Further, this is true for both intrinsic CP and CP generated by helical-field-driven Faraday conversion. In contrast, CP generated in jets in which the unidirectional B field giving rise to the CP is longitudinal would display transverse structure only by chance, due, for example, to bending of the jets. We thus consider the transverse CP structures tentatively revealed by these first 43-GHz CP measurements to provide further supporting evidence for the hypothesis that the CP of compact radio-loud AGN is closely tied to helical B fields that are organically related to the jets.
The interesting and unexpected new results we have presented here indicate that further CP analyses at 22 and 43 GHz are very worthwhile, despite the techical difficulties they present (weaker source fluxes, higher noise levels, particularly at 43 GHz). Further high-resolution observations for additional AGN will indicate how common transverse CP structures really are, and, in the case of symmetrical transverse CP structures with opposite signs on opposite sides of the core region, more conclusively demonstrate their reality. One possibility in this regard will be if similar structures can be detected further from the core, as the reality of these can be tested directly using the PHC procedure described above and by Homan & Lister (2006).
6 Acknowledgements
We thank T. V. Cawthorne for useful discussions of this work, as well as the anonymous referee for comments that were clear, very helpful and submitted in a timely fashion.
References
- dummy (1893) Beckert T. & Falcke H. 2002, A&A, 388, 1106
- dummy (1893) Blandford R. D. & Königl A. 1979, ApJ, 232, 34
- dummy (1893) Homan D. C., Attridge J. M. & Wardle J. F. C. 2001, ApJ, 556, 113
- dummy (1893) Homan D. C. & Lister M. L. 2006, AJ, 131, 1262–1279
- dummy (1893) Homan D. C. & Wardle J. F. C. 1999, AJ, 118, 1942
- dummy (1893) Homan D. H. & Wardle J. F. C. 2004, ApJ, 602, L13
- dummy (1893) Jones T.W. 1988, ApJ, 332, 678
- dummy (1893) Jones T.W. & O’Dell S.L. 1977, ApJ, 214, 522
- dummy (1893) Legg M.P.C. & Westfold K.C. 1968, ApJ, 154, 499
- dummy (1893) Lister M. L. & Homan D. C. 2005, AJ, 130, 1389
- dummy (1893) Lobanov A. 1998, A&A, 330, 79
- dummy (1893) Lyutikov M., Pariev V. & Gabuzda D. C. 2005, MNRAS, 360, 869
- dummy (1893) Pacholczyk A. G. 1970, Radio Astrophysics (San Francisco: Freeman and Co.)
- dummy (1893) Vitrishchak M. V. & Gabuzda D. C. 2007, Astron. Rep., 51, 695