Environmental Effects on Satellite Galaxies: The Link Between Concentration, Size and Colour Profile
Abstract
Using the SDSS DR4 group catalogue of Yang et al. (2007), we investigate sizes, concentrations, colour gradients and surface brightness profiles of central and satellite galaxies. We compare central and satellite galaxies at fixed stellar mass, in order to disentangle environmental from stellar mass dependencies. Early and late type galaxies are defined according to concentration. We find that at fixed stellar mass, late type satellite galaxies have smaller radii and larger concentrations than late type central galaxies. No such differences are found for early-type galaxies. We have also constructed surface brightness and colour profiles for the central and satellite galaxies in our sample. We find that late-type satellite galaxies have a lower surface brightness and redder colours than late-type central galaxies. We show that all observed differences between satellite and central galaxies can be explained by a simple fading model, in which the star formation in the disk decreases over timescales of 2-3 Gyr after a galaxy becomes a satellite. Processes that induce strong morphological changes (e.g. harassment) and processes that strip the galaxy of its entire ISM need not to be invoked in order to explain the environmental dependencies we find.
keywords:
galaxies: cluster: general – galaxies: statistics – galaxies: haloes – galaxies: evolution – galaxies: structure – galaxies: fundamental parameters1 Introduction
It is well known that the properties of galaxies residing in dense regions are different from galaxies in the field. Group and cluster galaxies have been found to have redder colours, to be of earlier morphological type, and to have a smaller specific star formation rate compared to more isolated galaxies (e.g. Dressler 1980; Postman & Geller 1984; Poggianti et al. 1999; Balogh et al. 2004a and many other studies). Various physical mechanisms leading to the environmental dependencies of galaxy properties have been suggested, most of which should only act on satellites galaxies (galaxies which are not the most massive, central galaxy in their group). Satellites may lose their extended gas halo (a process called ‘starvation’ or ‘strangulation’, Larson, Tinsley & Caldwell 1980; Balogh, Navarro & Morris 2000), or the very outer part of their gas disk by interaction with the intragroup medium or the gravitational potential of the group. This affects the fuel for future star formation and is expected to lead to a slow decline of star formation, on timescales of 2 Gyr. Alternatively, ram-pressure may strip galaxies of a significant fraction of their cold interstellar medium, which is the fuel for current star formation and is much harder to remove (Gunn & Gott 1972; Quilis, Moore & Bower 2000). This would lead to a rapid truncation of star formation. Neither of theses processes, however, are expected to significantly alter the morphologies or stellar mass profiles of satellite galaxies. These may be disturbed by high-speed encounters with other satellites (Moore et al. 1996) or by interactions with the tidal field of their parent halo. On the other hand, the distribution of galaxy stellar masses varies with environment, shifting to higher masses in regions with increasing local density or decreasing group-centric radius (e.g. Balogh et al. 2001; Bamford et al. 2008; van den Bosch et al. 2008b). If no binning in stellar mass is done, this effect accounts for part of the environmental dependencies observed, due to the strong correlation between galaxy properties and stellar mass (Kauffmann et al. 2003).
Recently, it has been found by various studies that the environmental effects on the specific star formation rates, and hence galaxy colours, are more fundamental than the effects on morphological indicators (Kauffmann et al. 2004; Blanton et al. 2005a; Ball, Loveday & Brunner 2008; van den Bosch et al. 2008a; but see also Park et al. 2007). For example, galaxies in different environments which have the same colours do not show much difference in their morphological indicators, while a colour difference persists between galaxies in different environments which have a similar morphology (e.g. Blanton et al. 2005a).
Nevertheless, it is well established that the environment does have an effect on morphological indicators. Also, it has been been found that galaxies in dense regions might have slightly decreased radii compared to their counterparts in less dense regions (Blanton et al. 2005a; Kauffmann et al. 2004; but see Park et al. 2007). In this paper, we will quantify environment to first order by discriminating central and satellite galaxies, following van den Bosch et al. (2008a, b), which is well motivated, as explained above. We will also study how satellite galaxy properties are affected by the mass of their host halo, which is a physically better motivated estimator of environment than the local density, see discussion in Weinmann et al. (2006a). For the first time, we show clearly that late type satellite galaxies are smaller in size than late type centrals. We also address two important outstanding questions regarding the connection between galaxy morphology and environment.
First, we would like to understand in more detail how environment affects morphological indicators of galaxies. It has been found that satellite galaxies are, on average, slightly more concentrated than centrals at fixed stellar mass (van den Bosch et al. 2008a). However, is this because a relatively small fraction of satellite galaxies are transformed into elliptical galaxies by dramatic environmental processes? Or does it mean that more subtle processes weakly increase the bulge-to-total luminosity for a majority of satellites? Insight into these questions can be gained by investigating the full distribution in morphological indicators of central and satellite galaxies. This is done in section 3.1 for the concentration index. We present evidence that elliptical galaxies are not produced by environmental effects.
Second, we investigate the origin of the difference in morphological indicators between central and satellite galaxies. Two basic scenarios seem possible. First, environmental processes may affect the stellar mass distribution in satellite galaxies, rendering them more compact. This could for example occur by disk instabilities induced by the potential of the group, tidal stripping of the outer stellar disk etc. The second option is that the stellar mass distribution is not affected and that it is the light distribution which changes. If the star formation rate in a galaxy decreases, the disk fades due to ageing of the stellar population. Since this effect is expected to be weaker in the central, older regions of the galaxy, this naturally leads to an increase in the bulge-to-total luminosity. To find out which possibility is more likely, we study the surface brightness profiles, colour profiles and stellar mass profiles in section 3.4. We find indications that the differences between central and satellite galaxies can entirely be explained by a decreased star formation rate in satellites, which affects the shape of the surface brightness profile. Using stellar population synthesis models, we also show that a slow decline in the star formation rate, like in the ‘starvation’ scenario, fits our data best.
In section 2 we present our data set and the associated group catalogue, assess the completeness of our satellite sample, explain our weighting scheme and discuss morphological indicators. In section 3 our results are presented. In section 4 we attempt to understand the colour profiles of satellite galaxies using a stellar population synthesis model. A discussion of our results, and comparison with previous studies, is presented in section 5, followed by a summary in section 6. Throughout this paper, all magnitudes, stellar masses, sizes etc. are scaled according to and have to be changed accordingly when is varied. The only exception are halo masses, which are given in to facilitate comparisons to results in our previous papers. The abbreviation ‘log’ refers to a 10-based logarithm.
2 Data
The analysis in this paper is based on the SDSS DR4 galaxy group catalogue of Yang et al. (2007, hereafter Y07). This group catalogue has been constructed by applying the halo-based group finder of Yang et al. (2005) to the New York Value-Added Galaxy Catalogue (NYU-VAGC; see Blanton et al. 2005b). From this catalogue, Y07 selected all galaxies in the Main Galaxy Sample with an extinction corrected apparent magnitude brighter than , with redshifts in the range and with a redshift completeness . Additionally, 7091 galaxies have been included which have SDSS photometry but with redshifts taken from alternative surveys, which results in a total number of galaxies included in the group catalogue of 369,447. We use Petrosian magnitudes and colours (Strauss et al. 2002), corrected for galactic extinction (Schlegel, Finkbeiner & Davis 1998) and k+e-corrected to , using the method described in Blanton et al. (2003b). Stellar masses are computed using the relations between stellar mass-to-light ratio and colour given by Bell et al. (2003), following van den Bosch et al. (2008a). Halo masses for each identified galaxy group were calculated based on the ranking in the total characteristic stellar mass (see Y07 and references therein for details). No halo masses have been obtained for a subset of 66,263 galaxies, however, these galaxies are also included in what follows.
We have checked whether employing an alternative stellar mass estimate affects our results by repeating part of our analysis using the publicly available stellar masses for the SDSS DR4 obtained by Kauffmann et al. (2003), who use spectral information rather than colours and luminosities to obtain the stellar mass-to-light ratio. No significant differences were found in our results.
We use Petrosian half-light radii as given in the SDSS. If not otherwise specified, and the terms ‘size’ and ‘radius’ refer to the physical Petrosian half-light radius in the -band, in kpc. Following Shen et al. (2003), we have excluded all galaxies with an -band surface brightness mag and all galaxies with Petrosian half-light radii in the -band below 1.6 arcseconds from our sample. The latter criterion affects a significant number of galaxies and is motivated by the following two points. First, as galaxy sizes approach the size of the seeing disk (with a median seeing in the SDSS DR4 of 1.4 arcseconds, Adelman-McCarthy et al. 2007), flux measurements are affected, as shown in Blanton et al. (2001). Second, very compact galaxies might be misclassified as stars, although this should only happen in rare cases (Strauss et al. 2002). Unlike Shen et al. 2003, we do not exclude galaxies with apparent magnitudes brighter than , since this only affects a very small fraction of the galaxies in our sample. We have checked that applying this additional criterion does not lead to any visible changes in our figures. Another difference to the analysis by Shen et al. (2003) is that we restrict our analysis to galaxies with stellar masses above log()=9.75. At masses below this limit, the actual distribution of the radii of early type galaxies is expected to contain a significant contribution from very small galaxies (with radii below 0.5 kpc), as visible in Fig. 10 in Shen et al. (2003). These very small galaxies only make it into our sample if they are at redshifts below z=0.02, where statistics is insufficient to give meaningful results. We also apply this cut to our late type galaxies to have a consistent lower stellar mass cut in the entire sample.
After applying all the selection criteria listed above, our sample of group galaxies consists of 275,890 galaxies, of which 47,433 are satellites. This means that most of our sample galaxies are centrals which do not have satellites that are bright enough to be detected. Of the satellites galaxies, approximately 1/4 resides in clusters, i.e. groups with dark matter masses above .
2.1 Completeness of Satellite Sample
In order to check the completeness and contamination of our satellite/central samples, we make use of a group catalogue that has been built from a mock galaxy redshift survey (MGRS) which mimics the SDSS DR4. Only luminosities, and not stellar masses, are used for this test, but we expect this to have little influence on the final results. The MGRS is constructed by populating dark matter haloes in numerical simulations of cosmological volumes with galaxies according to the conditional luminosity function (CLF) as described in Cacciato et al. (2008) and Yang et al. (2008). By construction, the MGRS has the same luminosity function and clustering as a function of luminosity as the galaxies in the SDSS. The same MGRS has also been used in Y07 to test the performance of the group finder; more detailed results on the contamination and completeness of the group catalogue we have used in our analysis can be found there.
Here, we check the completeness and contamination of our satellite and central samples. Completeness is the fraction of satellites (resp. centrals) in the redshift survey which are correctly identified as such by our group catalogue. Contamination is the fraction of satellite (resp. central) galaxies in our group catalogue which were falsely identified as such and are centrals (satellites) in reality. We find that our satellite sample is 87 % complete and has a contamination of 23 %. The sample of central galaxies, on the other hand, is 95 % complete and has a contamination of 3 %. The incompleteness of the satellite sample is caused by misclassification of satellites as centrals, either because the entire group has not been identified as such, or because the group finder underestimates the size of a group and does not include satellites which are far away from the center. The contamination of the satellite sample is caused by the inclusion of (isolated) central galaxies as group members, which can happen if they reside in the vicinity of a group, especially along the line of sight. The incompleteness of the central galaxy sample mainly originates from events where the group finder is merging two separate groups into one. The contamination of the central galaxy sample is caused by the group finder occasionally breaking up one group into smaller units. These issues are also discussed in Y07.
In principle, it would be simple to correct the average of some parameter for the satellite or central sample for contamination. Incompleteness is not an issue here, since we can assume that the galaxies lost to our central or satellite sample are not different in their properties than those which we have identified correctly. Let us assume that we have obtained some average quantity and in our analysis, while and are the averages for the (hypothetical) uncontaminated central and satellite sample. Then, given a contamination of the satellite sample and a contamination of the central population,
| (1) |
| (2) |
It is then straightforward to find that
| (3) |
and
| (4) |
Making the approximation that the central sample is 100 % complete, we find that ), meaning that all differences between some average quantity for satellites and centrals can be expected to be higher by around 30 % in reality than in what we will find in our analysis. It would be simple to correct for contamination in what follows. However, the degree of contamination occurring in reality is unfortunately rather uncertain, since it varies with stellar mass and luminosity and has also been found to be depend on the type of MGRS used. A discussion of these issues is beyond the scope of this paper. We choose to present all results uncorrected for contamination. However, we caution the reader to bear in mind that we likely underestimate the difference between the properties of central and satellite galaxies by around 30 %.
2.2 Treatment of Selection Effects
In order to model the selection function of the survey, we give each galaxy a weight which is inversely proportional to the maximum volume out to which it can be observed. This maximum volume depends on the absolute magnitude of the galaxy, its physical size and its surface brightness. We largely follow Shen et al. (2003) in our calculation of the galaxy weights. First, we calculate the maximum redshift and luminosity distance out to which a galaxy with apparent -band magnitude and an effective flux limit can be observed:
| (5) |
where is the luminosity distance. Next, we calculate the maximum angular diameter distance out to which a galaxy with angular Petrosian half-light radius can be resolved given a lower limit on the angular size of 1.6 ”:
| (6) |
and . We also calculate the maximum redshift out to which a galaxy with surface brightness can be observed given the limit in surface brightness of 23.0 mag and taking into account cosmological surface brightness dimming proportional to :
| (7) |
We obtain the maximum redshift out to which a galaxy can be seen with
where is the redshift limit of our sample, as mentioned above. For a flat cosmology, the maximum volume111Note that we do not use the “conditional” maximum volume like Shen et al. (2003), since we do not examine the dependence of galaxy size on luminosity. out to which a galaxy can be observed is then
| (8) |
2.3 Quantitative Morphological Indicators
One of the galaxy properties we intend to study in this work is morphology. Different indicators of morphology have been used in past studies to classify galaxies in the SDSS. The ones regarded as the most reliable are probably eyeball classification and bulge-to-total luminosity ( hereafter), which are not easily obtained for large samples of galaxies (but see Lintott et al. 2008; Allen et al. 2006). The morphological indicators which are most widely used are the Sérsic index and concentration , both publicly available for the SDSS. Below, we discuss the properties of those two morphological indicators and test their correlation with .
2.3.1 Comparing Concentration and Sérsic index
In the SDSS, the concentration is defined as the radius containing 90 % of the Petrosian flux divided by the radius containing 50 % of the Petrosian flux of a galaxy. As shown by Strateva (2001), Nakamura et al. (2003) and Shimasaku et al. (2001), concentration can be used to roughly distinguish between early type and late type galaxies, at least for the relative massive and luminous galaxies we use in this study. Note that as given in the SDSS is not seeing corrected. The Sérsic index , on the other hand, is a measure of the shape of the surface brightness profile , which can be fitted with
| (9) |
according to Sérsic (1968). Pure disk galaxies with their exponential profile mostly fall into the peak around =1, while the meaning of becomes more unclear as it increases. Blanton et al. (2005a) applied a 1-dimensional Sérsic fit to the azimuthally averaged surface brightness profiles of the NYU-VAGC galaxies, accounting for the effects of seeing. Thus, they obtained Sérsic indices and also derived Sérsic half-light radii for the galaxies in their sample222The Blanton et al. (2003a) Sérsic indices and sizes used by Shen et al. (2003) were partially incorrect and have been corrected in Blanton et al. (2005a)..
In Fig. 1, we show the concentration parameter (left panel) and the Sérsic index according to Blanton et al. 2005a (right panel), plotted against for a sample of 852 face-on ( 0.9), 0.02 0.07, morphologically undisturbed, galaxies. Their has been obtained by Gadotti (2008), using a 2-dimensional bulge/disc/bar decomposition and a bulge profile with variable , and is seeing corrected. Clearly, the correlation between and is significantly better than between and . See Gadotti (2008) for a more detailed analysis.

The poor correlation of with indicates that is a better proxy of galaxy morphology. However, as mentioned before, is not corrected for seeing effects. To test the effect of seeing on concentration, we create a subsample of galaxies with physical sizes between 3 and 4 kpc, with masses above log=10.8 and with mag . For this subsample, we are complete up to . We find that while the average angular sizes decreases from 4.5 times the seeing to only 1.4 times the seeing between a redshift of 0.025 and 0.1, the average concentration changes by less than 2 %. This indicates that even when the angular size of the galaxy approaches the seeing, the average concentration does not seem to be strongly affected. We have also checked the correlation of the seeing-corrected derived from the Sérsic fits given by Blanton et al. (2005a) with and found that the correlation is similar to the one of with .
Since the galaxies in the sample shown in Fig. 1 are all face-on, low- galaxies, we cannot exclude the possibility that is superior to for inclined and distant galaxies. However, we are not aware of any reason why this would be the case, especially since seeing seems to have only a minor effect. We thus conclude that is likely to be a better estimator of morphology than and we will use throughout our paper.
2.3.2 The Effects of Inclination on Morphological Classification
Both and are affected by inclination (e.g. Maller et al. 2008; Bailin & Harris 2008). In particular, late-type galaxies which are viewed edge-on often have values of and typical of early type galaxies. For this reason, Maller et al. (2008) imposed an additional criterion on the axis ratio, , classifying all galaxies with as late types. The disadvantage of this approach is that edge-on S0 galaxies will be counted as late types, while face-on S0 galaxies will generally be counted as early types. The same may apply to other disk galaxies with a large bulge component.
Edge-on disk galaxies are significantly reddened, and their luminosities, sizes and stellar masses might be biased with respect to galaxies viewed face-on (e.g. Maller et al. 2008; Shao et al. 2007; Driver et al. 2007). Therefore, one could also consider removing all galaxies with high inclination from the sample. However, galaxies with make up more than half of all the late type galaxies in our sample. Therefore, our standard approach will be to keep the edge-on galaxies in the sample. We will also in general not use as a criterion for discriminating early and late type galaxies. But we will report on how making these alternative cuts changes our results in what follows.
3 Results
In this section, we compare the properties of central and satellite galaxies in our sample at fixed stellar mass in order to probe the influence of satellite-specific environmental processes on galaxies. This comparison is based on two assumptions. First, we assume that statistically speaking, the properties of a galaxy of fixed stellar mass are independent of redshift, at least in the redshift range where most of today’s satellites have been accreted. Second, we assume that a galaxy does not significantly change its mass after becoming a satellite. Under these assumptions, comparing satellite galaxies of today to equally massive central galaxies of today is equivalent to comparing satellite galaxies of today to their progenitor central galaxy population at some (slightly) higher redshift. See van den Bosch et al. (2008a) for a more extensive discussion of the validity and the implications of these assumptions.
3.1 The Different Properties of Satellite and Central Galaxies
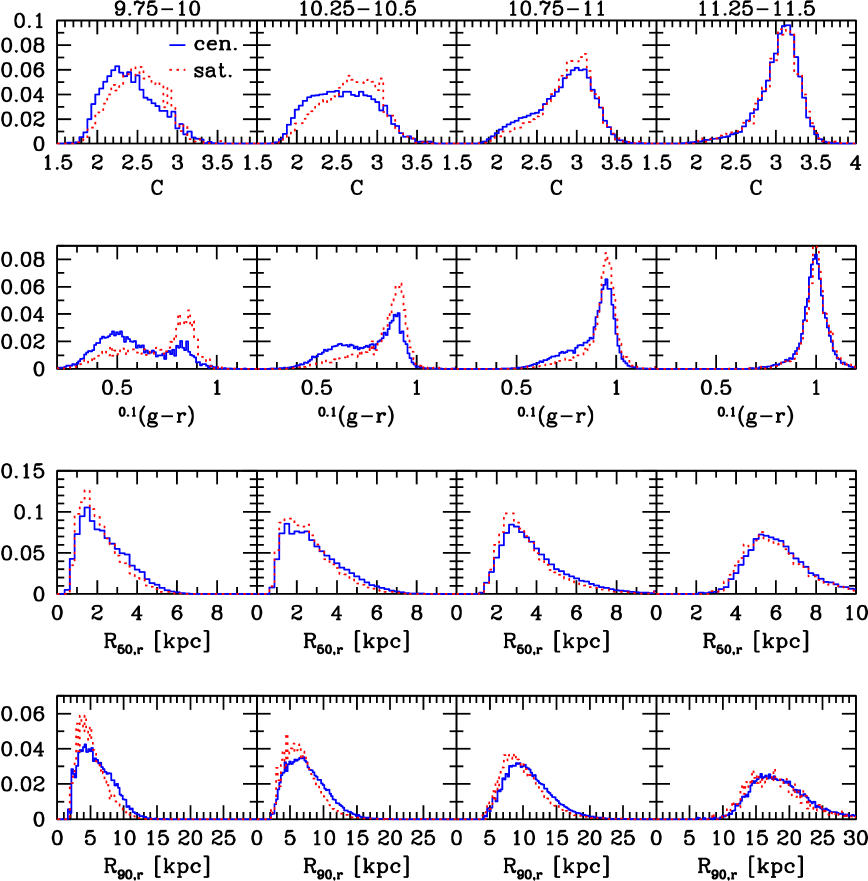
In Fig. 2, we show weighted distributions of the concentration, colour, and (the physical radius containing 90 % of the Petrosian -band flux) in four different narrow stellar mass bins for central and satellite galaxies. It can be seen nicely how satellite galaxies are more concentrated, redder and smaller both in and than central galaxies, and how the differences decrease towards higher stellar masses, where both central and satellite galaxies are red and concentrated.
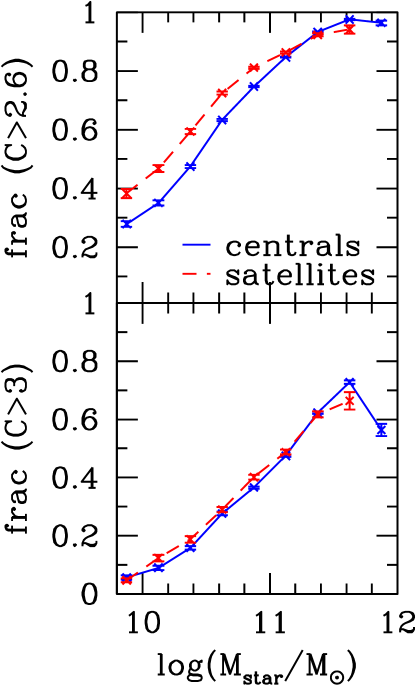
The difference in concentration between satellite and central galaxies is particularly interesting, as discussed in the introduction. Three different regimes can be identified in the three lowest mass bins. Between a concentration of 1.5 and 2.5, the abundance of satellite galaxies is decreased compared to central galaxies. Between a concentration of 2.5 and 3, it is enhanced. Above concentrations of , the abundance of central and satellite galaxies is the same. In order to further investigate this finding, we show in Fig. 3 the fraction of galaxies with for centrals and satellites as a function of stellar mass (top panel), compared to the fraction of galaxies with as a function of stellar mass (bottom panel). While we find that the fraction of galaxies is larger for satellites than for centrals up to a stellar mass of =11, no significant difference is found for the fraction of galaxies with at all stellar masses. These findings have important implications. First, it seems that high concentration galaxies (, which may be identified with a population dominated by elliptical galaxies) are not generally produced by satellite-specific processes. Second, only galaxies seem to be affected by environmental effects. It is consistent with our findings that the concentration of a relatively large fraction of these galaxies is mildly enhanced after they become satellites. We find no evidence for violent processes dramatically altering the concentrations of satellites: After all, the environmental processes are not strong enough to make concentrations reach .
Another interesting point visible in Fig. 2 is that the difference between satellite and central galaxies steadily decreases with increasing stellar mass, and not only because galaxies in general become more highly concentrated. In the highest stellar mass bin, the distribution in concentration, down to low concentration, is the same for satellite and central galaxies. This may indicate that such massive galaxies are not susceptible to environmental effects changing their concentration, even if they are disk galaxies.
Motivated by the results described above, we decide to use =3 as a discriminator between galaxy types. In all of what follows, galaxies with will be called ‘late types’ and galaxies with ‘early types’. Note that in this way, our ‘early type’ - ‘late type’ division also corresponds to a division into those galaxies which can be affected or produced by satellite-specific processes, and those which cannot. Using has also been suggested by Shimasaku et al. (2001) and is slightly higher than the cut used for discriminating early and late type galaxies in most other studies.
3.2 The stellar mass-size relation
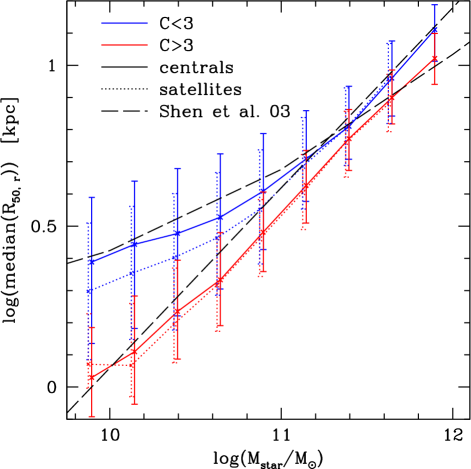
Fig. 4 shows the median -band Petrosian half-light radius as a function of stellar mass for late and early type galaxies. The sample is additionally split into central and satellite galaxies. We find that for late type galaxies, the median radius at fixed stellar mass is slightly smaller (by up to 20 %) for satellites compared to centrals. No difference is found between the radii of early type centrals and satellites, indicating that the radii of galaxies remain unchanged when they become satellites. The errorbars denote the regions where 68 % of the measured galaxy sizes lie for each stellar mass bin. For comparison, the black dashed lines show the fits presented in Shen et al. (2003, 2007) for the entire galaxy population. While the trends are similar, our median sizes are clearly smaller than those found by Shen et al. (2003). However, an offset is expected since we have used a different size measurement, different stellar mass estimates and also a different morphological division.
We have carried out a series of tests to check whether our result that late type satellites are smaller than late type centrals is robust. We do not show the results of these tests here, but describe them below. As a first test, have verified that our results do not change qualitatively if we divide the sample at , or instead of at . However, we find that the median sizes of both early and late type galaxies can vary by up to 25 % depending on how we split the sample into early and late types. On the other hand, if we use the Sérsic -band radius (as done by Shen et al. 2003) instead of the Petrosian -band radius, the radii only increase weakly, by less than 10 %. Additionally, we have also verified that our results do not change significantly if we use the -band or -band Petrosian half-light radii.
We also check what happens if we include a cut in the axis-ratio to discriminate between early and late type galaxies (again, not shown here). Following Maller et al. (2008), we classify all galaxies with as late types, irrespective of their concentration. The justification for this is that such galaxies have to be disk-like. This results in a weak decrease (of up to 7 %) of the median sizes of late type galaxies, but does not change our result regarding the size differences between central and satellite late type galaxies. Further tests indicate that edge-on late type galaxies have systematically lower physical half-light radii compared to face-on late type galaxies at the same stellar mass. This could be related to the increased importance of dust in edge-on galaxies or to the fact that a spherical aperture is used for a strongly elongated structure. Another explanation could be that stellar masses of edge-on galaxies might be incorrect (although Maller et al. (2008) claim that this is not likely to be the case for the Bell et al. (2003) masses).
As found e.g. by von der Linden et al. (2007), the overestimation of the sky background in the SDSS images will lead to an underestimation of both the Sérsic and Petrosian half-light radii. Guo et al. (2008, in prep.) claim that massive early type galaxies have their Sérsic radii underestimated by 10 - 50 % due to this issue. This problem is present throughout our analysis and also in Shen et al. (2003); one should therefore bear in mind that the real galaxy half-light radii are slightly higher than reported in these studies, especially for massive galaxies (see also Graham & Worley (2008) who use effective radii instead of half-light radii and find a steeper size-luminosity relation for early type galaxies). It is known that the problems with sky subtraction are more severe in dense regions (e.g. von der Linden et al. 2007), and therefore, the smaller sizes for the late type satellites could in principle be a spurious effect, coming from the fact that satellites tend to reside in overdense regions. In order to test this, we have repeated our analysis using the -band half-light radii within the 23 mag isophote obtained with an improved sky subtraction by von der Linden et al. (2007). We find the difference between the sizes of late type central and satellite galaxies to be unchanged; therefore, we conclude that sky subtraction do not significantly affect our results.
3.3 Average difference between satellite and centrals
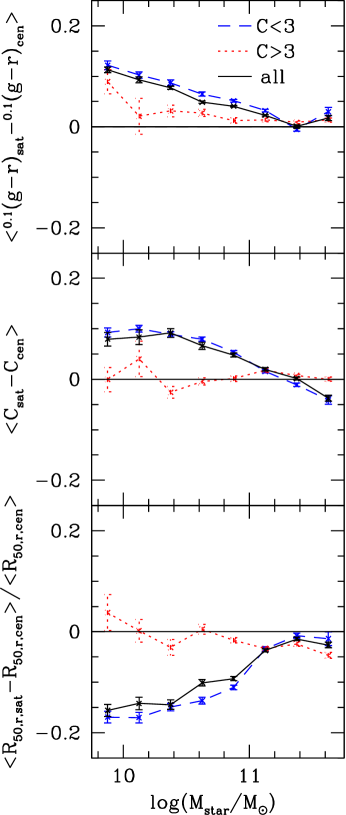
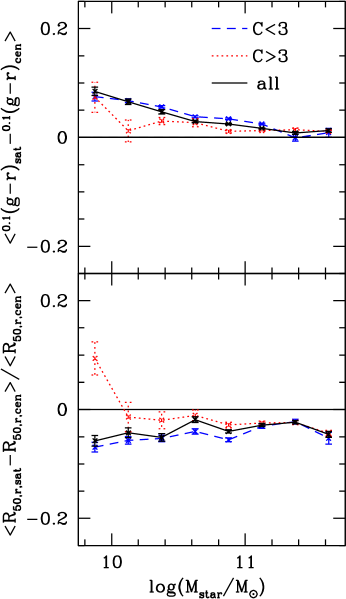
In the previous section, we have shown that the median radius for satellite and central galaxies differ for late type galaxies. We now investigate how this difference in is connected to the differences in and between satellite and central galaxies. In order to test this, we employ the same method as used in van den Bosch et al. (2008a). For each central galaxy in our sample, we first pick a random satellite galaxy with the same stellar mass (), and type (according to concentration). We then calculate the average difference in radius, colour and concentration for these central-satellite pairs. The weighting scheme described in section 2.2 is applied here as well: we simply give each satellite-central pair a weight proportional to the product of the two weights. The result is shown in Fig. 5 by the dashed (blue) and dotted (red) lines. The black lines show the average difference between central-satellite pairs which have the same stellar mass, but do not have to be of the same morphological type. In agreement with van den Bosch et al. (2008a), we find that colours of satellite galaxies are slightly redder than the colours of central galaxies at fixed stellar mass (top panel of Fig. 5). Interestingly, this is the case for both early and late type galaxies, with the effect being slightly stronger for the late types. For late type galaxies, satellite galaxies have a slightly higher concentration than central galaxies, while no such effect is seen for the early type galaxies (middle panel of Fig. 5). This is in agreement with what we have found in section 3.1. In the bottom panel of Fig. 5, one can see that late type satellite galaxies are smaller than late type centrals at fixed stellar mass, as found in the previous section. We have checked that these results do not change significantly if we also match our galaxies in redshift by requiring that .
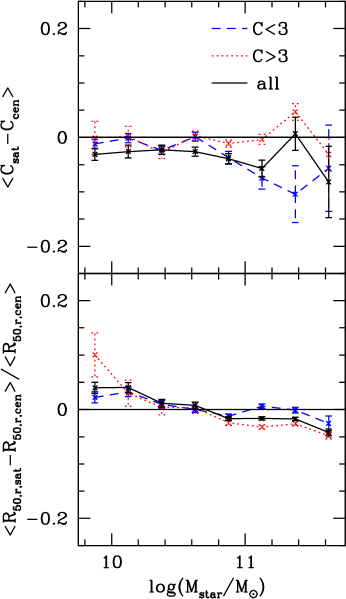
If we match galaxies not only in stellar mass, but also in concentration (by additionally requiring that ), differences between satellites and centrals in colour and radius persist, as visible in Fig. 6. However, the difference in radius is reduced considerably. This indicates that a significant part of the difference between late type central and satellite size is linked to a difference in the average concentration. On the other hand, if we match galaxies in stellar mass and colour (by additionally requiring , Fig. 7), the difference in concentration and radius is strongly reduced compared to if we only match galaxies in stellar mass, which indicates that an increase in concentration and a decrease in size for satellites does normally not occur without an accompanying shift towards redder colours.
To summarize, we find that at fixed stellar mass, the difference in concentration between centrals and satellites largely arises from the late type population. This hints at the presence of an environmental process that mildly increases the concentration in late type galaxies which become satellites, but does not transform late type into early type galaxies. We also find that the difference in size between late type centrals and satellites is closely linked to the difference in concentration. Differences in size and concentration, on the other hand, only occur with an accompanying change in colour.
3.4 Surface Brightness Profiles for Satellites and Centrals
In the previous two sections, we have shown that late type satellite galaxies are redder, smaller and have a higher concentration than late type central galaxies of the same stellar mass. To understand in more detail where these differences originate, we study in this section the surface brightness and colour profiles of central and satellite galaxies.
The SDSS surface brightness profiles are not often used in the literature, but have been found to agree well with deeper images (e.g. Erwin, Pohlen & Beckman 2008). The azimuthally averaged surface brightness is given in a series of up to 20 annuli with fixed angular sizes. We fit continuous surface brightness profiles to these values, following the procedure outlined in Stoughton et al. (2002). In order to be able to compare surface brightness profiles as a function of physical radius for galaxies at different redshifts, we renormalize the surface brightness profiles, taking into account cosmological surface brightness dimming, so that they all appear as at an arbitrary redshift of :
| (10) |
where is the surface brightness measured in magnitudes per square arcseconds at a physical radius at a redshift . is the k-correction to according to Blanton et al. (2003b) for the total galaxy colour and luminosity. The average profiles are calculated with the weighting scheme described in Section 2.2. We make use of the colour profiles because the difference between satellites and centrals is especially pronounced in this band. The results for the colour are qualitatively very similar. We also calculate the stellar mass density profile for satellite and central, early and late type galaxies in the two mass bins we consider, directly from the average colour and surface brightness profiles, using
| (11) |
where is given in , =log and is the absolute magnitude of the sun in the -band. is calculated in each radial bin from the average surface brightness profiles in -band and the average colour profile, following the method given in Bell et al. (2003). This is the same procedure as used for example in Bakos et al. (2008). All the errors on the profiles are calculated using jackknife-resampling.
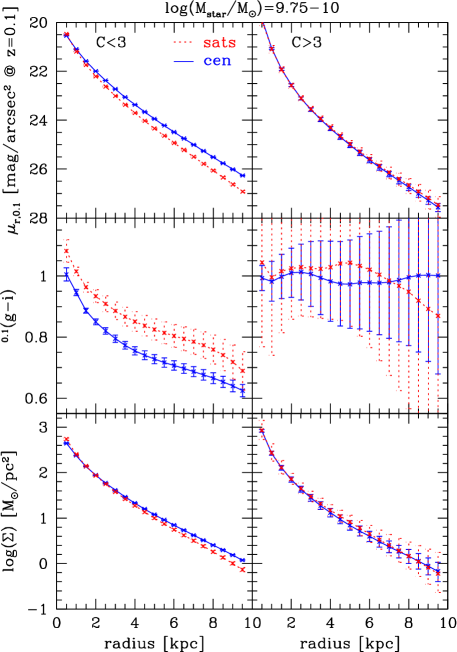
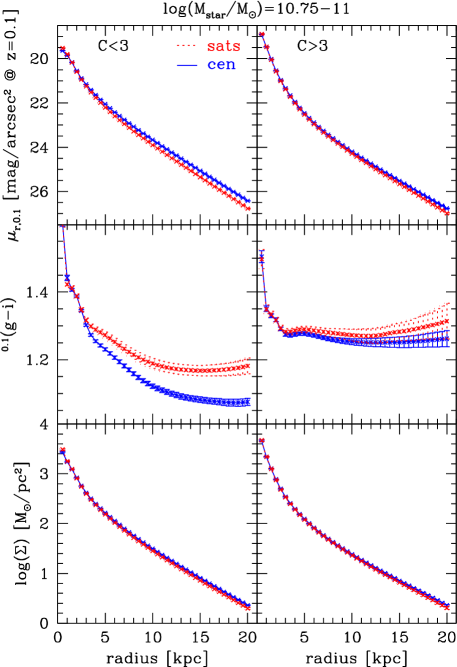
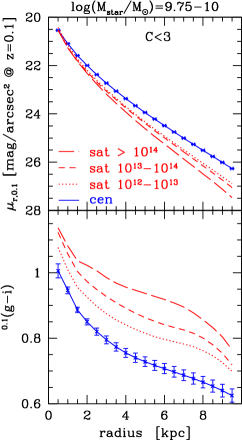
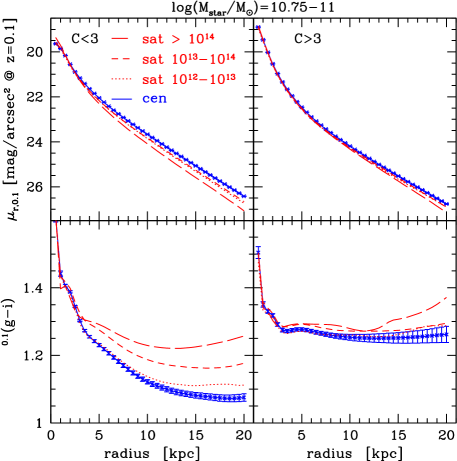
In Fig. 8 and 9, we show the average surface brightness profile in the top panels, the average colour profile in the middle panels, and the inferred stellar mass density profiles in the bottom panels, for galaxies with and respectively. Results are shown for early type galaxies (right hand panels) and late type galaxies (left hand panels). In agreement with previous studies (e.g. Bell & de Jong 2000 and references therein; Franx, Illingworth & Heckman 1989), we find that galaxies become bluer towards the outskirts. For the low mass early type galaxies, statistics are not sufficient to obtain a reliable result. In both stellar mass bins, we find that late type satellite galaxies have a lower surface brightness than late type central galaxies. No difference is present in the very central region, but it increases towards the outskirts of the average galaxy up to 0.75 mag in the lower stellar mass bin, and up to 0.4 mag in the higher stellar mass bin. In the lower mass bin, we find that the average colour for late type satellite galaxies becomes redder by a remarkably similar amount over the entire disk. In the higher mass bin, the colour differences increases towards the outskirts, but already appears at radii 3 kpc. This indicates that processes which change colours and luminosities in satellite galaxies act on (almost) the entire galaxy, and not only on their outer parts. The fact that the colour and luminosity differences are weak in the central parts for high mass galaxies is likely due to the increasing importance of the bulge component in these systems. Since bulges normally have a low star formation rate already in isolated galaxies, it is not to be expected that their colours will change strongly due to environmental effects. For early type galaxies, we find no difference in the average surface brightness profile between centrals and satellites, in agreement with our findings that both size and concentration do not show a difference either. However, we find that the colour profiles of early type satellites may be redder than for early type centrals by a small amount; this is in agreement with our finding that their integrated colour is slightly redder as well (section 3.3). Generally, the colour differences between satellites and centrals presented here are in good agreement with the ones found by van den Bosch et al. (2008a) for the total galaxy colours. The difference between the satellite and central stellar mass density profile (bottom panels of Fig. 8 and 9) is very small and smaller than the difference between the surface brightness profiles, indicating that no significant redistribution of mass occurs if a galaxy becomes a satellite, as long as it stays in the same stellar mass bin. The decreased stellar mass density in the outskirts of late type galaxies in the lower mass bin does not have to be caused by mass loss; rather, it is likely that the decreased star formation rate in satellite galaxies has the strongest impact on these outer regions of the galaxy which are supposed to form last (Trujillo et al. 2006, see also discussion in the next section).
We check how our results for the surface brightness profiles and colour profiles change as a function of the host halo mass of the satellites in Fig. 10 and 11. We consider three bins in : , and . Results for the early type galaxies in our lower stellar mass bin are not shown because of insufficient statistics. We do not show errorbars either, which are large ( 0.5 for the colour profiles). We again plot the results for the central galaxies as before for comparison. The average colour and surface brightness differences between centrals and satellites clearly increase with increasing host halo mass, with the change being more pronounced for the galaxies in the lower stellar mass bin. Interestingly, in our lower mass bin, we find that the colour change with increasing host halo mass is very similar across the entire disk for satellite galaxies. Our results are in agreement with van den Bosch et al. (2008b, see their Fig. 2) who found that the average integrated colour of satellites at fixed stellar mass is redder by in the highest mass clusters compared to low mass groups, with the effect being stronger for galaxies with low stellar mass. Note that we have found that the integrated colour corresponds to a colour in the profile at around 1-4 kpc in the two stellar mass bins we consider. The difference in the integrated colour between late type satellites in the highest and lowest halo mass bin is 0.1 in the lower stellar mass bin, and 0.07 in the higher stellar mass bin. The redder colours found in satellite galaxies residing in higher mass groups could indicate that the process shutting down star formation becomes more efficient as the group mass increases. Alternatively, it could also mean that satellites which currently reside in clusters have been satellite galaxies for a longer time than satellites which are currently found in groups. In particular, satellites currently residing in clusters may have been ‘preprocessed’ as satellites in groups. Although Berrier et al. (2008) find that most satellites in clusters have been accreted directly from the field, the average time when a galaxy first became a satellite might still be different for group and cluster satellites. We defer this open question to future work.
It is perhaps questionable if it is useful to include edge-on galaxies when calculating average galaxy profiles, since those will be more strongly affected by dust. For this reason, we have repeated our analysis using only galaxies with , i.e. face-on galaxies. Results are not shown here. We find that the surface brightness profiles and the difference between centrals and satellites is similar, but there are interesting deviations in the colour profiles. The central and satellite late type galaxies in both stellar mass bins are bluer by 0.04 over the entire disk. This is likely due to the fact that inclined late type galaxies are slightly reddened. However, this is not a large effect, and the difference between the colour profiles of central and satellite galaxies remains unchanged. We have therefore decided to show results for the entire sample instead of only face-on galaxies.
To summarize, the main difference between a central and satellite late type galaxy is (i) that the satellite galaxy is redder across its entire disk and (ii) that it is dimmer, and more strongly so in its outer regions than in the central regions. It is obvious that (ii) must lead to a decrease in the half-light radius. Also, if the disk surrounding a central bulge is dimmed, the concentration of the system will increase. Thus, it is likely that the dimming we observe is one of the main causes of the increase in concentration and the decrease in radius of late type satellites compared to late type centrals.
4 Constraining star formation histories for satellite galaxies
In this section, we will examine whether we can place any constraints on the mechanisms that suppress star formation in satellites. We construct simple models to explain the changes in the radial colour profiles presented in the previous section. One of our models is motivated by the model of Wang et al. (2007), the other one is a simple truncation model, as explained below.
4.1 Models of Star Formation in Satellites and Centrals
Wang et al. (2007) modelled the star formation rate (SFR) of galaxies using the equations below, where is the time (measured since the Big Bang) when the galaxy formed, is the timespan that a given satellite galaxy has spent as a central. and characterize the timescale of the decline in star formation rate for centrals and satellites. The SFR as a function of time (since Big Bang) is given by
| (12) |
for the central galaxies and
| (13) |
for the satellite galaxies, for which, by definition, . Using the abundances and projected correlations of galaxies in the SDSS as a function of 4000- break strengths, Wang et al. (2007) obtained the characteristic timescales and in four different mass bins. They find that while is a strong function of stellar mass for central galaxies (going from 40 Gyr in low mass galaxies to 2.5 Gyr in high mass galaxies, within the typical mass range in the SDSS), is remarkably similar in all mass bins, with values between 2.1 - 2.5 Gyr. Such a slow decline in SFR in satellites is expected if strangulation/starvation is taking place. In what follows, we will refer to this scenario as the “slow decline” scenario.
If the ISM is stripped by ram-pressure or tidal forces, satellites may experience a very quick and complete truncation of their star formation. As an alternative scenario to the “slow decline” model, we will therefore also check how such a fast truncation (for which we set ) would affect the colour profiles of satellite galaxies and we will refer to this as the “fast truncation” scenario.
The equations for the SFR as given above are defined for the integrated star formation rate in the entire galaxies. It is however to be expected that the star formation history will change as a function of radius in a galaxy. The main reason for this is that the star formation history is strongly dependent on the surface mass density (Kauffmann et al. 2003; MacArthur et al. 2004; Bell & de Jong 2000), even more so than on the stellar mass. How exactly the star formation history changes as a function of surface mass density, however, is not clear. The fact that regions with higher local mass density contain older stars and are more metal-rich than regions with lower local mass density can be explained in two ways in terms of star formation history, as pointed out in MacArthur et al. (2004). Either denser regions experience an earlier onset of star formation, which then declines in a similar way as in less dense regions. The other possibility is that star formation started at a similar time in regions of different density, but was more intense and declined faster in denser regions. To make our toy model as simple as possible, we will assume that the first of those two assumption holds, corresponding to an “inside-out” growth of the disk. Such a scenario is for example supported by the findings of Barden et al. (2005) and Trujillo et al. (2006) who studied the stellar mass-size evolution for late type galaxies.
4.2 Results
4.2.1 Reproducing the average colour profiles
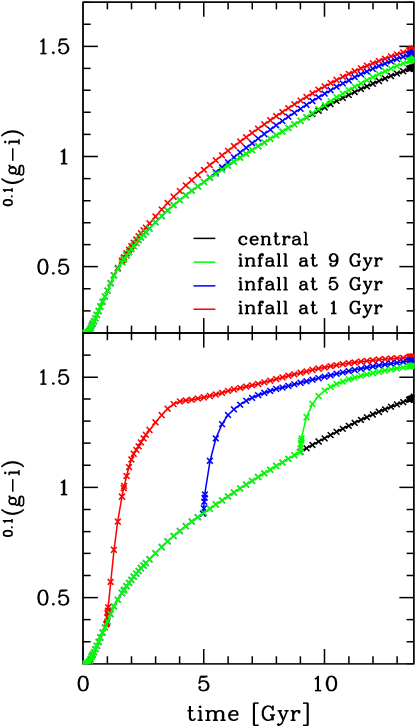
We will focus on galaxies with . For galaxies in a similar mass range, Wang et al. 2007 have found that Gyr and provide the best fits to the data. We calculate the colour333 was calculated from the and colours according to Blanton & Roweis 2007. as a function of the lifetime of a galaxy, using the Bruzual & Charlot (2003, hereafter BC03) model, both for the “slow decline” and the “fast truncation” scenario. The BC03 default dust model is included, and we use a metallicity of . In what follows the ‘formation’ of a galaxy refers to the start of star formation, while ‘infall time’ is the time when a galaxy changes from being a central to being a satellite. In the top panel of Fig. 12, we show the colour as a function of time since formation for satellites with three different infall times of 1, 5 or 9 Gyr after formation, according to “slow decline” scenario. For comparison, we also show the colour evolution of central galaxies. In the bottom panel of Fig. 12, the colour evolution for the “fast truncation” model is shown. Note that the biggest colour change occurs for galaxies which are young and blue at the time of infall (or parts of the galaxy which are young and blue).
We construct a simple model to predict the colour profile for satellite galaxies. We use the average colour profile for late type central galaxies with shown in Fig. 9 and simply assume that the change in colour as a function of radius is only due to a different formation time of the stellar population dominating the surface brightness at a given radius, assuming the aforementioned “inside-out” growth of the disk. This is an oversimplification, as both the metallicity and the dust content which vary as a function of radius are expected to contribute to colour gradients in galaxies. However, since this is only a toy model, we do not take into account these effects here. We therefore assume that the star formation rate is given by eq. 12 irrespective of radius, but that varies as a function of radius. In this way, we obtain the formation time as a function of radius. We do not take into account the innermost bins. In the first bin we consider, at a radius of 2 kpc, we find that the formation time is unrealistically high, namely 13.3 Gyr. This is expected, since we have not taken into account the increased influence of dust, and the enhanced metallicities in the inner regions of the galaxy. In the outermost bin at 20 kpc, we find that the start of star formation happened 7.5 Gyr ago according to our model. As a next step, we assume that the formation times as a function of radius will be exactly the same for a satellite galaxy and compute the colours as a function of radius and for different infall times for the satellite. If the satellite in our model has already become a satellite before the respective region was formed in our average central galaxy, we simply assume that this region does not form.
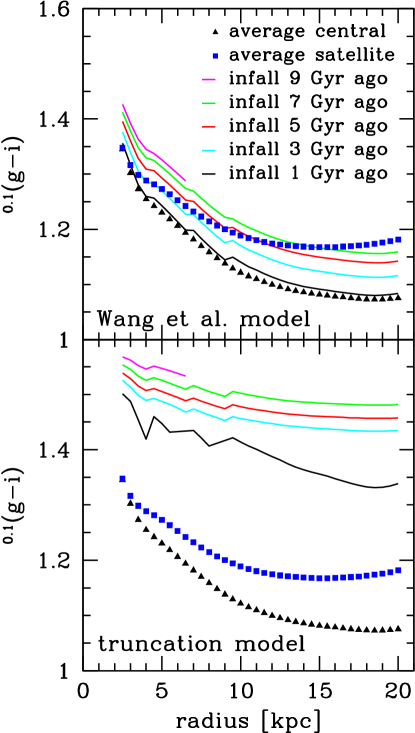
The colour profiles shown from our simple model, assuming the Wang et al. (2007) star formation rates for satellites and centrals in the corresponding mass bin, are shown in the top panel of Fig. 13. Blue squares (black triangles) show the colour profile of an average late type satellite (central) galaxy in the according stellar mass bin (without constraints on the host halo mass), as already shown in Fig. 9. While a relatively recent infall 3 Gyr ago seems to fit well out to a radius of 10 kpc, results become more unclear in the outer regions, where the satellite galaxies appear to be too red compared to the models. This could be explained if we assume a too recent formation for the outer region of the average galaxy, maybe because our adopted metallicity is too high for this part of the galaxy. Another option is that a fraction of the more loosely bound cold gas in the outskirts of the galaxy is lost, speeding up the decrease in star formation rate slightly. However, note also that the average profiles at radii above 15 kpc are rather uncertain. In particular, the average satellite colour profile does not show an upturn towards redder colour anymore if we decide to remove datapoints with errors larger than 10 % of the total flux (not shown here). If the effects of contamination of the satellite and central sample are accounted for (see section 2.1), the colour of the satellite galaxies becomes redder by up to 0.05 in the outermost radial bin, while the effect is weaker in the center. However, this increases the difference between the model and data only marginally.
If we assume that ram-pressure stripping of the entire ISM, which leads to a very abrupt truncation of star formation, is the dominant effect, the picture looks very different. In the bottom panel of Fig. 13, we perform the same exercise as before, but assuming that star formation is completely truncated if a galaxy becomes a satellite. Clearly, this leads to colour profiles which are much too red. In the outermost bin, even a truncation of star formation only 1 Gyr before the present time leads to 1.35, which is too red by 0.15. Of course, one can argue that ram-pressure stripping of the ISM will not be efficient for all satellite galaxies. However, using the Millennium simulation combined with analytical estimates, Brüggen & De Lucia (2008) find that half of the satellites residing in haloes with masses above today must have experienced significant ram-pressure stripping and they claim that a ram-pressure of this magnitude would strip a galaxy of a significant amount of its cold disk gas. Roediger & Hensler (2005) claim that a galaxy with a mass of loses all its gas down to a radius of 9 kpc if subject to such ram-pressure for 400 Myr. A strong shift towards redder colours at radii above 9 kpc, as expected in such a scenario, would be visible in our profiles, which extend to 20 kpc, but is not found. Even if we compare the model results with our sample of late type satellite galaxies residing in clusters with masses above , colours in the ram-pressure stripping scenario are still much too red. We therefore find no evidence for the common occurrence of such severe gas loss in the disks of late type galaxies in clusters, at least out to a distance of 20 kpc from the center of the galaxy.
One could argue that fast star formation truncation will cause galaxies to transform from late type into early type (for example, if they become a S0 galaxy) which would cause them to fall out of our late type sample. We cannot exclude that this happens in some cases, however, it seems that the majority of S0 galaxies is not formed in this way since their and luminosities do not match those of their potential progenitor late type galaxies (e.g. Burstein et al. 2005).
In summary, we find that while the slow decline scenario is not a perfect fit to the data in our simple model, fast truncation of star formation in a large fraction even of cluster satellite galaxies seems much more unlikely.
4.2.2 A potential ‘fast truncation’ subpopulation?
Clearly, by only considering the average colour profiles of galaxies, we cannot rule out the presence of a small population of late-type galaxies with colour profiles that are in agreement with the ‘fast truncation’ scenario. In order to identify such a potential subpopulation, we look for late type galaxies with profiles similar to those of the average early type in our stellar mass bin. This is less constraining than using the model ‘fast truncation’ profiles, and makes sure that we do not miss any galaxies due to the fact that stellar population synthesis models tend to produce colours which are slightly too red, as can be seen from the comparison between the profiles of early type galaxies and the model ‘fast truncation’ profiles. As visible in Fig. 9, the average early type galaxy is not only redder than the average late type galaxy, it also has a remarkably flat colour profile at radii above 5 kpc. We therefore select late type galaxies with colours redder than both at 5 and 10 kpc, and with a colour difference between these two points of less than 0.03. In general, late type galaxies with red colours are often strongly affected by dust (e.g. Gallazzi et al. 2008). However, since the amount of extinction should decrease with radius (e.g. Boissier et al. 2004), we hope to remove a large part of the dusty, but normally star forming galaxies by our criterion that the colour profile should be flat. We find that the late type galaxies with early type colour profiles have an average concentration of , compared to for the entire population of late type galaxies in this mass bin. The increased concentration for the subpopulation of galaxies with flat, red profiles is expected if their disk has undergone dimming due to a decline in star formation. Note that due to their high concentration and red colours, such galaxies have likely often been misclassified as early types in previous studies. They likely correspond to a part of the visually classified red spiral galaxy population which has been identified by Bamford et al. (2008). We find that late type galaxies with early type colour profiles make up 8 % of the central late type population and 11 % of the satellite late type population. 14 % of the satellite in clusters with masses above belong to this category. The fact that late type galaxies with early type colour profiles are also found among central galaxies and satellites in low mass groups indicates that these galaxies are not mainly produced by environmental effects like ram-pressure stripping. However, it is well possible that there is a small subpopulation which is produced in this way.
If we remove the late type galaxies with early type colour profiles from our sample, the difference in colour profile between satellite and central galaxies remains practically unchanged. This indicates that the difference in colour between the average central and satellite populations is not mainly driven by a small subpopulation undergoing a big change in colour, while the rest of the galaxies remain unaffected.
5 Discussion
5.1 Environmental Dependence of Galaxy Radii
We find that late type satellite galaxies have slightly smaller radii than their central counterparts at fixed stellar mass. Our results fit well with a simple picture in which the outer disks of galaxies fade after they become satellites. At fixed concentration and stellar mass, the difference in radius between centrals and satellites is relatively small, showing that a large part of the difference in half-light radius is linked to a difference in average concentration. As , this indicates that is decreased more strongly in satellites than . We find that this is indeed the case; while the median decreases by up to 20 % for satellites at fixed stellar mass, the median decreases by less than 15 %. At fixed colour and stellar mass, we find almost no difference in radius (and concentration) between satellite and central galaxies. This indicates that the change in radius and concentration is intimately connected to changes in star formation rate. No differences in radius is observed between early type centrals and satellites.
5.2 Constraining Environmental Processes
We have found that an environmental process which shuts down star formation in satellites over a timescale of a few Gyr is needed in order to explain the difference in average colour profiles between satellites and centrals at fixed stellar mass. This is in agreement with previous findings by Kauffmann et al. (2003), Balogh et al. (2004b), Wang et al. (2007) and Finn et al. (2008). As shown by van den Bosch et al. (2008a) and Skibba (2008) with independent methods, this environmental process should act in dark matter haloes of all masses (at least down to their resolution limit of ). Its efficiency is probably somewhat higher in high mass clusters (see Figs. 10 and 11). The only process which seems to meet these requirements is ‘starvation’ (also called ‘strangulation’, e.g. Larson, Tinsley & Caldwell 1980; Balogh, Navarro & Morris 2000), which is the removal of the hot gaseous halo around satellite galaxies (or, if one assumes cold accretion, the truncation of the infall of cold clumps onto the galaxy) and is assumed to take place via ram-pressure stripping or tidal stripping. According to the findings presented in this paper, it seems plausible that such a process, perhaps combined with a partial removal of gas in the very outer regions of the cold gas disk, could entirely explain the different colour and surface brightness profiles of satellite and centrals, and thus also the small differences in concentration and radius between satellite and central galaxies at fixed stellar mass. We find at present no need for a process which shuts down star formation quickly or which affects the morphology directly. Therefore, we claim that processes like harassment (Moore et al. 1996) are likely not important. Also, while it is consistent with our findings that a process like ram-pressure stripping removes the fuel for future star formation (be it in the hot halo or in the extended cold disk outside the region significantly populated by stars), we find it unlikely that the ISM itself is heavily stripped in a significant fraction of group and cluster galaxies, as it has been advocated by many studies (e.g. Gunn & Gott 1972; Quilis, Moore & Bower 2000).
5.3 Comparison with other studies
5.3.1 The effect of environment on the cold and hot gas
Claims of the importance of ram-pressure stripping (of the ISM) have been made by many observational studies. For example, Levy et al. (2007) find that disk galaxies in clusters show HI deficiency. This is even found in clusters where ram-pressure stripping (of the ISM) is not expected to occur (or in compact groups, Rasmussen et al. 2008), which has led to the claim that ram-pressure stripping is important in a surprisingly large range of environments. However, HI deficiency might also occur as a long-term result of starvation, if the gas in the disk is used up in star formation. Rasmussen et al. (2008) point out that this requires star formation rates for disk galaxies to have been significantly higher in the past than today (which is possible, but still debated, see Bell (2008) and references therein). It has also been claimed that the fact that HI disks are displaced and asymmetric in clusters could be an indication of ram-pressure stripping; however, such displacements and asymmetries are also prevalent in the field, as discussed in Levy et al. (2007). Finally, it is not clear if HI deficiency is really accompanied by a deficiency in molecular gas, which is probably harder to remove. Several studies (e.g. Casoli et al. 1998) find no CO-deficiency in spirals galaxies in cluster cores, although those are strongly HI deficient.
Koopmann & Kenney (2004) find that disk galaxies in the Virgo cluster have their star formation rate, measured by H, truncated primarily in the outer parts of the disks. They claim that this is evidence against starvation as the dominant process (since this would affect star formation in the entire disk). Bamford et al. (2007) find that the cluster galaxies in their sample have decreased emission-line scalelength compared to field galaxies, indicative of more centrally concentrated star formation. Although we also find that the difference in the colour profile is more pronounced in the outer part than in the inner part of galaxies, we have shown this to be consistent with a nearly uniform decline in star formation across the galaxy, if we assume an age gradient in the disk (see Fig. 13). This is due to the fact that the young, blue outer regions of galaxies undergo a more pronounced colour change when the star formation declines. In a recent study, Fumagalli & Gavazzi (2008) find that truncation of the star forming disks in the Virgo cluster as found by Koopman & Kenney (2004) only happens in extreme cases, and that starvation, which affects the entire star formation, is a much more common effect even in such a massive cluster, in agreement with our results. Nevertheless, ram-pressure stripping of at least part of the cold ISM is likely to occur in dense cores of clusters. For example, Vogt et al. (2004) find examples of disk galaxies in the cores of clusters which are likely infalling on radial orbits, and show HI-deficiencies primarily in the leading edges of their cold gas disks.
Other new findings seem to indicate that the gas in the hot halo is harder to remove from galaxies than has been assumed in previous models. Semi-analytical models generally assume that the hot gas halo of galaxies is stripped immediately once they become satellites. This has been shown to produce results in disagreement with data (Weinmann et al. 2006b; Baldry et al. 2006), indicating that starvation is less efficient than assumed. New simulations show that stripping of the hot halo gas does not occur instantaneously. Using SPH simulations, McCarthy et al. (2008) find that with typical orbital parameters, 20 - 40 % of the hot gas halo around galaxies might still be in place after 10 Gyr of orbiting in a cluster. These simulation results have recently been incorporated in a new semi-analytical model by Font et al. (2008), with the result that colours of satellite galaxies are now well reproduced (see also Kang & van den Bosch 2008). Jeltema, Binder & Mulcheay (2008) find that a large fraction of early type galaxies in dense environments have extended X-ray emission, indicating that they retain a significant amount of hot gas.
5.3.2 The effect of environment on morphology
A number of recent studies are in agreement with our finding that violent satellite-specific environmental processes transforming galaxy morphology are likely not important and do not produce galaxies. Note that we do not count major mergers, which are expected to produce elliptical galaxies (e.g. Toomre & Toomre 1972) as environmental effects here, since they are part of the formation history of a given galaxy and are reflected in its stellar mass. Kauffmann et al. (2004), Ball, Loveday & Brunner (2008), van den Bosch et al. (2008a) and Bamford et al. (2008) all find that the relation between environment and star formation rate or colour is more fundamental than the relation between environment and morphological indicators like Sérsic index or concentration. This supports our finding that the change in concentration with environment is only a secondary effect, caused by decreasing star formation rates. Van der Wel (2008) distinguishes between ‘structure’ and ‘morphology’ - while structure is closely related to the bulge-to-total luminosity of a galaxy, morphology also takes into account features of star formation, like the presence of spiral arms. They find that while morphology is strongly correlated with galaxy density at fixed stellar mass, structure is only weakly dependent on environment, in agreement with our results. Another clear indication that environmental processes can quench star formation without disturbing the mass distribution in galaxies is the existence of ‘anemic spirals’ and ‘passive spirals’, which have very little or no ongoing star formation (van den Bergh 1979; Goto et al. 2003). Their abundance is low, which could be an indication that the environmental processes affecting star formation is indeed slow, as suggested in this work. Alternatively, it could also mean that such galaxies are quickly transformed into S0s (but see Burstein et al. 2005).
5.3.3 The effect of dust
Based on their observations of a relatively small sample of galaxies in the A901/902 supercluster, Wolf et al. (2005), Lane et al. (2007) and Gallazzi et al. (2008) speculate that environmental effects at intermediate densities could enhance dust extinction in late type galaxies. We find no evidence for a common occurrence of such an effect. On the contrary, our late type satellites show a clearly decreased -band attenuation (derived from the Balmer decrement by Kauffmann et al. 2003) compared to central galaxies at fixed stellar mass. This effect is even stronger for satellites in massive clusters. This is clear evidence that our finding that satellite galaxies have redder colours than central galaxies is unrelated to dust. Note that a decrease in -band attenuation with increasing galaxy density has already been found by Kauffmann et al. (2004) and can be explained by the fact that the dust attenuation is highest for star-forming, gas-rich galaxies.
6 Summary
Using the group catalogue of Yang et al. (2007) based on the SDSS DR4 data set, we investigate the differences between satellite and central galaxies, to constrain satellite-specific environmental processes. We particularly focus on the differences in concentration and size. Comparing the full distributions in concentration for satellite and central galaxies, we find that galaxies are likely not produced by environmental effects, and that a large part of galaxies have their concentration mildly enhanced when becoming satellites, which is evidence against the predominance of violent mechanisms affecting the concentration of satellite galaxies. We split our sample into early and late type galaxies according to concentration, using =3. For the first time, we show clearly that late type satellite galaxies have smaller half-light radii than their central counterparts at fixed stellar mass. No difference is found between the half-light radii of early type central and satellite galaxies.
To investigate the origin of the observed differences in concentration and half-light radius, we study the surface brightness and colour profiles of central and satellite galaxies. We find that late type satellite galaxies are dimmed with respect to centrals, and become redder. Since these effects are more pronounced in the outskirts of galaxies, this explains the decreased size and increased concentration in satellite galaxies. We find indications that the environmental effect responsible for these changes becomes more efficient in higher mass groups. Early type satellite galaxies show nearly no difference to their central counterparts, except that there is some indication of a weak shift towards redder colour profiles.
We also compare the stellar mass profiles of central and satellite galaxies and find them to be very similar, indicating that the stellar mass distribution is not significantly affected by environmental processes. Using stellar population synthesis models, we show that the observed changes in the colour profile between central and satellite late type galaxies can be explained by a slow decline in star formation, and that they are are inconsistent with a fast truncation. We conclude that ‘starvation’ (also called ‘strangulation’), i.e. the removal of the hot extended gas halo around galaxies, perhaps combined with a partial stripping of the very outer regions of the cold gas disk, is the only process needed in order to explain the environmental dependencies we are able to resolve at present in the SDSS.
Acknowledgments
It is a pleasure to thank Dimitri Gadotti for interesting discussions about galaxy morphology, and for providing us with his data set. We are grateful to the referee for his constructive comments which helped to improve the paper. We thank Anja von der Linden for letting us use her corrected half-light radii and for useful discussion, and Simon White, Eric Bell, Shiyin Shen and Christian Thalmann for helpful suggestions and useful discussion. SW has been supported by the Swiss National Science Foundation (SNF).
References
- [] Adelman-McCarthy J.K., et al., 2007, ApJS, 172, 634
- [] Allen P.D., Driver S.P., Graham A.W., Cameron E., Liske J., De Propris R., 2006, MNRAS, 371, 2
- [] Bailin J. & Harris W.E., 2008, ApJ, 681, 225
- [] Bakos J., Trujillo I., Pohlen M., 2008, ApJ, 683, L102
- [] Baldry I.K., Balogh M.L., Bower R.G., Glazebrook K., Nichol R.C., Bamford S.P., Budavari T., 2006, MNRAS, 373, 469
- [] Ball N.M., Loveday J., Brunner R.J., 2008, MNRAS, 383, 907
- [] Balogh M.L., Navarro J.F., Morris S.L., 2000, ApJ, 540, 113
- [] Balogh M.L., Christlein D., Zabludoff A., Zaritsky D., 2001, ApJ, 557, 117
- [] Balogh M.L., et al., 2004a, MNRAS, 348, 1355
- [] Balogh M.L., Baldry I.K., Nichol R., Miller C., Bower R., Glazebrook K., 2004b, ApJ, 615, 101
- [] Bamford S.P., Milvang-Jensen B., Aragón-Salamanca A., 2007, MNRAS, 378, L6
- [] Bamford S.P., et al., 2008, preprint (arXiv:0805.2612)
- [] Barden M., et al., 2005, ApJ, 635, 959
- [] Bell E.F., de Jong R.S., 2000, MNRAS, 312, 497
- [] Bell E.F., McIntosh D.H., Katz N., Weinberg M.D., 2003, ApJS, 149, 289
- [] Bell E.F., 2008, Astronomical Society of the Pacific Conference Series, 396, 389
- [] Berrier J.C., Steward K.R., Bullock J.S., Purcell C.W., Barton E.J., Wechsler R.H., preprint (arXiv:0804.0426)
- [] Blanton M.R., et al., 2001, ApJ, 121, 2358
- [] Blanton M.R., et al., 2003a, ApJ, 594, 186
- [] Blanton M.R., et al., 2003b, ApJ, 592, 819
- [] Blanton M.R., Eisenstein D., Hogg D.W., Schlegel D.J., Brinkman J., 2005a, ApJ, 629, 143
- [] Blanton M.R., et al., 2005b, ApJ, 129, 2562
- [] Blanton M.R., Roweis S., 2007, AJ, 133, 734
- [] Brüggen M., De Lucia G., 2008, MNRAS, 383, 1336
- [] Boissier S., Boselli A., Buat V., Donas J., Milliard B., 2004, A&A, 424, 465
- [] Bruzual G., Charlot S., 2003, MNRAS, 344, 1000 (BC03)
- [] Burstein D., Ho L.C., Huchra J.P., Macri L.M., 2005, ApJ, 621, 246
- [] Cacciato M., van den Bosch F.C., More S., Li R., Mo H.J., Yang X., 2008, preprint (arXiv:0807.4932)
- [] Casoli R., et al. 1998, A & A, 331, 451
- [] Dressler A., 1980, ApJ, 236, 351
- [] Driver S.P., Popescu C.C., Tuffs R.J., Liske J., Graham A.W., Allen P.D., De Propris R., 2007, MNRAS, 379, 1022
- [] Erwin P., Pohlen M., Beckman J.E., 2008, 135, 20
- [] Finn R.A., Balogh M.L., Zaritsky D., Miller C.J., Nichol R.C., 2008, ApJ, 679, 279
- [] Font A.S. et al., 2008, MNRAS, 389, 1619
- [] Franx M., Illingworth G., Heckman T., 1989, ApJ, 98, 538
- [] Fumagalli M., Gavazzi G., 2008, 2008, A&A, 490, 571
- [] Gadotti D. A., 2008, preprint (arXiv:0810.1953)
- [] Gallazzi A. et al., 2008, preprint (arXiv:0809:2042)
- [] Goto T., et al., 2003, PASJ, 55, 757
- [] Graham A.W., Worley C.C., 2008, MNRAS, 388, 1708
- [] Gunn J.E., Gott J.R., 1972, ApJ, 176, 1
- [] Jeltema T.E., Binder B., Mulchaey J.S., 2008, ApJ, 679, 1162
- [] Kang X., van den Bosch F.C., 2008, ApJ, 676, 101
- [] Kauffmann G., et al., 2003, MNRAS, 341, 33
- [] Kauffmann G., White S.D.M, Heckman T.M., Ménard B., Brinchmann J., Tremonti C., Brinkmann J., 2004, MNRAS, 353, 713
- [] Koopmann R.A., Kenney J.D.P., 2004, ApJ, 613, 851
- [] Lane K.P., Gray M.E., Aragón-Salamanca A., Wolf C., Meisenheimer K., 2007, MNRAS, 378, 716
- [] Larson R.B., Tinsley B.M., Caldwell C.N., 1980, ApJ, 237, 692
- [] Levy L., Rose J.A., van Gorkom J.H., Chaboyer B., 2007, MNRAS, 133, 1104
- [] Lintott C., et al., 2008, MNRAS, 389, 1179
- [] MacArthur L.A., Courteau S., Bell E.F., Holtzmann J.A., 2003, ApJS, 152, 175
- [] Maller A.H., Berlind A.A., Blanton M.R., Hogg D.W., 2008 (arXiv:0801.3286)
- [] McCarthy I.G., et al., 2008, MNRAS, 383, 593
- [] Moore B., Katz N., Lake G., Dressler A., Oemler A., 1996, Nature, 379, 613
- [] Nakamura O., Fukugita M., Yasuda N., Loveday J., Brinkmann J., Schneider D.P., Shimasaku K., SubbaRao M., 2003, ApJ, 125, 1682
- [] Park C., Choi Y.-Y., Vogeley M.S., Gott J.R. III, Blanton M., 2007, ApJ, 658, 898
- [] Poggianti B.M., Smail I., Dressler A., Couch W.J., Barger A.J., Butcher H., Ellis R.S., Oemler A.J., 1999, ApJ, 518, 576
- [] Postman M., Geller M.J., 1984, ApJ, 281, 95
- [] Quilis V., Moore B., Bower R., 2000, Science, 288, 1617
- [] Rasmussen J., Ponman T.J., Verdes-Montenegro L., Yun M.S., Borthakur S., 2008, MNRAS, 388, 1245
- [] Roediger E., Hensler G., 2005, A & A, 433, 875
- [] Schlegel D.J., Finkbeiner D.P., Davis M., 1998, ApJ, 500, 525
- [] Sérsic J.L., 1968, Atlas de Galaxies Australes. Obs. Astronomico, Cordoba
- [] Shao Z., Xiao Q., Shen S., Mo H.J., Xia X., Deng Z., 2007, ApJ, 659, 1159
- [] Shimasaku K., et al., 2001, AJ, 122, 1238
- [] Shen S., et al., 2003, MNRAS, 343, 978
- [] Shen S., et al., 2007, MNRAS, 379, 400
- [] Skibba R.A., 2008, preprint, (arXiv:0805.1233)
- [] Stoughton et al., 2002, ApJ, 123, 485
- [] Strateva I. et al., 2001, ApJ, 122, 1861
- [] Strauss M.A.., et al., 2002, ApJ, 124, 1810
- [] Toomre A., Toomre J., 1972, ApJ, 178, 623
- [] Trujillo I., et al., 2006, ApJ, 650, 18
- [] van der Wel A., 2008, ApJ, 675, 13
- [] van den Bosch F.C., et al., 2008a, MNRAS, 387, 79
- [] van den Bosch F.C., Pasquali A., Yang X., Mo H.J., Weinmann S.M., McIntosh D.H., Aquino D., 2008b, preprint (arXiv:0805:0002)
- [] Vogt N.P., Haynes M.P., Giovanelli R., Herter T., 2004, ApJ, 127, 3300
- [] von der Linden A., Best P.N., Kauffmann G., White S.D.M., 2007, MNRAS, 379, 867
- [] van den Bergh S., 1976, ApJ, 206, 883
- [] Wang L., Li C., Kauffmann G., De Lucia G., MNRAS, 2007, 377, 1419
- [] Weinmann S.M., van den Bosch F.C., Yang X., Mo H.J., 2006a, MNRAS, 366, 2
- [] Weinmann S.M., van den Bosch F.C., Yang X., Mo H.J., Croton D.J., Moore B., 2006b, MNRAS, 372, 1161
- [] Wolf C., Gray M.E., Meisenheimer K., 2005, A&A, 443, 435
- [] Yang X., Mo H.J., van den Bosch F.C., Jing Y.P., 2005, MNRAS, 356, 1293
- [] Yang X., Mo H.J., van den Bosch F.C., Pasquali A., Li C., Barden M., 2007, ApJ, 671, 153 (Y07)
- [] Yang X., Mo H.J., van den Bosch F.C., 2008, ApJ, 676, 248