Ionization Cone in the X-ray Binary LMC X-1
Abstract
In an earlier paper, we presented the first evidence for a bow-shock nebula surrounding the X-ray binary LMC X-1 on a scale of pc, which we argued was powered by a jet associated with an accretion disk. We now present the first evidence for an ionization cone extending from an X-ray binary, a phenomenon only seen to date in active galactic nuclei (AGN). The ionization cone, detected in the He ii/H and [O iii]/H line ratio maps, aligns with the direction of the jet inferred from the bow-shock nebula. The cone has an opening angle and radial extent . Since the He ii emission cannot be explained by the companion O star, the gas in the ionization cone must be exposed to the ‘naked’ accretion disk, thereby allowing us to place constraints on the unobservable ionizing spectrum. The energetics of the ionization cone give unambiguous evidence for an “ultraviolet - soft X-ray” (XUV) excess in LMC X-1. Any attempt to match the hard X-ray spectrum ( keV) with a conventional model of the accretion disk fails to account for this XUV component. We propose two likely sources for the observed anisotropy: (1) obscuration by a dusty torus, or (2) a jet-blown hole in a surrounding envelope of circumstellar absorbing material. We discuss the implications of our discovery in the context of the mass-scaling hypothesis for accretion onto black holes and suggest avenues for future research.
Subject headings:
accretion, accretion disks; ISM: jets and outflows; techniques: spectroscopic; X-rays: binaries; X-rays: individual (LMC X-1)1. Introduction
The search for a so-called ‘unified model’ of AGN has spanned more than two decades (Antonucci, 1993). Indeed, it has been shown that some Type 2 Seyferts may comprise a Type 1 Seyfert nucleus that is heavily obscured by a dense, dusty torus (Lawrence & Elvis 1982; Antonucci & Miller 1985). Although dusty tori obscure some of the nuclear continuum emission, a significant fraction escapes along the poles of the central source, producing a cone-shaped extended emission line region. Perhaps the most spectacular example occurs in the Type 2 Seyfert galaxy NGC 5252 where bipolar [O iii] cones are seen to extend to 30 kpc in radius (Tadhunter & Tsvetanov, 1989). This important phenomenon allows one to test the unified model by analyzing the ionization properties of the gas within the cones.
Many of the phenomena we observe from active galaxies arise from the properties of the accretion disk. Edelson & Nandra (1999) note that the power density spectrum of an active galaxy resembles those observed in some Galactic black hole X-ray binaries (XRBs), such as Cyg X-1 (see also McHardy 1989). The transient behaviour of XRBs, however, may render ‘the scaling from stellar-to-supermassive black hole mass’ a false argument (Done & Gierliński, 2005). But if appropriate corrections are made for the variations in the accretion rate, the variability timescales may be related (McHardy et al., 2006).
If the mass-scaling hypothesis for black holes is correct, it is natural to question why we have not observed ionization cones associated with XRBs in previous work. This may reflect the difficulty of interpreting the complex nebulosity in the vicinity of XRBs due to a background of competing sources, e.g. hot young stars. The XRB LMC X-1 is surrounded by a complex filamentary emission-line nebula, catalogued by Henize (1956) as N159F. The X-ray source (, Schlegel et al. 1994) comprises a stellar mass () black hole accreting matter from an O7 III-type star (“Star 32”). Based on the He ii emission line, Pakull & Angebault (1986) demonstrated that N159F was the first example of an X-ray ionized nebula. Ramsey et al. (2006) supported the presence of an X-ray ionized nebula, and concluded that LMC X-1 ‘is not injecting a significant amount of mechanical energy into the interstellar medium,’ contrary to the findings of Cooke et al. (2007) (hereafter, Paper I), who recently suggested that the nebula surrounding LMC X-1 is largely driven by a jet emanating from the XRB. The latter study used integral field spectroscopy (IFS) to delineate the complex ionization regions within the nebula. The two studies prior to Paper I used 1D slit spectroscopy, a technique that is spatially more limited than IFS.
Once again we appeal to IFS to obtain a complete spatial coverage of the nebula. The motivation behind our new study is to assess the extent of hard ionizing photons by tracing the He ii and [O iii] emission. In the course of our work, we have discovered an ionization cone associated with this XRB, the first of its kind. Moreover, the ionization cone aligns with the putative jet from Paper I, a phenomenon also observed in AGNs (Unger et al., 1987). Not only does this provide a new ground for testing accretion disk phenomena, but it also strengthens the mass-scaling hypothesis, implying that accretion processes around stellar-mass black holes are similar to accretion processes around supermassive black holes.
We summarize the observations and data reduction procedures in § 2. In § 3, we derive the cone parameters and discuss the ionizing source. Our interpretation and conclusions are summarized in § 4.
2. Observations
After presenting our previous results on LMC X-1 (Paper I), we were alerted to archival VIsible Multi-Object Spectrograph (VIMOS) IFS observations (Program ID: 076.C-0284(B)) of N159F, which were acquired in seeing on 2005, October 1, and 27. Four 900 sec VIMOS exposures were taken in high-resolution mode, two using the blue grism (R) and two using the orange grism (R). The spectral range includes the prominent optical emission lines [O i], [O iii], He i, He ii, [Ar iii], [N ii], [S ii], H and H, all of which are important diagnostics for delineating regions containing multiple ionizing sources, and estimating the electron density and temperature. The two exposures with each grism were offset east-west by ( pixels) and north-south by ( pixels).
The data were reduced using the reduction pipeline VIPGI111VIPGI - Vimos Interactive Pipeline Graphical Interface, obtained from http://cosmos.iasf-milano.inaf.it/pandora/ (Scodeggio et al., 2005). The reduced data were converted into 3D datacubes and combined using the same data manipulation routines implemented in Paper I. At the spectral resolution of the VIMOS grisms, all lines were found to be well approximated by a single unresolved Gaussian profile.
3. Results
3.1. Morphology & ionization source
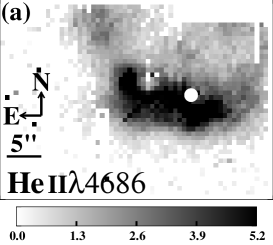
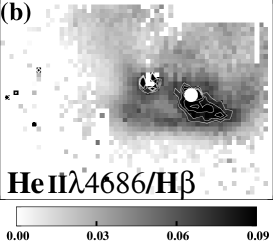
Fig. 1(a) immediately highlights the anisotropy of He ii emission and its correlation with the [O iii] emission (see Paper I), which is the first evidence that isotropic ionization by LMC X-1 is unlikely. An ionization cone is revealed when taking the ratio of these high ionization emission lines with respect to H (see Fig. 1(b) & (c)), as these line ratios are strongly dependent on the ratio of the ionizing photon intensity and the gas density (i.e. ionization parameter) at a fixed gas abundance. Jets, winds, and cones are often asymmetric and this may arise from the source or be due to large-scale dust or the presence of gas. The one-sided cone is observed in the direction of the putative jet (refer to Paper I).
The [O iii] ratio is a good diagnostic of nebular temperature, while the [S ii] ratio provides an estimate of the electron number density when the ratio of this doublet is between () and () (Osterbrock & Ferland, 2006). We derive an electron temperature and an electron number density in the ionization cone, with an uncertainty of about 10%. The value of is revised downwards from Paper I due to the improved data and is close to the low-density limit of this line diagnostic. It is noteworthy that outside the ionization cone the nebular temperature declines by .
We note that LMC X-1 borders the giant H ii region complex N159 (Henize, 1956). It is therefore likely that other nearby sources contribute to some of the ionization in N159F, which could explain some of the ‘excess’ emission around LMC X-1. In §3.2, we show that since the luminous stellar companion to LMC X-1 (Star 32) makes a negligible contribution to the cone energetics, the ionizing luminosity can only arise from LMC X-1. Furthermore, we find that the cone largely arises from photoionization rather than jet-powered shock ionization for two reasons. First, the nebula temperature is substantially cooler than expected for shock-heated gas at any metallicity (Dopita & Sutherland, 2003). Secondly, radiative shock models predict an onset of He ii emission for shock speeds (Schull & McKee, 1979; Binette, Dopita & Tuohy, 1985; Cox & Raymond, 1985; Hartigan, Raymond & Hartmann, 1987). However, we showed in Paper I that the LMC X-1 jet is triggering a shock with a shock velocity that is unlikely to exceed .
3.2. Cone parameters & ionizing spectrum
Ionization cones provide a direct measure of the flux of the ionizing continuum from the accretion disk if the geometry and orientation are clearly defined (Mulchaey, Wilson & Tsvetanov, 1996). For the one-sided cone, we measure its position angle, half-opening angle and length to be PA, and respectively; however, these are subject to the inclination angle of the cone to our line-of-sight, (Cowley, 1992; Makishima et al., 2000). Therefore, the true half-opening angle, cone length and cone solid angle are respectively , , and . For our inferred and , the ionization cone is optically thick to H0 Lyman continuum photons (, ), and He+ Lyman continuum photons (, ). However, the ionization cone is optically thin to photons above (Yan, Sadeghpour & Dalgarno, 1998).
We now use the observed X-ray spectrum to derive our first estimate of the ionizing flux from LMC X-1. The X-ray spectrum is best-fitted by a Comptonized multicolor disk (CMCD) model (Yao, Wang & Nan Zhang, 2005). However, for energies , the X-ray spectrum of LMC X-1 can be approximated by the simple multicolor disk (MCD) model (Fig. 2, Yao et al. 2005). The MCD model presented in Fig. 2 adopts the following parameters: and , where is the inner disk temperature, and is a normalizing constant. We present this model with and without line-of-sight attenuation ().
Since depends on the assumed inclination angle , we set to determine the ionizing luminosity within the cone. We determine the absorption-corrected photon flux from to and to along our line-of-sight to be and respectively. Therefore the number of H0 and He+ Lyman continuum photons in the cone produced by the X-ray source is
| (1) | |||
| (2) |
at the distance (, Feast 1999) to the LMC. The subscript ‘’ indicates that these were obtained from an extrapolation of the X-ray model.
From the VIMOS data, we measure the extinction corrected He ii flux of the cone to be ((BV), Bianchi & Pakull 1985) corresponding to a cone luminosity . If we assume case B recombination, from the ratio of the total to effective recombination coefficients, (for T=, Péquignot, Petitjean & Boisson 1991), we estimate (Eq. 41, Harman & Seaton 1966)
| (3) |
powers the cone, where 2.6 eV. This estimate would be higher still if the covering factor of the gas in the ionization cone was less than unity.
Considering the well-established metal deficiency of the LMC (), if Star 32 was solely responsible for the ionization cone, its stellar temperature would need to be in excess of (Evans & Dopita, 1985), which is inconsistent with the known value, (Bianchi & Pakull, 1985). However, Star 32 is capable of producing photons with energies , and assuming it radiates isotropically, it will produce (Vacca, Garmany & Shull, 1996). Therefore Star 32 produces insufficient He+ Lyman continuum photons to explain the observed ionization cone.
We now derive a new estimate of that is independent of the extrapolation from the X-ray spectrum. The [O iii]/[O ii] ratio in the cone provides us with a direct determination of the ionization parameter for a gas with known metallicity (Kewley & Dopita, 2002). Due to the insufficient spectral coverage of the VIMOS blue grism, the [O ii] lines are not present in the VIMOS datacube. Instead, we use the [O iii]/[O ii] ratio () determined from “Position 1” (Pakull & Angebault, 1986). For the LMC gas phase abundance, this ratio corresponds to a unique ionization parameter (Kewley & Dopita, 2002) due to the differential dependence of oxygen ions on the ionization rate. Thus
| (4) |
where is the characteristic radius of the cone (). Outside the cone, there is a decrease in at increasing radius from LMC X-1. For example, the [O iii]/[O ii] ratio at a distance of () north-east of LMC X-1 (“Position 2,” Pakull & Angebault 1986) is indicative of an ionization parameter .
4. Discussion
By comparing Eq. (1)-(4), the Yao model underestimates the number of ionizing photons emerging from the accretion disk by a factor of . This discrepancy requires an extra component that dominates in the UV and/or soft X-ray bands. In the Yao model, we cannot increase because it is constrained beyond by the observed hard X-ray spectrum (see Fig. 2), which is modelled as Comptonized disk emission.
We note that the size of the discrepancy arising from Eq. (1)-(4) is exaggerated by the use of a photon number; the energy requirement is only a factor of two more than the Yao model. This could conceivably arise from upscattering of lower energy photons from more distant regions in the disk by a hot coronal plasma in the inner region. Alternatively, a sizeable fraction of the hard X-ray photons could be degraded to lower energies, i.e. in the opposite sense to what is assumed in the CMCD model. It is noteworthy that some AGN ionization cones can only be explained by the contribution of both ionization from the non-stellar nuclear continuum and jet-induced shock ionization (Pogge, 1988; Wilson, Ward & Haniff, 1988). Therefore an in situ jet may also contribute to the LMC X-1 cone, although the nebular temperature limits any contribution from shock processes.
EUV/soft X-ray excesses are not uncommon to AGN. The spectra of high redshift quasars, which can be observed in the UV, clearly exhibit a big blue bump component, widely attributed to accretion disk emission (Sanders et al., 1989). This component has also been inferred from the emission-line diagnostics of Seyfert 2 ionization cones (Alexander et al., 2000). In some cases, EUV/soft X-ray excesses are also observed. The origin of this component is unclear, but it may arise, for example, from thermal emission in a warm/hot cloud at a temperature that peaks in the eV range (Siemiginowska et al., 1995). How this component relates to the accretion disk is not clear.
It is unlikely that the angular extent of the ionization cone reflects the poloidal ionizing field of the naked accretion disk. There are two plausible explanations for the anisotropic radiation pattern: (1) obscuration by a dusty torus, or (2) a jet-blown hole in the envelope of circumstellar absorbing material (Kuulkers, 2005; Nespoli, Fabregat & Mennickent, 2008).
We suspect that obscuring XRB tori would scale to AGN tori with the mass accretion rate rather than the black hole mass. The mass accretion rate in XRBs depends on the donor star, whereas for AGN, it depends on the gas fuel supply from the surrounding interstellar medium. Because Star 32 is a giant, we would expect an excess mass flux to accumulate somewhere before reaching the accretion disk. This accumulated mass flux could form something akin to an obscuring torus. By analogy with AGN (Pier & Krolik, 1993), high angular resolution, mid-infrared observations of LMC X-1 are required to confirm the presence of a dusty torus.
Here we have demonstrated the importance of ionization cones for establishing the XUV properties of obscured accretion disks. We suspect the ionization cone will also be observable in [Ne iii] and [Ne v] (ionization potential and respectively). These arise at higher values and will therefore allow us to probe down to smaller radii. Indeed, Pakull & Angebault (1986) have already detected these two high ionization species in the immediate vicinity of LMC X-1. But due to the limited spatial coverage of their spectroscopic technique, we are unable to confirm that these ratios are enhanced in the direction of the ionization cone. Planned future observations will probe the structure of the ionization cone, allowing us to refine our ionization model and place tighter constraints on the nature of the ionizing source.
References
- Alexander et al. (2000) Alexander, T. et al. 2000, ApJ, 536, 710
- Antonucci & Miller (1985) Antonucci, R. & Miller, J. 1985, ApJ, 297, 621
- Antonucci (1993) Antonucci, R. 1993, ARA&A, 31, 473
- Bianchi & Pakull (1985) Bianchi, L., & Pakull, M. W. 1985, A&A, 146, 242
- Binette et al. (1985) Binette, L., Dopita, M. A., & Tuohy, I. R. 1985, ApJ, 297, 476
- Cooke et al. (2007) Cooke, R. Kuncic, Z. Sharp, R. & Bland-Hawthorn, J. 2007, ApJ, 667, L163
- Cowley (1992) Cowley, A. P. 1992, ARA&A, 30, 287
- Cox & Raymond (1985) Cox, D. P., & Raymond, J. C. 1985, ApJ, 298, 651
- Done & Gierliński (2005) Done, C. & Gierliński, M. 2005, MNRAS, 364, 208
- Dopita & Sutherland (2003) Dopita, M. A., & Sutherland, R. S. 2003, Astrophysics of the Diffuse Universe (Berlin:Springer)
- Edelson & Nandra (1999) Edelson, R. & Nandra, K. 1999, ApJ, 514, 682
- Evans & Dopita (1985) Evans, I. N., & Dopita, M. A. 1985, ApJS, 58, 125
- Feast (1999) Feast, M. 1999, in IAU Symp. 190, New Views of the Magellanic Clouds, ed. Y.-H. Chu et al. (San Francisco:ASP), 542
- Harman & Seaton (1966) Harman, R. J. & Seaton, M. J. 1966, MNRAS, 132, 15
- Hartigan et al. (1987) Hartigan, P., Raymond J., & Hartmann, L. 1987, ApJ, 316, 323
- Henize (1956) Henize, K. G., 1956, ApJS, 2, 315
- Kewley & Dopita (2002) Kewley, L. J. & Dopita, M. A. 2002, ApJS, 142, 35
- Kuulkers (2005) Kuulkers, E. 2005, in AIP Conference Series, Vol. 797, Interacting Binaries: Accretion, Evolution, and Outcomes, ed. L. Burderi, L. A. Antonelli, F. D’Antona, T. di Salvo, G. L. Israel, L. Piersanti, A. Tornambè, & O. Straniero, 402-409
- Lawrence & Elvis (1982) Lawrence, A. & Elvis, M. 1982, ApJ, 256, 410
- Makishima et al. (2000) Makishima, K. et al. 2000, ApJ, 535, 632
- McHardy (1989) McHardy, I. M. 1989, in The 23rd ESLAB Symposium on Two Topics in X-ray Astronomy, vol. 2: AGN and the X-ray Background, p. 1111
- McHardy et al. (2006) McHardy, I. M. et al. 2006, Nature, 444, 730
- Mulchaey et al. (1996) Mulchaey, J. S. Wilson, A. S. & Tsvetanov, Z. 1996, ApJ, 467, 197
- Nespoli et al. (2008) Nespoli, E. Fabregat, J. & Mennickent, R. E. 2008, A&A, 486, 911
- Osterbrock & Ferland (2006) Osterbrock, D. E. & Ferland, G. J. 2006, Astrophysics of Gaseous Nebulae and Active Galactic Nuclei (2nd ed.; California:University Science Books)
- Pakull & Angebault (1986) Pakull, M. W., & Angebault, L. P. 1986, Nature, 322, 511
- Péquignot et al. (1991) Péquignot, D. Petitjean, P. & Boisson, C. 1991, A&A, 251, 680
- Pier & Krolik (1993) Pier, E. A., & Krolik, J. H. 1993, ApJ, 418, 673
- Pogge (1988) Pogge, R. W. 1988, ApJ, 328, 519
- Ramsey et al. (2006) Ramsey, C. J. et al. 2006, ApJ, 641, 241
- Sanders et al. (1989) Sanders, D. B., et al. 1989, ApJ, 347, 29
- Schlegel et al. (1994) Schlegel, E. M. et al. 1994, ApJ, 422, 243
- Scodeggio et al. (2005) Scodeggio, M. et al. 2005, PASP, 117, 1284
- Schull & McKee (1979) Shull, J. M., & McKee, C. F. 1979, ApJ, 227, 131
- Siemiginowska et al. (1995) Siemiginowska, A. et al. 1995, ApJ, 454, 77
- Tadhunter & Tsvetanov (1989) Tadhunter, C. & Tsvetanov, Z. 1989, Nature, 341, 422
- Unger et al. (1987) Unger, S. W., et al. 1987, MNRAS, 228, 671
- Wilson et al. (1988) Wilson, A. S. Ward, M. J. & Haniff, C. A. 1988, ApJ, 334, 121
- Vacca et al. (1996) Vacca, W. D. Garmany, C. D. & Shull, J. M. 1996, ApJ, 460, 914
- Yan et al. (1998) Yan, M. Sadeghpour, H. R. & Dalgarno, A. 1998, ApJ, 496, 1044
- Yao et al. (2005) Yao, Y. Wang, Q. D. & Nan Zhang, S. 2005, MNRAS, 362, 229