Optimal geometry for efficient loading of an optical dipole trap
Abstract
One important factor which determines efficiency of loading cold atoms into an optical dipole trap from a magneto-optical trap is the distance between the trap centers. By studying this efficiency for various optical trap depths (2–110 mK) we find that for optimum dipole trap loading, longitudinal displacements up to 15 mm are necessary. An explanation for this observation is presented and compared with other work and a simple analytical formula is derived for the optimum distance between the trap centers.
pacs:
37.10.Gh, 37.10.De, 37.10.VzI Introduction
Optical dipole trapping is an established tool for storing, manipulating and studying cold atomic gases Chu et al. (1986); Metcalf and van der Straten (1999); Grimm et al. (2000). Optical dipole traps (ODTs) helped to achieve Bose-Einstein condensate of several elements Barrett et al. (2001); Dumke et al. (2006); Takasu et al. (2003); Griesmaier et al. (2005); Weber et al. (2003) as well as to make ultra-stable frequency standards Takamoto et al. (2005). ODTs are also widely used for studies of various phenomena at quantum degeneracy, such as the Mott insulator – superfluid liquid transition Greiner et al. (2002).
The simplest realization of an optical dipole trap (ODT) is a single, tightly focused Gaussian laser beam, tuned far below the atomic resonance frequency. The trapping potential is proportional to the light intensity which, for a single beam, results in a highly elongated trap shape with optical potential minimum at the trapping beam focus.
The ODT needs to be loaded by a precooled gas, and a standard way of loading atoms into the ODT is to transfer them from a magneto-optical trap (MOT). Kuppens et al. Kuppens et al. (2000) discuss ways of maximizing this transfer by optimizing various parameters: MOT light intensities and detunings, magnetic field gradient, the ODT depth, and alignment of the traps. In particular, they found that controlling the geometry of the overlap of the MOT and ODT beams allows for substantial improvement of the transfer efficiency. They found that the loading rate is optimum with a longitudinal displacement between the centers of the ODT and the MOT, and that this optimum displacement increases with the ODT depth. Optimal displacements between the ODT and MOT centers reported in Ref. Kuppens et al. (2000) were about one-half of a MOT diameter (the depths of the studied ODTs were 1–6 mK). These observations were rather qualitative and not accompanied by systematic quantitative analysis.
Since the loading of the trap is a crucial step in any experimental work involving ODT, the purpose of our work was to determine quantitatively the optimum displacement between the ODT and MOT centers for maximum transfer of atoms in a wide range of the ODT depths. The trap depths were changed by varying the ODT laser power from 50 to 660 mW and detuning from 0.43 to 1.72 nm. The experimental setup and procedure are described in the next Section, while the obtained results are presented in Section III, and in Section IV we compare quantitatively our experimental results with the models described by Kuppens et al. Kuppens et al. (2000) and O’Hara et al. O’Hara et al. (2001).
II Experiment
We use a standard MOT setup with three pairs of orthogonal, retroreflected beams for trapping atoms. The trapping light, red detuned from the transition, has a total six-beam power of 15 mW. The repumping light (0.5 mW, tuned to the transition) is added to one pair of the trapping beams. The radius of the beams is 8 mm ( intensity). The resulting MOT radius is 0.66 mm ( density). After collection, the atoms are further cooled by increasing the detuning of the MOT beams to 100 MHz and decreasing the repumper intensity (see Fig. 1). At the end of the MOT cooling stage the MOT temperature reaches K, as determined from free expansion of the released atom cloud.
The dipole trap is formed by a focused beam of a Ti:Sapphire laser. The ODT beam is first expanded, then focused by a 25-cm focal length achromatic lens to a waist of 12 m. The corresponding Rayleigh length is mm. We apply the ODT beam with powers, , of 50, 100, 200, 400, and 660 mW, and red detunings from the D2 line, , of 0.43, 0.86, and 1.72 nm. The resulting trap depths determined by the ratio were = 2.1, 4.2, 8.4, 17, 33, 67, and 111 mK. For the trap-depth estimation, a possible effect of the Rb D1 line has been neglected as it does not exceed a few percent.
The transfer of the Rb atoms from the MOT to the ODT proceeded with the timing shown in Fig. 1; it is similar to the sequence used by Kuppens et al. Kuppens et al. (2000).
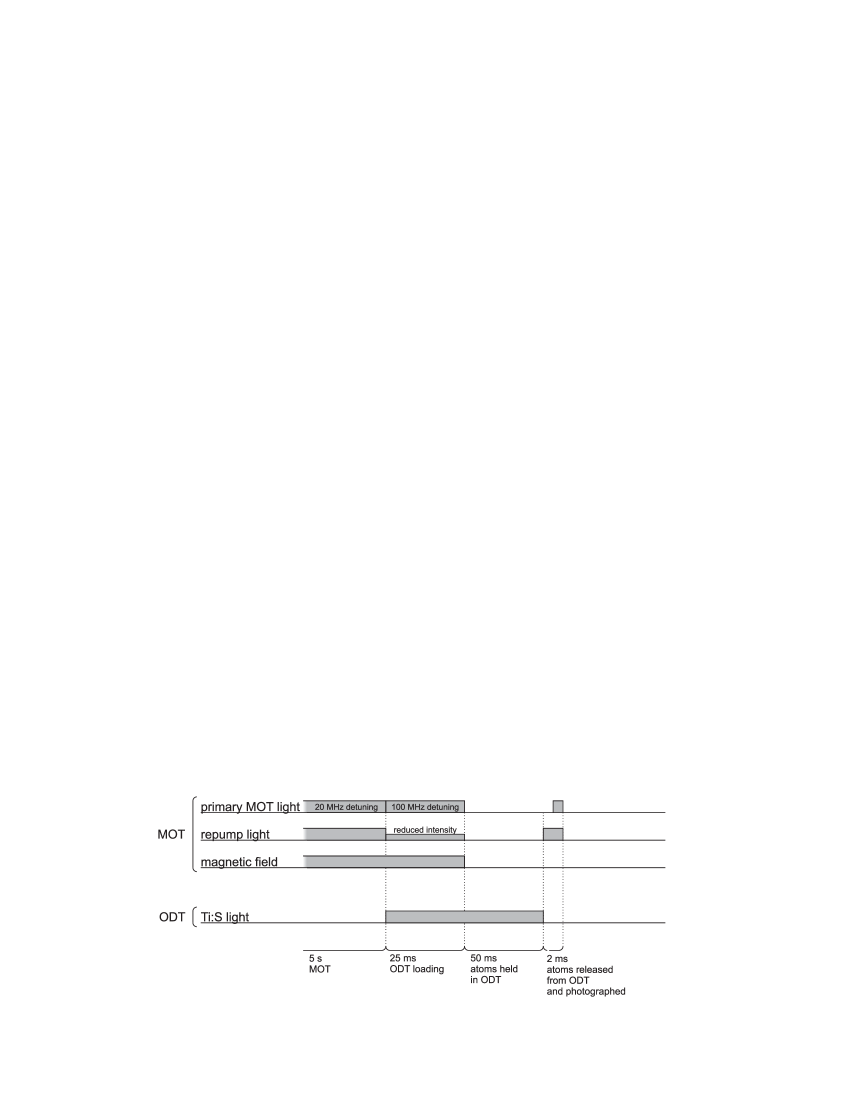
For each ODT laser power and detuning, the ODT-focus position was gradually varied relative to the MOT center. The described loading sequence (Fig. 1) was repeated for each position of the traps and the number of atoms loaded into the ODT was monitored by integrating the fluorescence image captured by the CCD camera.
III Results
Figure 2 shows the results of the loading measurements performed for the trap depth of = 33 mK. The fluorescence images of the dipole trap are presented in Fig. 2 (a) for several different positions of the ODT relative to the MOT center. Superimposed are the contours of the original MOT ( density contour) and the dipole trap (the equipotential line at ). The diffused clouds seen below the trap contours are the atoms which were not captured into the ODT, falling in the direction of gravity after MOT has been switched off. Figure 2 (b) presents the total fluorescence from the ODT, proportional to the number of trapped atoms, versus the focus position. It is evident that when the centers of MOT and ODT coincide (ODT focus position ), the number of captured atoms is over 5 times smaller than in the case of displaced ODT: mm. The observed asymmetry between positive and negative positions is attributed to geometrical imperfections. We believe that for perfect alignment of the laser beams and magnetic field, the dependences in Fig. 2 (b) should be symmetric. The difference in heights of the two curves shown in Fig. 2 (b) is most likely caused by some drift of the MOT conditions.
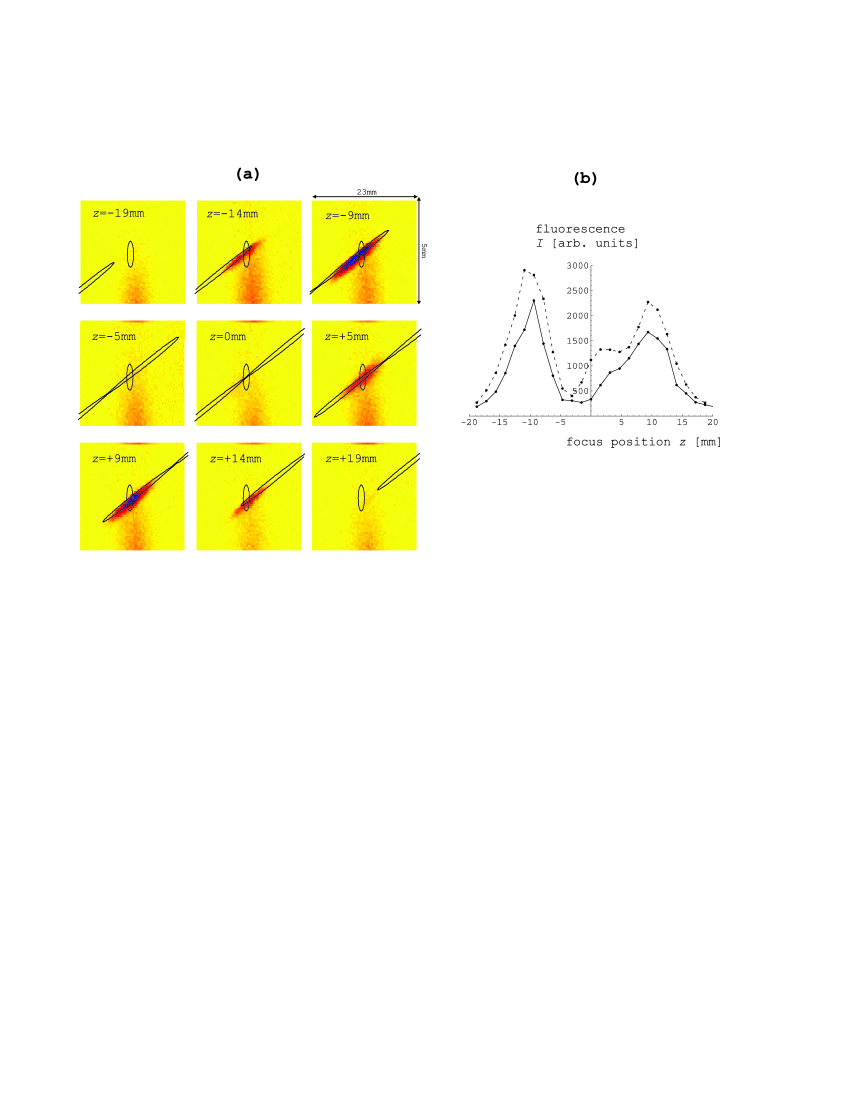
We have conducted the described measurement for a range of ODT trap depths, , between 2.1 and 111 mK. For the trap depth of 2.1 mK, we obtain a single, broad loading maximum at . The width of this maximum (FWHM) is 9 mm. For increasing ODT potential depth, the maximum broadens and eventually, at 8.4 mK, splits into two separate maxima such as shown in Fig. 2 (b).

With our fixed beam waist, the optimal separation of MOT and ODT depends only on the ratio , that is, it depends only on the ODT depth. We have verified this for trap depths of 8.4, 17, and 33 mK realized by different ODT laser powers and detunings. We have verified that optimum displacements corresponding to a given ratio were constant within the experimental error of a few percent for various combinations of and which preserved the ratio. Figure 3 presents the dependence of the optimum displacement on the trap depths. It is worth noting that in the case of the deepest optical traps realized with our maximum ODT beam power, this optimum separation reaches 15 mm. This displacement is over 10 times larger than the diameter of the MOT, whereas the optimum displacements reported in Ref. Kuppens et al. (2000) were only of the order of one-half of a MOT diameter.
IV Discussion
The dipole potential depends on the local light intensity and detuning from the atomic transition as
| (1) |
where denotes transition linewidth Kuppens et al. (2000). The intensity of a focused Gaussian beam of power is described by
| (2) |
where are the cylindrical coordinates, and:
| (3) |
is the beam radius. The characteristic dimension in the radial direction is the beam waist , while in the axial direction it is the Rayleigh length .
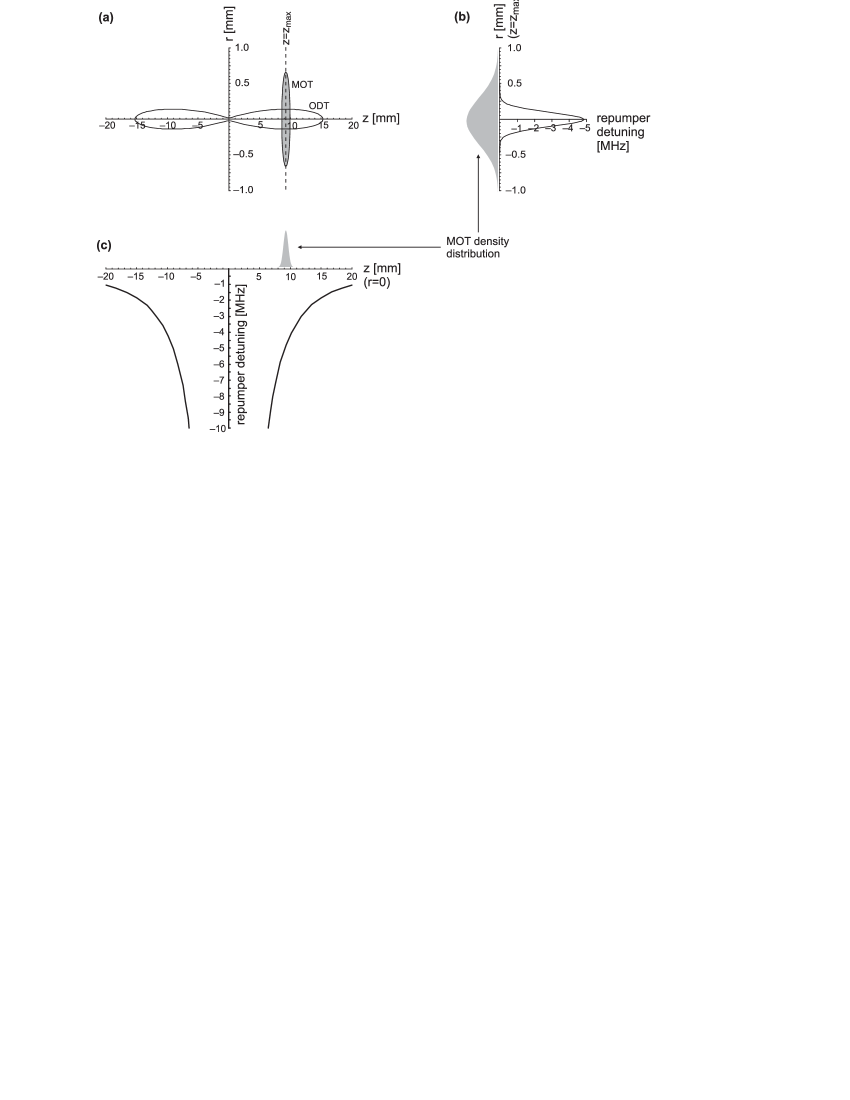
The resulting trapping potential is visualized in Fig. 4. The potential is harmonic near the focus, with ellipsoidal equipotential surfaces. However, the more distant equipotential surfaces are qualitatively different from the inner ones, and acquire characteristic peanut shape. From equations (1) and (2) one can deduce that the equipotential surfaces change their character when becomes smaller than , where is the trap depth and is the base of the natural logarithm. The equipotential surfaces with have two locations where their circumference is maximized:
| (4) |

We will now compare our experimental data with the two models of the ODT loading described in the literature Kuppens et al. (2000); O’Hara et al. (2001).
Kuppens et al. Kuppens et al. (2000) assume that the initial loading rate is proportional to the MOT atomic density , the mean velocity of atoms , the effective surface area of ODT, , and the trapping probability, . The first three parameters contribute to the flux of atoms into the ODT volume. When studying geometrical effects, it is important to consider the effective surface area . As the Rayleigh length is much larger that the size of the MOT, the radii of the ODT equipotential surfaces change insignificantly over the MOT region (see also Fig. 6(a) below). The effective surface area across which atoms are loaded into the ODT is then proportional to the local radius of the ODT. The crucial question in this reasoning is: which of the equipotential surfaces should represent the “surface of the ODT”. Kuppens et al. assume the surface , where the ODT potential is comparable to the kinetic energy of atoms in the MOT.
In order to compare quantitatively our data with the model described above, we write the equation describing the ODT surface as and look for a scaling factor , of the order of unity, which gives the best fit to our data. Equation (4) now takes the form
| (5) |
Using the least-squares method, we find that Eq. (5) best describes our experiment for . The result of this fitting is shown by the solid line in Fig. 3. It turns out that despite its simplicity, the model by Kuppens et al. gives a good qualitative description of our data, but needs the scaling factor to be determined from the experiment.
Another related work is that of O’Hara et al. O’Hara et al. (2001) who developed a microscopic model of ODT loading based on the Fokker-Planck equation. Their model is capable of describing the spatial and temporal changes of the atom density during ODT loading. For comparison with our results, the relevant equation is the expression for the initial number of atoms contained in the trap (O’Hara et al. (2001), Eqs. 11, 12)
| (6) |
where is the beam radius (the width of the ODT potential in the radial direction), and are the radius and the density of the MOT cloud, respectively, and . The calculations of O’Hara et al. were performed for the case when MOT and ODT centers coincide, but remain valid also if the centers are displaced axially. Then in Eq. (6) is treated not as a global trap depth , but as a local trap depth for a particular axial position :
| (7) |
(compare Eqs. (1) and (2)). On the other hand, the local beam radius increases from its initial value as one moves away from the focus, according to Eq. (3). Consequently, as the axial coordinate increases, the trap becomes shallower and more energetic atoms remain untrapped. On the other hand, the trap also becomes broader and atoms are captured from a larger volume. The balance of these two competing mechanisms results in a maximum loading for a certain displacement between the MOT and ODT centers.
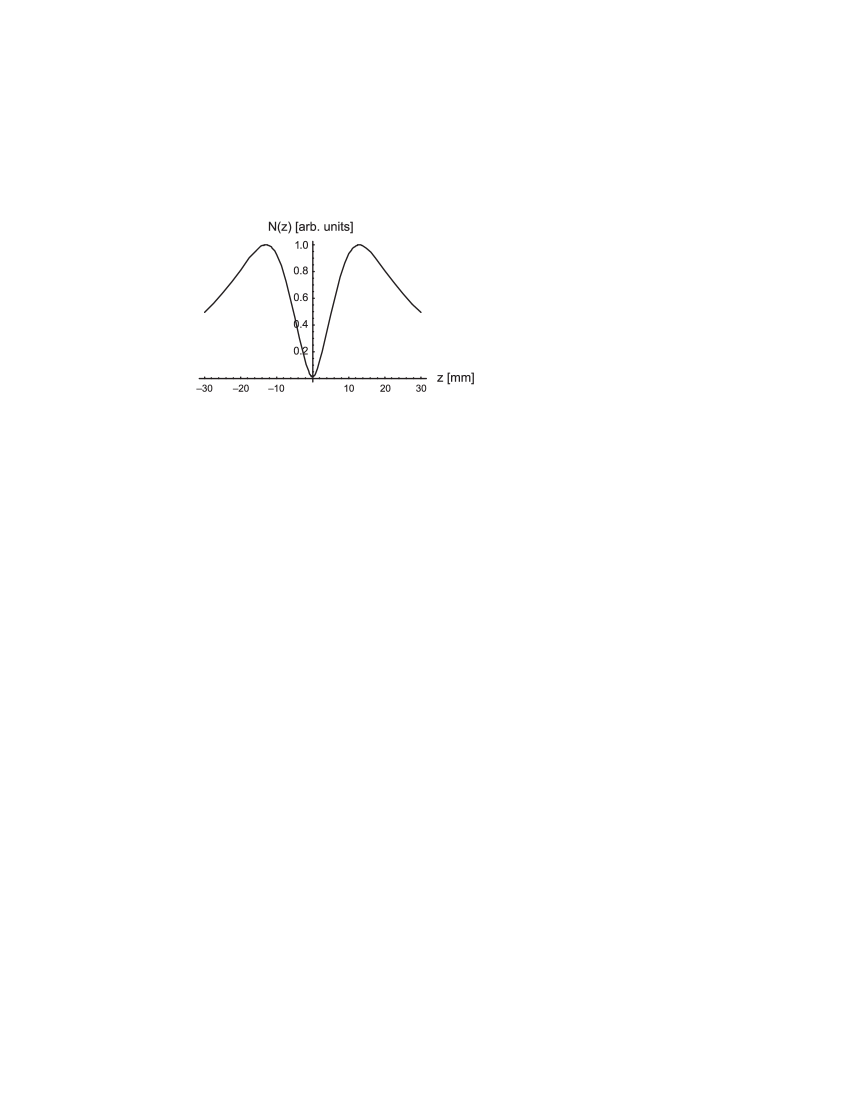
The initial number of trapped atoms has been calculated according to Eq. (6) for different displacements z, treating the parameters and as -dependent. The resulting function is plotted in Fig. 5 for the trap depth mK. Note the maximum at mm, close to our experimental result: mm (see Fig.3). Similarly, we calculated the maxima of the function for different trap depths and the result is shown by the dashed line in Fig. 3. It agrees qualitatively with the experimental data, but for deeper traps the predicted optimum displacement is overestimated. Nevertheless, the agreement is remarkable for a model that does not require any free parameters. It should be stressed that the model described by O’Hara et al. was developed for lithium atoms in laser traps, where the trap-induced light shift of the atomic transition frequency is small O’Hara et al. (2001). This is not the case of our experiment, hence this may be the main reason of the discrepancy between our data and the model of O’Hara et al.
Under conditions of our experiment, the frequency shifts for the MOT trapping and repumping transitions may be taken with good accuracy as , where is the ODT potential which takes into account solely the D2 line. As it was already mentioned above, under our experimental conditions, the excited state makes the most important contribution to the ODT potential and light shifts. Other states, and , contribute nearly two orders of magnitude less and can be neglected at the current level of experimental precision. The light shift also modifies the trapping transition but, given the large detuning (100 MHz) of the MOT beams in the loading phase, its effect on the trapping-beam detuning is negligible. On the other hand, since the repumper beam is resonant, the repumping efficiency at is reduced by about a factor of four (for all trap depths) which allows to accumulate atoms in the dark ground state. In Fig. 6, we compare the spatial ranges in which the light shift generates the repumper detuning with the spatial MOT extension calculated for the trap depth of 33 mK. As can be seen in Figure 6(b), this reduction affects only the central part of the MOT which, consequently, results in a “dark spot” effect which is known to increase the MOT density Ketterle et al. (1993) and enhance the trap loading process Dürr et al. (2000). Figure 6(c) shows that the light-shift-induced detuning of the repumper beam, and consequently the dark spot effect, decrease for increasing . For , which would be the optimum displacement predicted from the model of O’Hara et al., the repumper detuning amounts only 2.5 MHz and the dark spot effect is much weaker. Thus, the light shift and the related dark-spot effect decrease the optimum MOT–ODT displacement relative to the predictions of Ref. O’Hara et al. (2001), as illustrated in Figure 3. We believe this is the main source of discrepancy between our results and the model of O’Hara et al. which refers to the case of negligible light-shifts.
Another factor of potential importance for the ODT dynamics is the photon scattering rate. With a trap relatively close to resonance, such as ours, the spontaneous photon scattering leads to atom heating and, eventually, to atom loss. We have estimated the heating rates under conditions of our experiment. For the deepest trap of 111 mK the scattering rate is 430 kHz and the heating during the 50 ms holding time is estimated to be about 2 mK. This estimation was done for the trap center, whereas, as we demonstrated, the atoms are most efficiently trapped far off the center (15mm), where the light intensity is significantly lower and the local scattering rate is only 530 Hz. Thus, we believe that it is safe to neglect this mechanism in the case of our experiment.
V Summary
We have performed a systematic study of the efficiency of the ODT loading from a MOT as a function of geometrical arrangement of the ODT and MOT in a wide range of ODT depths (2 to 110 mK). We have observed that for the optimum loading the trap centers need to be displaced in the direction of the ODT beam. While similar conclusion was formulated earlier in Ref. Kuppens et al. (2000), we were able to verify it in a more than 20-times wider range. We confirmed that the optimum displacement depends only on the trap depth, i.e., on the ratio between the trap light power and its detuning. Analyzing the optimum displacements, we were able to quantitatively compare our results with the existing models of Kuppens et al. Kuppens et al. (2000) and O’Hara et al. O’Hara et al. (2001). Our data are well described by the former model after fitting of a scaling factor and agree qualitatively with the latter model without any free parameters.
Based on the present work, we propose the following semi empirical formula for the optimal trap displacement:
| (8) |
Acknowledgements.
This work was partly supported by Polish Ministry of Science, grant no. NN202175835. A.S. acknowledges also the funding from the University of Wrocław, grant no. 2016/W/IFD/2005.References
- Chu et al. (1986) S. Chu, J. Bjorkholm, A. Ashkin, and A. Cable, Phys.Rev. Lett. 57, 314 (1986).
- Metcalf and van der Straten (1999) H. J. Metcalf and P. van der Straten, Laser cooling and trapping (Springer, 1999).
- Grimm et al. (2000) R. Grimm, M. Weidemüller, and Y. Ovchinnikov, Adv. At. Mol. Opt. Phys. 42, 95 (2000).
- Barrett et al. (2001) M. Barrett, J. Sauer, and M. Chapman, Phys. Rev. Lett. 87, 010404 (2001).
- Dumke et al. (2006) R. Dumke, M. Johanning, E. Gomez, J. Weinstein, K. Jones, and P. Lett, New J. Phys. 8, 64 (2006).
- Takasu et al. (2003) Y. Takasu, K. Maki, K. Komori, T. Takano, K. Honda, M. Kumakura, T. Yabuzaki, and Y. Takahashi, Phys. Rev. Lett. 91, 040404 (2003).
- Griesmaier et al. (2005) A. Griesmaier, J. Werner, S. Hensler, J. Stuhler, and T. Pfau, Phys. Rev. Lett. 94, 160401 (2005).
- Weber et al. (2003) T. Weber, J. Herbig, M. Mark, H.-C. Nägerl, and R. Grimm, Science 299, 232 (2003).
- Takamoto et al. (2005) M. Takamoto, F.-L. Hong, R. Higashi, and H. Katori, Nature 435, 321 (2005).
- Greiner et al. (2002) M. Greiner, O. Mandel, T. Esslinger, T. W. Hänsch, and I. Bloch, Nature 415, 39 (2002).
- Kuppens et al. (2000) S. Kuppens, K. Corwin, K. Miller, T. Chupp, and C. Wieman, Phys. Rev. A 62, 013406 (2000).
- O’Hara et al. (2001) K. O’Hara, S. Granade, M. Gehm, and J. Thomas, Phys. Rev. A 63, 043403 (2001).
- Ketterle et al. (1993) W. Ketterle, K. B. Davis, M. A. Joffe, A. Martin, and D. E. Pritchard, Phys.Rev. Lett. 70, 2253 (1993).
- Dürr et al. (2000) S. Dürr, K. W. Miller, and C. E. Wieman, Phys. Rev. A 63, 011401 (2000).