Dusty Cometary Globules in W5
Abstract
We report the discovery of four dusty cometary tails around low mass stars in two young clusters belonging to the W5 star forming region. Fits to the observed emission profiles from 24 observations with the Spitzer Space Telescope give tail lifetimes 30 Myr, but more likely 5 Myr. This result suggests that the cometary phase is a short lived phenomenon, occurring after photoevaporation by a nearby O star has removed gas from the outer disk of a young low mass star (see also Balog et al., 2006; Balog et al., 2008).
1 Introduction
Recent observations with the Multiband Imaging Photometer for Spitzer (MIPS) have discovered dusty nebulae associated with several young stars in three Galactic star forming regions (Balog et al., 2006). Appearing as extended, cometary objects pointing away from nearby O stars at 24 , (and sometimes at 8 ), they resemble the proplyds seen in Orion with HST (O’Dell et al., 1993; O’Dell & Wen, 1994). Balog et al. (2006) show that these cometary tails are probably dust swept out of a young circumstellar disk by an O star.
Balog et al. (2006) show that the emission profiles at 24 and 8 can be explained by a model where gas is photoevaporated from a young protoplanetary disk. As the gas leaves, entrained dust also escapes and is then blown away from the disk by radiation pressure from nearby O stars. The dust is swept into a cometary morphology which glows in the mid-IR thermally as it reprocesses the incident UV radiation to longer wavelengths. Balog et al. (2006) cite Johnstone et al. (1998), Richling & Yorke (2000), Hollenbach & Adams (2004) and Matsuyama et al. (2003), who find that the portion of a protoplanetary disk likely responsible for emission at 24 (2–50 AU from the star) is removed on timescales 3 yr.
We have recently discovered four dusty cometary structures in the W5 star forming region. Here we expand on the work of Balog et al. (2006) and place constraints on the lifetimes and physical nature of these interesting objects.
2 Observations
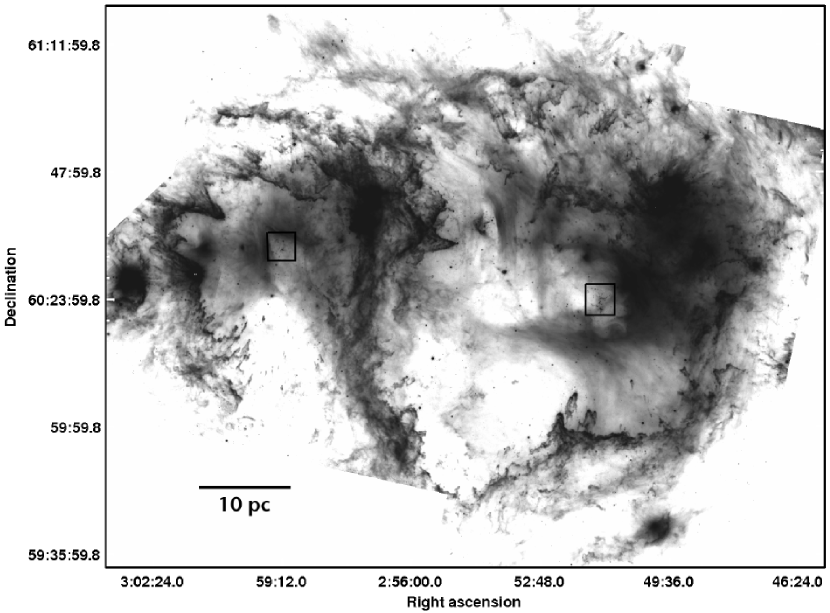
Koenig et al. (2008) describe our observations of W5. We observed a 21.5 field with the Infrared Array Camera (IRAC) and MIPS in 2006 and 2007. Figure 1 shows the MIPS 24 image mosaic. Images were taken in scan map mode using the medium scan speed for an average exposure time of 41.9 seconds per pixel for the combined frames. The raw MIPS data were processed with pipeline version S13.2.0. The final mosaics were produced using the MIPS instrument team Data Analysis Tool, which calibrates the data and applies a distortion correction to each individual exposure before combining (Gordon et al., 2005). We used the clustergrinder software tools (described in Gutermuth et al., 2008) to produce final image mosaics from the IRAC data in each of the four wavelength bands.
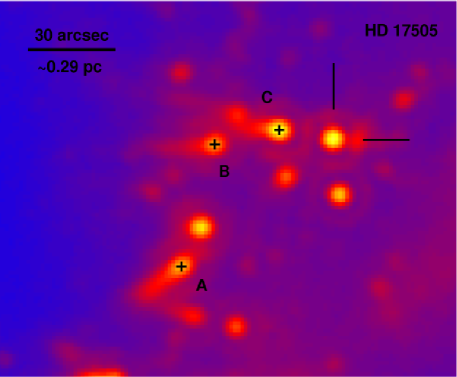
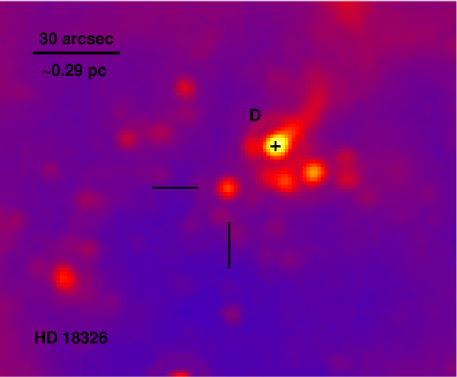
Figure 2 shows the 24 cometary objects at larger scale. At wavelengths shorter than 24 , these objects are point-like or not detected. At 70 and 160 , these objects are also invisible. Table 1 summarises the properties of the four objects in W5. The quoted 24 flux is for the heads of the cometary features alone.
3 Analysis
We follow Balog et al. (2006) and analyze these objects using an adaptation of the Vega debris disk model of Su et al. (2005). We assume the outward flow has roughly constant radial density: constant. We fit the emission profile of a 5 pixel (6.23) wide strip along the symmetric axis of the tail. To estimate and subtract the background, we extend the strip to reach regions free of diffuse emission and point sources.
The fit to the resultant surface brightness profile is based on optically thin emission from dust at its equilibrium temperature. The emission depends on dust composition, dust grain size, and the angle that the tail makes with the plane of the sky (inclination), where 0 corresponds to a tail in the plane of the sky. We adopt astronomical silicates for the dust composition. Due to the degeneracy between tail inclination and dust grain size (Balog et al., 2006), and the lack of reliable constraints on these parameters, we assume an inclination of 0 and fit the profile adopting a single grain size.
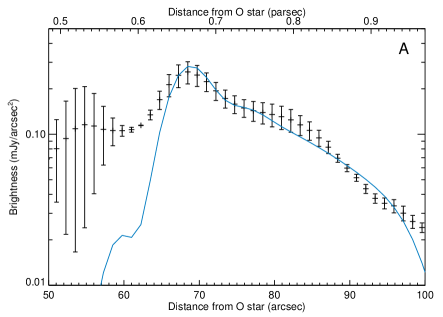
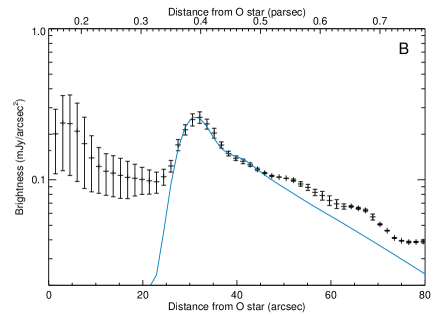
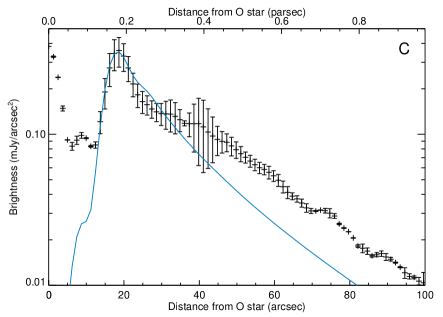
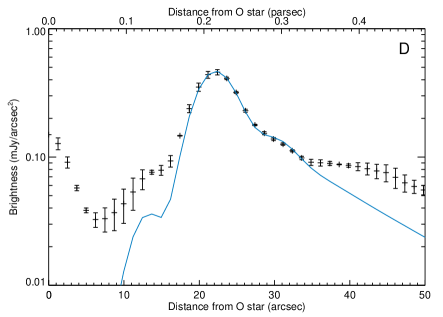
The fits to the 24 emission profiles are shown in Figure 3. Error bars on the profile points are derived by extracting the emission profile to either side of the main axis and taking the difference between the two extractions as the error at each point. Tails A, B and C are formed by the multiple O star system HD 17505 which contains at least four O stars (Hillwig et al., 2006). We model the radiation output of this system as a single star with effective temperature = 35000 K and radius . Tail D is most likely formed by the O7V star HD 18326. We adopt = 36000 K and . The model provides reasonable fits to the dust emission profiles at 24 , however all of the fits diverge from the data at either end due to contamination from nearby stars.
At 8 , our model predicts a flux of 0.0025 mJy for tail A. This flux is consistent with the upper limit listed in Table 1. For tails B and D the model underpredicts the 8 flux by more than an order of magnitude. Tail C is a more complex case. Due to crowding, we could not derive a precise flux for this object. The model predicts a flux 5 times the upper limit quoted in Table 1 for tail C. For tails B and D, the enhanced level of 8 emission in our data is probably produced by stochastically heated small grains, 10Å in size as suggested by Balog et al. (2006). To test whether this is also true for tails A and C requires improved measurements of the flux at 8 .
Optical and near infrared observations of the dusty tails in NGC 2264, IC 1396 and NGC 2244 (Balog et al. 2008) suggest that these tail structures are strongly deficient in gas. If gas does not entrain the dust away from the circumstellar disk, another mechanism must produce these structures. We propose that radiation pressure from nearby O stars ejects the dust directly. To test this idea, we calculate the radius, within the stellar disk where radiation pressure exceeds the gravitational binding energy or dust in orbit around its host star (see Burns et al., 1979). For a star of mass :
| (1) |
where is the distance from the tail head to an O star with luminosity , and is the frequency averaged radiation pressure coefficient (1 for an O star and astronomical silicate dust grains; Laor & Draine 1993)111The expression for assumes grains produced from collisions of larger objects. For primordial grains orbiting the central star, is a factor of larger.. For a 1 M☉ host star and grains of size = 0.01 , and density = 3.3 g cm-3, = 9–35 AU. For 10 grains, 500 AU, the typical protostellar disk radius (Andrews & Williams, 2007). Thus radiation pressure can eject grains with 3 .
Table 2 lists two values for the tail mass. The lower limit assumes a single grain size of 0.01 . The upper limit assumes a size distribution from 0.01 up to the grain size at which AU. We adopt the size distribution of Dohnanyi (1969) and Tanaka et al. (1996), for a grain population formed by a collisional fragmentation cascade in a protoplanetary disk, normalize the mass in 0.1 grains required to fit the surface brightness distribution (Fig. 3) and integrate over grain size. Recently, Jorda et al. (2007) and Holsapple & Housen (2007) found a different power law () for dust grains in the Deep Impact ejecta experiment, which would result in a factor 10 greater tail mass.
To derive a simple mass-loss rate for each tail, we divide the estimated tail mass by the projected tail length over the flow velocity (following Balog et al. 2008 we use the drift velocity given by eqn. B.4 of Abergel et al., 2002). To derive an expected lifetime, we adopt a minimum mass solar nebula as specified by Weidenschilling (1977) and Hayashi et al. (1985) as a dust reservoir and find a total mass = 0.034 M☉ between radii 20–350 AU. Assuming the dust mass is a factor 100 smaller, the mass loss rates yield lifetimes of 0.3–30 Myr (Table 2). We note that Andrews & Williams (2007) find a range in disk masses around young stars, such that could be as much as a factor 10 larger.
4 Discussion
The initial phase of a young stellar disk’s evolution is the optically-thick phase. This period lasts a few to 10 Myr; during this time, excess emission from dust in the circumstellar disk in the Spitzer IRAC bands (3–8 ) is visible, as are signatures of accretion onto the star (Sicilia-Aguilar et al., 2005, 2006). The cometary tails in W5 are unlikely to be older than 5 Myr. Since massive O stars are present and non-thermal radiation is largely absent (which would be the signature of a supernova having previously occurred), 5 Myr is a conservative age upper limit for W5 (Karr & Martin, 2003; Vallée et al., 1979). During this early phase, UV radiation from nearby O stars will photoevaporate the outer disk of stars in their clusters, creating proplyds such as those seen in Orion (O’Dell et al., 1993; O’Dell & Wen, 1994). Balog et al. (2008) suggest that after this part of the disk is removed, micron-size dust grains are replenished by collisions between already-formed planetesimals and then blown out by radiation pressure, creating the cometary tails seen at 24 . We consider this scenario somewhat unlikely in such young disks. Kenyon & Bromley (2001) find that a size distribution of bodies can stir up planetesimals enough to begin a collisional cascade capable of making small dust grains in the outer 30–150 AU of a disk, only if it contains objects of 500 km radius or larger, which need at least 10 Myr to form at this distance from the star (Kenyon & Bromley, 2008). Since we find that the dust grains that create the tails come from beyond 10 AU they must have remained in the disk and survived being completely dragged out as the gas departs during photoevaporation.
We note that some of the objects could be older than the O stars and have migrated in to their present location. This scenario requires an earlier generation of stars (5–10 Myr ago) to have formed in a cluster of 1000 stars within 5 pc of HD 17505 or HD 18326. In addition, faster planet formation (e.g. by disk instability, or induced by the radiative environment Boss, 2006; Throop & Bally, 2005) might allow the planetesimal stirring and collisional cascade mechanism to operate and create the small dust grains that make up the cometary tails. The dust may not remain long enough in such a disk to make detection likely however (Kenyon & Bromley, 2008).
Tails A, B and C belong to the large double cluster of young stellar objects (YSO) surrounding O stars HD 17505 and HD 17520. This cluster has a projected radius on the sky of 3 pc, within which are 146 stars classified by Koenig et al. (2008) as class II stars with disks, i.e. stars in the optically thick disk phase, including tails A, B and C. If the cluster is spherical and uniformly distributed we would expect 1.54 objects within a spherical radius 0.67 pc (the distance of tail A from HD 17505). Similarly tail D belongs to the cluster around HD 18326 which has a radius of 1.8 pc and 87 YSO/optically thick disk objects. Within a 0.22 pc radius (that would encompass tail D) we would predict 0.16 objects. Given that projection effects mean we should see only one third of these objects as extended, it is likely that all objects with disks capable of producing cometary tails within 0.7 pc of an O star are doing so.
Not all O stars appear to create tails however. Within W5, 2 O star systems (several are binary or multiple) out of 5 possess cometary objects at 24 . Spitzer observations of star forming regions with MIPS (GTO program ID 58) have found 3 more out of a sample of 20 O stars (Balog et al., 2006). This sample includes the Orion Trapezium region which is saturated at 24 but does contain the well known optically visible proplyds (O’Dell et al., 1993). The timescale of the mid-infrared cometary phase may thus be closer to the short end of our estimated range.
5 Conclusions
We have discovered four dusty cometary tails in W5 at 24 with Spitzer MIPS. An apparent deficit of gas suggests an origin in radiation pressure blowout of dust from a young stellar disk by nearby O stars. Future observations with high sensitivity, high spatial resolution mid-infrared and sub-millimeter instruments will help constrain their nature.
Facilities: 2MASS (), Spitzer (IRAC, MIPS)
References
- Abergel et al. (2002) Abergel, A., et al. 2002, A&A, 389, 239
- Andrews & Williams (2007) Andrews, S. M., & Williams, J. P. 2007, ApJ, 659, 705
- Balog et al. (2006) Balog, Z., Rieke, G. H., Su, K. Y. L., Muzerolle, J., & Young, E. T. 2006, ApJ, 650, L83
- Balog et al. (2008) Balog, Z., Rieke, G. H., Muzerolle, J., Bally, J., Su, K. Y. L., Misselt, K., & Gáspár, A. 2008, ApJ, in press (astro-ph/0807.3724)
- Boss (2006) Boss, A. P. 2006, ApJ, 644, L79
- Burns et al. (1979) Burns, J. A., Lamy, P. L., & Soter, S. 1979, Icarus, 40, 1
- Carpenter (2000) Carpenter, J. M. 2000, AJ, 120, 3139
- Currie et al. (2008) Currie, T., Kenyon, S. J., Balog, Z., Rieke, G., Bragg, A., & Bromley, B. 2008, ApJ, 672, 558
- Dohnanyi (1969) Dohnanyi, J. W. 1969, J. Geophys. Res., 74, 2531
- Gordon et al. (2005) Gordon, K. D., et al. 2005, PASP, 117, 503
- Gutermuth et al. (2008) Gutermuth, R. A., et al. 2008, ApJ, 674, 336
- Hayashi et al. (1985) Hayashi, C., Nakazawa, K., & Nakagawa, Y. 1985, in Protostars and Planets II, ed. D. C. Black & M. S. Mathews (Tucson: Univ. Arizona Press), 1100
- Hillwig et al. (2006) Hillwig, T. C., Gies, D. R., Bagnuolo, Jr., W. G., Huang, W., McSwain, M. V., & Wingert, D. W. 2006, ApJ, 639, 1069
- Hollenbach & Adams (2004) Hollenbach, D., & Adams, F. C. 2004, in ASP Conf. Ser. 324, Debris Disks and the Formation of Planets, ed. L. Caroff et al. (San Francisco: AP), 168
- Holsapple & Housen (2007) Holsapple, K. A. & Housen, K. R. 2007, Icarus, 191, 586
- Johnstone et al. (1998) Johnstone, D., Hollenbach, D., & Bally, J. 1998, ApJ, 499, 758
- Jorda et al. (2007) Jorda, L., et al. 2007, Icarus, 187, 208
- Karr & Martin (2003) Karr, J. L., & Martin, P. G. 2003, ApJ, 595, 900
- Kenyon & Bromley (2001) Kenyon, S. J., & Bromley, B. C. 2001, AJ, 121, 538
- Kenyon & Bromley (2008) Kenyon, S. J. & Bromley, B. C. 2008, preprint (astro-ph/0807.1134)
- Koenig et al. (2008) Koenig, X. P., Allen, L. E., Gutermuth, R. A., Hora, J. L., Brunt, C. M., & Muzerolle, J. 2008, ApJ, submitted
- O’Dell et al. (1993) O’Dell, C. R., Wen, Z., & Hu, X. 1993, ApJ, 410, 696
- O’Dell & Wen (1994) O’Dell, C. R., & Wen, Z. 1994, ApJ, 436, 194
- Lada & Lada (2003) Lada, C. J., & Lada, E. A. 2003, ARA&A, 41, 57
- Laor & Draine (1993) Laor, A., & Draine, B. T. 1993, ApJ, 402, 441
- Matsuyama et al. (2003) Matsuyama, I., Johnstone, D., & Murray, N. 2003, ApJ, 585, L143
- Porras et al. (2003) Porras, A., Christopher, M., Allen, L., Di Francesco, J., Megeath, S. T., & Myers, P. C. 2003, AJ, 126, 1916
- Richling & Yorke (2000) Richling, S., Yorke, H. W. 2000, ApJ, 539, 258
- Rieke et al. (2005) Rieke, G. H. et al. 2005, ApJ, 620, 1010
- Sicilia-Aguilar et al. (2005) Sicilia-Aguilar, A., Hartmann, L. W., Hernández, J., Briceño, C. & Calvet, N. 2005, AJ, 130, 188
- Sicilia-Aguilar et al. (2006) Sicilia-Aguilar, A. et al. 2006, ApJ, 638, 897
- Skrutskie et al. (2006) Skrutskie, M. F., et al. 2006, AJ, 131, 1163
- Su et al. (2005) Su, K. Y. L., et al. 2005, ApJ, 628, 487
- Tanaka et al. (1996) Tanaka, H., Inaba, S., & Nakazawa, K. 1996, Icarus, 123, 450
- Throop & Bally (2005) Throop, H. B., & Bally, J. 2005, ApJ, 623, L149
- Vallée et al. (1979) Vallée, J. P., Hughes, V. A., & Viner, M. R. 1979, A&A, 80, 186
- Weidenschilling (1977) Weidenschilling, S. J. 1977, Ap&SS, 51, 153
| R.A. | Declination | |||||||||
|---|---|---|---|---|---|---|---|---|---|---|
| J2000.0 | J2000.0 | (mJy) | (mJy) | (mJy) | (mJy) | (mJy) | (mJy) | (mJy) | (mJy) | |
| A | 2 51 15.17 | 60 24 20.31 | 0.006 | 0.007 | 0.035 | 0.048 | 193 | |||
| B | 2 51 13.53 | 60 25 02.36 | 0.400.04 | 0.270.02 | 0.150.05 | 0.190.05 | 162 | |||
| C | 2 51 10.49 | 60 25 07.15 | 0.006 | 0.007 | 0.035 | 0.048 | 262 | |||
| D | 2 59 20.91 | 60 34 14.82 | 0.430.09 | 0.540.12 | 0.690.12 | 0.420.04 | 0.320.04 | 0.180.08 | 0.590.06 | 373 |
Note. — photometry obtained from 2MASS catalog (Skrutskie et al., 2006). We obtained the remaining photometry in Spitzer bands at tail head position, using aperture photometry.
| Tail Length | (0.01 grains) | Tail Dust Mass‡ | Lifetime | |||
|---|---|---|---|---|---|---|
| (pc) | (AU) | (10-6 M⊙) | km s-1 | (Myr) | ||
| A | 0.3 | 34.5 | 1 | 0.15 – 1.5 | 40 | 1.6 – 15.8 |
| B | 0.49 | 20.2 | 3 | 0.08 – 1.3 | 70 | 1.6 – 30.1 |
| C | 0.62 | 9.3 | 10 | 0.06 – 4.7 | 150 | 0.3 – 24.5 |
| D | 0.29 | 23.6 | 3 | 0.14 – 2.4 | 55 | 0.7 – 12.6 |
Note. — †Maximum grain size evacuated from disk under assumption that no significant material exists beyond 350 AU. ‡Tail dust masses for assumed single grain size and for power-law grain size distribution.