11email: [annan;msz]@astro.uni.torun.pl 22institutetext: Max-Planck-Insitut für Radioastronomie, Auf dem Hügel 69, 53121 Bonn, Germany
22email: brunthal@mpifr-bonn.mpg.de 33institutetext: Joint Institute for VLBI in Europe, Postbus 2, 7990 AA Dwingeloo, The Netherlands
33email: langevelde@jive.nl 44institutetext: Sterrewacht Leiden, Leiden University, Postbus 9513, 2300 RA Leiden, The Netherlands 55institutetext: Harvard-Smithsonian Center for Astrophysics, 60 Garden Street, Cambridge, MA 02138, USA
55email: reid@cfa.harvard.edu
The nature of the methanol maser ring G23.65700.127
Abstract
Context. Methanol masers are associated with young high-mass stars and are an important tool for investigating the process of massive star formation.
Aims. The recently discovered methanol maser ring in G23.65700.127 provides an excellent “laboratory” for a detailed study of the nature and physical origin of methanol maser emission, as well as parallax and proper motion measurements.
Methods. Multi-epoch observations of the 12.2 GHz methanol maser line from the ring were conducted using the Very Long Baseline Array. Interferometric observations with milliarcsecond resolution enabled us to track single maser spots in great detail over a period of 2 years.
Results. We have determined the trigonometric parallax of G23.65700.127 to be 0.3130.039 mas, giving a distance of kpc. The proper motion of the source indicates that it is moving with the same circular velocity as the LSR, but it shows a large peculiar motion of km s-1 toward the Galactic center.
Key Words.:
stars: formation – ISM: molecules – masers – interferometric - astrometry – individual: (G23.65700.127)1 Introduction
Two spectral lines of methanol masers, 6.7 GHz and 12.2 GHz, are strongly associated with young high–mass stars or protostars and enable one to investigate the stellar environment on scales of 100–1000 AU in great detail (Menten menten (1991); Moscadelli et al. moscadelli (1999); Minier et al. minier00 (2000)). Interferometric studies of methanol masers have been carried out for more than ten years in order to constrain how and where massive stars are being born (Norris et al. norris (1998); Phillips et al. phillips (1998); Walsh et al. walsh98 (1998); Dodson et al. dodson (2004)). We started interferometric studies of the 6.7 GHz masers discovered in the Toruń unbiased survey towards the Galactic plane (Szymczak et al. szymczak02 (2002)).
One source, G23.65700.127, was imaged during the European VLBI Network (EVN) session in 2004 when eight antennas were working for the first time at 5 cm wavelength. These observations revealed a new class of spherically symmetric methanol maser sources (Bartkiewicz et al. bartkiewicz (2005)). The “ring” of masers in G23.65700.127 has a mean radius of 127 mas. Its circular geometry makes it a unique laboratory for detailed study of a methanol maser in an isolated massive star forming region. However, the morphology and velocity signature of the maser spots at 6.7 GHz did not allow us to determine unambiguously the origin of the ring–like structure. Therefore we started VLBI observations of the 12.2 GHz methanol maser line following its detection with the Toruń 32 m antenna.
In this paper we report multi–epoch observations of G23.65700.127 at 12.2 GHz using the NRAO111The National Radio Astronomy Observatory is operated by Associated Universities, Inc., under a cooperative agreement with the National Science Foundation. Very Long Baseline Array (VLBA). We focus on the measurement of the source parallax and proper motion, providing a reliable distance. Maser variability and internal proper motion studies for both the 6.7 and 12.2 GHz lines will be presented in a separate paper.
2 Observations and data analysis
2.1 Observations
Our first interferometric observations of the methanol maser in G23.65700.127 at 12178.597 MHz using the NRAO Very Large Baseline Array (VLBA) were carried out on 2005 November 28 (epoch 1). After successfuly detecting and imaging the maser we made five additional observations between 2006 June 10 and 2007 June 19 (see details in Table 1). Ten antennas were used during all sessions but only nine antennas were working in epoch 3, as Hancock was not available then. Each observation lasted 10 hours and we used one 8 MHz band in dual circular polarization mode. The band was centered at the Local Standard of Rest (LSR) velocity of 83 km s-1, which corresponded to the brightest feature of 6.7 GHz emission (Bartkiewicz et al. bartkiewicz (2005)).
We used the VLBA calibrator J1825–0737 (Fomalont et al. fomalont (2003)) as the phase-reference source. The flux densities of the phase calibrator in all observing sessions are summarized in Table 1. The pointing position for G23.65700.127 was chosen to be near the brightest spots detected at 6.7 GHz: RA18h34m51565, Dec=08°18′213045 (J2000). The separation between the phase-reference and maser source was 24. For epoch 1 we used a 2.5 min switch cycle between the phase reference source (slewing plus on-source time = 1 min) and the maser source (slewing plus on-source time = 1.5 min). The total on-source time for the maser was 5 hours. In addition, we observed the strong source, J18240119 (Petrov et al. petrov (2005)), every hour for 2 min in order to improve the delay calibration. 3C454.3 was used as a fringe finder (Ma et al. ma (1998)).
Starting with the second epoch, we shortened the time devoted to the maser source from 1.5 to 1.0 min, in order to obtain better phase transfer. We also included a second extragalactic background source, J18330855 (Xu et al.xu (2006)), alternating with 16 min cycles of rapid switching between J1825–0737 and J1833–0855 and between J1825–0737 and G23.65700.127. Unfortunately, J1833–0855 was not useful for astrometry, since the source was weak, partially resolved and not detected in all epochs. The total on-source time for the maser was 2.3 hours for epochs 2 – 6.
Starting with epoch 2, we also performed geodetic–like observations using 39 ICRF quasars whose positions were known to better than 1 mas. Typically 17 quasars were observed over a timespan of 40 min, with a frequency setup involving eight 4 MHz bands at left circular polarization that spanned a frequency range of 470 MHz. Three of these blocks were placed at the beginning, in middle and end of these five sessions. This enabled us to estimate tropospheric zenith delay errors and clock offsets from the correlator model (see Reid & Brunthaler reid (2004) and Brunthaler et al. brunthaler (2005) for a detailed discussion).
The data were correlated at the VLBA correlator in Socorro, NM. The phase-referencing data were correlated with 1024 spectral channels, corresponding to a channel spacing of 0.193 km s-1. The geodetic block data, containing the observations of the ICRF quasars, were correlated with 16 spectral channels.
| Epoch | Date | J1825-0737 | Beam | Image rms |
|---|---|---|---|---|
| Flux density | HPBW; P.A. | per channel | ||
| (mJy) | (mas2); (°) | (mJy beam-1) | ||
| 1 | 2005 Nov 28 | 166 | 3.71.2; 13 | 10 |
| 2 | 2006 Jun 10 | 204 | 2.31.1; 5 | 7 |
| 3 | 2006 Sep 21 | 208 | 2.21.6; 3 | 7 |
| 4 | 2006 Dec 14 | 219 | 2.50.9; 12 | 7 |
| 5 | 2007 Mar 21 | 278 | 2.21.3; 1 | 7 |
| 6 | 2007 Jun 19 | 275 | 2.31.1; 6 | 7 |
2.2 Calibration and imaging
Most of the calibration and data reduction were carried out with standard procedures for spectra–line observations using the Astronomical Image Processing System (AIPS). First, we applied the latest values of the Earth’s orientation parameters and corrected for effects of the changing antenna parallactic angles. We removed atmospheric zenith delay errors using the geodetic–like observations of the quasars. Then we calibrated the visibility amplitudes using measured antenna gains and system temperatures and corrected for voltage offset in the samplers. Next, we corrected for electronic delay and phase differences among the IF bands using data from J18240199 and applied the phase–referencing technique using J18250737. Finally the interferometer spectra for G23.65700.127 were shifted to keep the LSR velocity of 83 km s-1 centered in the band. Because, in this paper, we are concentrating on the astrometry, we do not consider here the results of self–calibration of the maser. A detailed disscussion of nature of the 12.2 GHz emission towards G23.65700.127 will be presented in a forthcoming paper.
| Spot | VLSR | RA | Dec | Parallax | Proper motion | |
| (km s-1) | (mas) | (mas) | (mas) | (mas yr-1) | (mas yr-1) | |
| 1 | 86.837 | 38.090 | 16.134 | 0.2990.071 | 1.200.10 | 2.900.16 |
| 2 | 86.452 | 36.343 | 13.110 | 0.3300.100 | 1.280.13 | 2.870.21 |
| 3 | 86.260 | 36.149 | 12.916 | 0.3060.095 | 1.260.12 | 2.990.16 |
| 4 | 84.335 | 152.281 | 2.371 | 0.3320.070 | 1.450.09 | 3.120.12 |
| 5 | 84.143 | 152.105 | 2.719 | 0.2730.057 | 1.370.07 | 3.070.10 |
| 6 | 84.143 | 71.635 | 30.214 | 0.2690.058 | 1.250.07 | 2.990.12 |
| 7 | 83.950 | 17.850 | 20.833 | 0.3360.054 | 1.350.06 | 3.070.09 |
| 8 | 83.950 | 71.029 | 30.442 | 0.2450.052 | 1.430.07 | 3.020.11 |
| 9 | 83.373 | 65.264 | 31.895 | 0.3730.070 | 1.190.10 | 3.000.16 |
| 10 | 83.180 | 65.064 | 32.004 | 0.3110.070 | 1.320.08 | 3.030.13 |
| 11 | 82.988 | 19.591 | 5.390 | 0.2900.064 | 1.370.08 | 2.810.11 |
| 12 | 82.603 | 14.350 | 14.133 | 0.2770.099 | 1.330.13 | 3.150.17 |
| 13 | 82.603 | 18.516 | 1.136 | 0.3630.085 | 1.300.11 | 2.750.15 |
| 14 | 81.833 | 20.069 | 18.417 | 0.3010.056 | 1.270.07 | 2.870.11 |
| 15 | 80.486 | 15.676 | 171.016 | 0.4060.096 | 1.430.11 | 2.870.19 |
| 16 | 80.294 | 16.118 | 171.487 | 0.3550.099 | 1.350.13 | 2.960.18 |
| 17 | 80.101 | 16.429 | 171.892 | 0.3110.074 | 1.350.10 | 2.910.14 |
| 18 | 79.909 | 16.871 | 172.332 | 0.2490.065 | 1.260.08 | 2.850.12 |
| 19 | 79.716 | 17.326 | 172.979 | 0.3040.053 | 1.380.07 | 2.920.11 |
| Averaging fits | 0.3120.010 | 1.320.02 | 2.960.03 | |||
| Combined fit | 0.3130.015 | |||||
| Averaging data | 0.3130.039 | |||||
We imaged an area of 0.40.4 arcsec2 with four maps, each covering (0.20.2 arcsec2). Each map contained 10241024 pixels of size 0.2 mas and natural weighting was applied during mapping. We searched for emission over the range from 72 to 92 km s-1. The resulting beam sizes and rms noise levels (1) in line–free channels for each session are summarized in Table 1.
The positions of all maser spots (above the level of 5 on the individual channel maps) were determined by fitting elliptical Gaussian models (AIPS task JMFIT). The formal errors of the fitting were typically 0.01–0.1 mas in right ascension and 0.02–0.15 mas in declination, depending on maser strength and structure.
3 Results
3.1 12.2 GHz emission
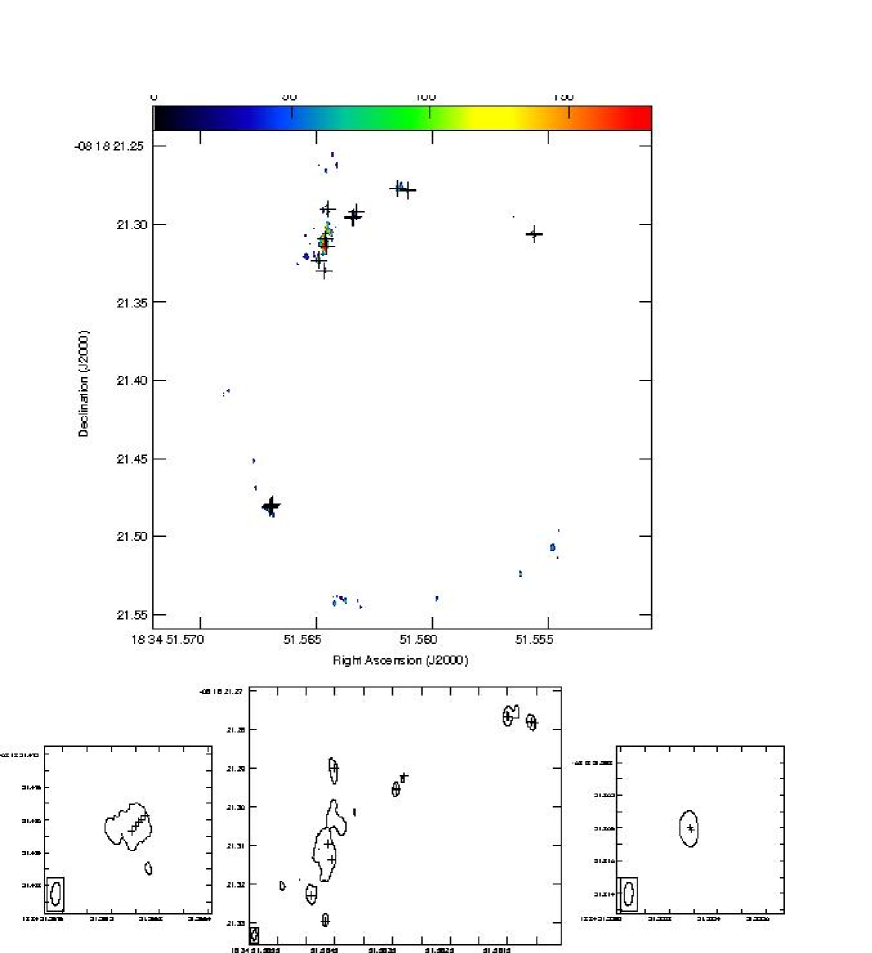
In epoch 1, methanol maser emission at 12.2 GHz towards G23.65700.127 was detected in a range from 77.41 to 86.84 km s-1, which is similar to the range over which 6.7 GHz methanol maser emission was seen (77.0–87.8 km s-1, Bartkiewicz et al. bartkiewicz (2005)). In total we measured 34 maser spots in the individual channel maps. The strongest spot (648 mJy beam-1) appeared at km s-1. The distribution of 12.2 GHz emission closely follows the ring seen in the 6.7 GHz line. Indeed, all 12.2 GHz spots have 6.7 GHz counterparts but the reverse is not the case.
During the next five observations emission was seen in the same velocity range, but more spots were detected above the 5 limit on the individual channel maps. There were 68, 86, 79, 68 and 85 spots at epoch 2, epoch 3, epoch 4, epoch 5 and epoch 6, respectively. The brightest spot showed a constant LSR velocity (82.60 km s-1) but variable peak brightnesses of 619, 691, 647, 817 and 911 mJy beam-1 at epochs 2 through 6. As for epoch 1, all 12.2 GHz maser spots at all five epochs had 6.7 GHz counterparts. The circularly symmetric morphology of maser emission was clearly seen in all five epochs. In Fig. 1 we present total intensity map of 12.2 GHz emission from the epoch 6 data.
3.2 Parallax measurements
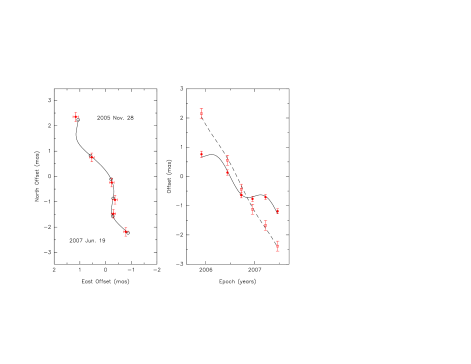
In order to determine the source parallax, we searched for spots which were detected in all six epochs, i.e., coinciding in velocity and position relative to the other maser spots. We found 19 such spots and modeled their change in position over the six epochs as due to the effects of annual parallax and proper motions (see the example in Fig. 2). Since relative position measurements are usually dominated by systematic errors, owing to uncompensated atmospheric delays, formal position errors are unrealistically small leading to rather large per degree of freedom values () for the fit. In order to account for systematic position errors and obtain reasonable formal fitting uncertainties, we added “error floors” of 80 and 160 as in right ascension and declination, respectively, in quadrature to the formal fitting errors. This resulted in per degree of freedom values of for both the right ascension and declination data.
In Table 2 we list all 19 spots used in the fitting and summarize the results of the parallax and proper motion fitting individually for each sequence of spots: the mean parallax is 0.312 mas, with a standard error of the mean of 0.010 mas (standard deviation of 0.042 mas). A combined fit for all spots with a single parallax, but individual proper motions and position offsets for each spot (since all the maser spots are at the same distance within the measurement accuracy), gives a similar result of =0.3130.015 mas.
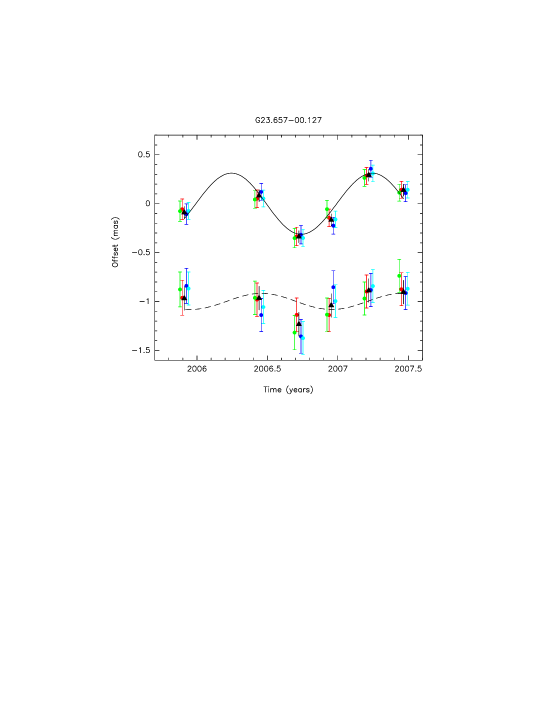
In Fig. 3 the combined fit for the parallax with data from four representative spots (spots 1–4 from Table 2) is presented. The positions of the masers after removing the proper motion and position offset are shown for clarity. Combining the results of several maser spots can lead to underestimated parallax uncertainty, since the position measurements relative to a background source may not be independent. Random errors (e.g., from the position fits due to the finite signal to noise ratios and possible maser spot structure) are probably not correlated among different maser spots. However, systematic errors (e.g., caused by residual atmospheric delay errors) will affect all maser spots in one epoch in a very similar way. Thus, the formal error in the combined fit will underestimate the true error.
The most conservative approach in the uncertainty estimation would be to assume that the errors are 100% correlated and multiply the formal error with , where is the number of maser spots. This would give a parallax uncertainty of mas. To estimate the effect of the systematic errors on our parallax measurement, we have calculated the average position of all maser spots in each epoch after removing their fitted proper motions and position offsets. The average positions are shown as open triangles in Fig. 3. Such averaging should reduce the random error, but leave the systematic error unchanged. A parallax fit to the averaged data points yielded a value of 0.3130.039 mas, which we adopt for the parallax of G23.65700.127. This corresponds to a distance to G23.65700.127 of 3.19 kpc.
The average proper motion of all spots and the standard error of the mean is 1.320.02 mas yr-1 in right ascension and 2.960.03 mas yr-1 in declination. For the measured distance of 3.19 kpc, these values correspond to: km s-1 and km s-1 in right ascension and declination, respectively. All spots have very similar proper motions (within 0.2 mas yr-1 of the average) (Table 2). Hence, internal motions are small, as is commonly found for 12.2 GHz methanol masers (Moscadelli et al. moscadelli02 (2002)) and, thus, the average proper motion closely represents the motion of the young star that excites the masers.
4 Discussion
Using our measured parallax and proper motion of the source G23.65700.127, we can estimate its 3-dimensional motion in the Galaxy. Assuming IAU recommended values for the distance of the Sun from the Galactic center of R0=8.50.5 kpc and the circular rotation speed of the LSR of =22010 km s-1, the Hipparcos Solar Motion values (Dehnen & Binney dehnen (1998)), our distance measurement of 3.190.40 kpc and proper motion of 1.320.02 mas yr-1 in right ascension and 2.960.03 mas yr-1 in declination, an LSR velocity of 832 km s-1, we obtain a Galactocentric motion of:
Here, U’ denotes the radial velocity component toward the Galactic Center, V’ is the velocity in direction of Galactic rotation, and W’ is the velocity toward the North Galactic Pole. Hence, G23.65700.127 is moving with nearly the same rotation speed as the LSR and slowly out of the plane of the Galaxy. However, it has a very large peculiar motion towards the Galactic center. This large peculiar motion explains why the source is closer than the near kinematic distance of kpc.
If we use a different rotation model of the Milky Way with R0=8.00.5 kpc and =2361 km s-1 which is consistent with the measured proper motion of the Galactic center Sgr A* (Reid & Brunthaler reid (2004)), we get:
Here, we find again a similar rotation speed as the LSR and a large motion toward the Galactic center, demonstrating that this result is not sensitive to the Galactic rotation model.
With a Galactocentric distance of 5.7 kpc (assuming R0=8.50.5 kpc), G23.65700.127 is located close to the Galactic bar (Benjamin et al. benjamin (2005)). Hence, the large peculiar motion might be caused by the gravitational potential of the central bar. Alternatively, the large peculiar motion could be caused by an interaction between a density wave of a spiral arm with the molecular could. More sources in this region are needed to investigate this possibility in more detail.
With our new measurement of the distance, we are able to verify our earlier calculations of the linear size of the 6.7 GHz ring as well as the bolometric luminosity using the mid- and far–infrared emission (Bartkiewicz et al. bartkiewicz (2005)). Assuming the mean radius of 127 mas the linear size is 405 AU. Applying the formula of Walsh et al. (walsh (1997); their Eq. (3)), we get a bolometric luminosity of L☉, which could be provided by a single B0.5 ZAMS type star (Panagia panagia (1973)).
5 Conclusions
Using VLBA observations of the 12.2 GHz methanol masers in G23.65700.127, we have determined an accurate distance of 3.19 kpc to the maser ring. At this distance, the radius of the ring corresponds to a linear size of 405 AU. We have also measured the proper motion of the source, which we use to determine its 3-dimensional motion in the Galaxy. The source moves with a similar rotation speed as the LSR, but shows a high peculiar motion of 30–40 km s-1 toward the Galactic center. This large peculiar motion might be induced by interactions with the Galactic bar and is responsible for the large error in the kinematic distance.
Acknowledgements.
A. Bartkiewicz and M. Szymczak acknowledge support from the Polish MNiI grant 1P03D02729. A. Brunthaler was supported by the DFG Priority Programme 1177.References
- (1) Bartkiewicz, A., Szymczak, M., & van Langevelde, H.J. 2005, A&A, 442, L61
- (2) Benjamin, R.A., Churchwell, E., Babler, B.L., et al. 2005, ApJ, 630, L149
- (3) Brunthaler, A., Reid, M.J., & Falcke, H. 2005, ASP Conference Series, 340, 455
- (4) Dehnen, W., & Binney, J.J. 1998, MNRAS, 298, 387
- (5) Dodson, R., Ojha, R., & Ellingsen, S.P. 2004, MNRAS, 351, 779
- (6) Fomalont, E., Petrov, L., McMillan, D.S., Gordon, D., & Ma, C. 2003, AJ, 126, 2562
- (7) Ma, C., Arias, E.F., Eubanks, T.M., et al. 1998, AJ, 116, 516
- (8) Menten, K.M. 1991, ApJ, 380, L75
- (9) Moscadelli, L., Menten, K.M., Walmsley, C.M., & Reid, M.J. 1999, AJ, 519, 244
- (10) Moscadelli, L., Menten, K.M., Walmsley, C.M., & Reid, M.J. 2002, ApJ, 564, 813
- (11) Minier, V., Booth, R.S., & Conway, J.E. 2000, A&A, 362, 1093
- (12) Norris, R.P., Byleveld, S.E., Diamond, P.J., et al. 1998, ApJ, 508, 275
- (13) Panagia, N. 1973, AJ, 78, 929
- (14) Petrov, L., Kovalev, Y.Y., Fomalont, E., & Gordon, D. 2005, AJ, 129, 1163
- (15) Phillips, C.J., Norris, R.P., Ellingsen, S.P., & McCulloch, P. M. 1998, MNRAS, 300, 1131
- (16) Reid, M.J., & Brunthaler, A. 2004, ApJ, 616, 872
- (17) Szymczak, M., Kus, A.J., Hrynek, G., Kepa, A., & Pazderski, E. 2002, A&A, 392, 277
- (18) Walsh, A.J., Hyland, A.R., Robinson, G., & Burton, M.G. 1997, MNRAS, 291, 261
- (19) Walsh, A.J., Burton, M.G., Hyland, A.R., & Robinson, G. 1998, MNRAS, 301, 640
- (20) Xu, Y., Reid, M.J., Menten, K.M., & Zheng, X.W. 2006, ApJSS, 166, 526