Multiwavelength observations of 3C 454.3.
I. The AGILE 2007 November campaign on the “Crazy Diamond”
Abstract
We report on a multiwavelength observation of the blazar 3C 454.3 (which we dubbed crazy diamond) carried out on November 2007 by means of the astrophysical satellites AGILE, INTEGRAL, Swift, the WEBT Consortium, and the optical-NIR telescope REM. Thanks to the wide field of view (FoV) of the AGILE satellite and its prompt alert dissemination to other observatories, we obtained a long (three weeks), almost continuous -ray coverage of the blazar 3C 454.3 across fourteen decades of energy. This broad-band monitoring allows us to study in great detail light curves, correlations, time-lags and spectral energy distributions (SEDs) during different physical states. Gamma-ray data were collected during an AGILE pointing towards the Cygnus Region. Target of Opportunity (ToO) observations were performed to follow-up the -ray observations in the soft and hard X-ray energy bands. Optical data were acquired continuously by means of a pre-planned WEBT campaign and through a REM ToO repointing. 3C 454.3 is detected at a level during the 3-week observing period, with an average flux above 100 MeV of photons cm-2 s-1. The -ray spectrum can be fit with a single power-law with photon index between 100 MeV and 1 GeV. We detect significant day-by-day variability of the -ray emission during our observations, and we can exclude that the fluxes are constant at the 99.6% () level. The source was detected typically around 40 degrees off-axis, and it was substantially off–axis in the field of view of the AGILE hard X-ray imager. However, a 5-day long ToO observation by INTEGRAL detected 3C 454.3 at an average flux of about photons cm-2 s-1with an average photon index of between 20–200 keV. Swift also detected 3C 454.3 with a flux in the 0.3–10 keV energy band in the range photons cm-2 s-1 and a photon index in the range . In the optical band, both WEBT and REM show an extremely variable behavior in the band. A correlation analysis based on the entire data set is consistent with no time-lags between the -ray and the optical flux variations. Our simultaneous multifrequency observations strongly indicate that the dominant emission mechanism between 30 MeV and 30 GeV is dominated by inverse Compton scattering of relativistic electrons in the jet on the external photons from the broad line region.
1 Introduction
Among active galactic nuclei (AGNs), blazars show intense and variable -ray emission above 100 MeV (Hartman et al., 1999). Variability timescale can be as short as few days, or last few weeks. They emit across several decades of energy, from the radio to the TeV energy band. Blazar spectral energy distributions (SEDs) are typically double humped with a first peak occurring in the IR/Optical band in the so-called red blazars (including Flat Spectrum Radio Quasars, FSRQs, and Low-energy peaked BL Lacs, LBLs) and at UV/X-rays in the so-called blue blazars (including High-energy peaked BL Lacs, HBLs) and it is commonly interpreted as synchrotron radiation from high-energy electrons in a relativistic jet. The second SED component, which peaks at MeV–GeV energies in red blazars and at TeV energies in blue blazars, is commonly interpreted as Inverse Compton (IC) scattering of soft seed photons by relativistic electrons. A recent review of the blazar emission mechanisms and energetics is given in Celotti & Ghisellini (2008). Alternatively, the blazar SED can be explained in the framework of the hadronic models, where the relativitic protons in the jet are the primary accelerated particles, emitting -ray radiation by means of photo-pair and photo-pion production (see Mücke & Protheroe 2001; Mücke et al. 2003 for a recent review on hadronic models).
Multiwavelength studies of variable -ray blazars have been carried out since the beginning of the 1990s, thanks to the CGRO Observatory. Nevertheless, only a few objects were detected on a timescale of about two weeks in the -ray energy band, and simultaneously monitored at different energies, obtaining a multifrequency coverage. Among the FSRQs detected at energies above 100 MeV by the EGRET telescope on-board the Compton Gamma-Ray Observatory (Hartman et al., 1999), 3C 454.3 (PKS 2251158; ) is certainly one of the most active at high energy. In the EGRET era, it was detected in 1992 during an intense -ray flaring episode (Hartman et al., 1992, 1993) when its flux was observed to vary within the range photons cm-2 s-1. In 1995, a 2-week campaign detected a -ray flux of its historical maximum (Aller et al., 1997).
In 2005, 3C 454.3 underwent a major flaring activity in almost all energy bands (see Giommi et al. 2006). In the optical, it reached mag (Villata et al., 2006) and it was detected by INTEGRAL at a flux111Assuming a Crab-like spectrum. level of photons cm-2 s-1 in the 3–200 keV energy band (Pian et al., 2006). Since the detection of the exceptional 2005 outburst, several monitoring campaigns were carried out to follow the source multifrequency behavior (Villata et al., 2006, 2007; Raiteri et al., 2007, 2008a, 2008b). During the last of these campaigns, 3C 454.3 underwent a new optical brightening in mid July 2007, which triggered observations at all frequencies.
In July 2007, Vercellone et al. (2008, hereafter V08) reported the highest -ray flare from 3C 454.3. During the period 2007 July 24–30 the average -ray flux was photons cm-2 s-1, about a factor of two higher than in 1995. No emission was detected by Super-AGILE in the energy range 20–60 keV, with a 3- upper limit of photons cm-2 s-1.
By means of AGILE preliminary flux estimate (Vercellone et al., 2007), Ghisellini et al. (2007) compared the 3C 454.3 SEDs obtained during three multiwavelength campaigns (2000, 2005 and 2007). The 2007 data show that the -ray high state occurred during a weaker optical/X-ray flux compared with the 2005 flare.
In this paper (Paper I) we present the results of a multiwavelength campaign on 3C 454.3 during a long-lasting -ray activity period between 2007 November 10 and December 1. Preliminary -ray results were distributed in Chen et al. (2007), while radio-to-optical and UV data were published in Raiteri et al. (2008a). A companion paper (Paper II, Donnarumma et al., in preparation) will describe the AGILE multiwavelength campaign during December 2007. In Sect. 2 we present the multiwavelength campaign on 3C 454.3; in Sect. 3 through 6 we present the AGILE/GRID, INTEGRAL/IBIS, Swift/XRT, WEBT and REM data analysis, respectively; in Sec. 7 we present the simultaneous multiwavelength light-curves and SEDs. In Sect. 8 and 9 we discuss our results and draw our conclusions. Throughout this paper the quoted uncertainties are given at the 1– level, unless otherwise stated.
2 The Multiwavelength Campaign
In 2007 November AGILE began pointing 3C 454.3 at high off-axis angle (about ). Nevertheless, in a few days 3C 454.3 was detected at more than 5- (Chen et al., 2007), exhibiting variable activity on a day time-scale (Pucella et al., 2007). Immediately after the source detection, a multiwavelength campaign started. AGILE data were collected during two different periods, the first ranging between 2007-11-10 12:17 UT and 2007-11-25 10:57 UT and the second between 2007-11-28 12:05 UT and 2007-12-01 11:39 UT, for a total of about 592 ks. The three-day gap between them was due to a pre-planned GRID calibration activity. INTEGRAL data were collected during a dedicated ToO on revolutions 623 (between 2007-11-20 03:35 UT and 2007-11-22 08:46 UT) and 624 (between 2007-11-22 20:45 UT and 2007-11-24 15:50 UT), for a total of about 300 ks, while Swift/XRT data were obtained during several ToO pointings for a total of about 10 ks. WEBT data (radio to optical) as well as Swift/UVOT data were published in Raiteri et al. (2008a), while REM data were acquired following a ToO request. In both cases, optical data were acquired continuously during the whole AGILE campaign.
3 AGILE data
3.1 Data Reduction and Analysis
The AGILE satellite (Tavani et al., 2008a, b), a mission of the Italian Space Agency (ASI) devoted to high-energy astrophysics, is currently the only space mission capable of observing cosmic sources simultaneously in the energy bands 18–60 keV and 30 MeV–50 GeV. The satellite was launched on 2007 April 23 by the Indian PSLV-C8 rocket from the Satish Dhawan Space Center SHAR, Sriharikota.
The AGILE scientific Instrument is very compact and combines four active detectors yielding broad-band coverage from hard X-rays to gamma-rays: a Silicon Tracker (ST; Prest et al., 2003, 30 MeV–50 GeV), a co-aligned coded-mask hard X-ray imager (SA; Feroci et al., 2007, 18–60 keV), a non-imaging CsI Mini–Calorimeter (MCAL; Labanti et al., 2006, 0.3–100 MeV), and a segmented Anti-Coincidence System (ACS; Perotti et al., 2006). Gamma-ray detection is obtained by the combination of ST, MCAL and ACS; these three detectors form the AGILE Gamma-Ray Imaging Detector (GRID).
Level–1 AGILE-GRID data were analyzed using the AGILE Standard Analysis Pipeline (see V08 for a detailed discussion of the AGILE data reduction). Since 3C 454.3 was at high off-axis angle, an ad-hoc -ray analysis was performed. We used -ray events filtered by means of the FT3ab2 AGILE Filter pipeline. Counts, exposure, and Galactic background -ray maps are created with a bin-size of , for MeV. Since the source was at off-axis, all the maps were generated including all events collected up to off-axis. We rejected all the -ray events whose reconstructed directions form angles with the satellite-Earth vector smaller than (albrad=80), reducing the -ray Earth albedo contamination by excluding regions within from the Earth limb. The most recent versions (BUILD-15) of the Calibration files, which will be publicly available at the ASI Science Data Centre (ASDC222http://agile.asdc.asi.it) site, and of the -ray diffuse emission model (Giuliani et al., 2004) were used. The first step consists in running the AGILE Source Location task in order to derive the most plausible location of the source. In a second step, we ran the AGILE Maximum Likelihood Analysis (ALIKE) using a radius of analysis of 10∘ , and the best guess position derived in the first step. The particular choice of the radius of analysis parameter is dictated to avoid any possible contamination by very off-axis residual particle events.
3.2 Results
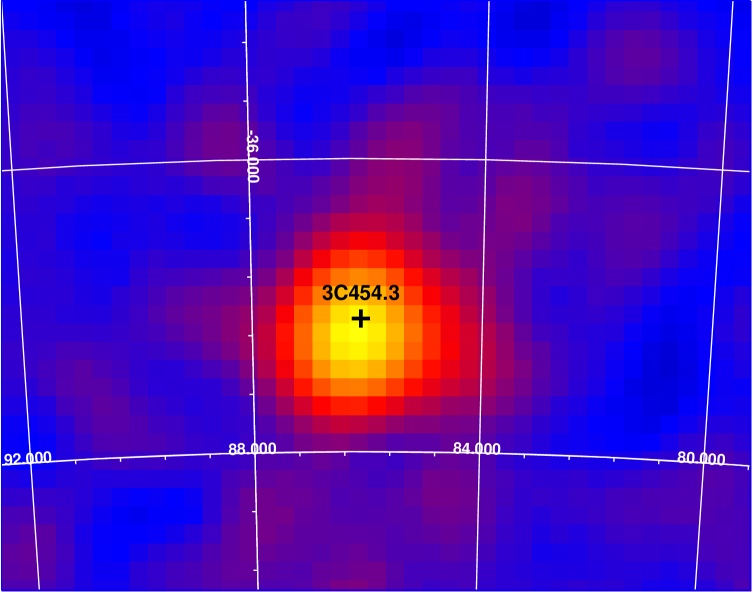
Figure 1 shows a Gaussian-smoothed intensity map () in Galactic coordinates integrated over the whole observing period, using the selections described in §3.1. The source detection significance is 19- and the average -ray flux above 100 MeV for the whole period is photons cm-2 s-1, as derived from the AGILE Maximum Likelihood Code analysis. We note that the average -ray flux computed over the three week campaign is lower than photons cm-2 s-1 , observed during the flaring episode in July 2007, and computed during only a six day observation. Nevertheless, Figure 2 shows that the current average flux is still higher than those observed during the EGRET era. The smaller errors on the AGILE November data with respect to the July data are due to both the higher statistics (323 versus 101 counts collected in November and in July, respectively), and to the more accurate calibration response files.
Figure 3 shows the -ray light-curve at 1-day resolution for photons above 100 MeV. We note that 3C 454.3 is detected at a 3- level during almost the whole period on a 1-day timescale; this clearly indicates strong -ray flaring activity.
The average -ray flux as well as the daily values of the 18 days were derived according to the -ray analysis procedure described in Mattox et al. (1993). First, the entire period was analyzed to determine the diffuse gas parameters and then the source flux density was estimated independently for each of the eighteen 1-day periods with the diffuse parameters fixed at the values obtained in the first step. Fitting the GRID fluxes to a constant model (the weighted mean of the 1-day average flux values) yields photons cm-2 s-1. Following McLaughlin et al. (1996), we computed the variability coefficient. The 2- upper limits (UL) were properly treated, assigning a value and a sigma equal to (Torres et al., 2001). We obtain a for 17 degrees of freedom (d.o.f.); therefore we can exclude that the fluxes are constant at the 99.6% () level, and we obtain a value for the variability coefficient of 2.43. A value of indicates that the source is variable within the observed period.
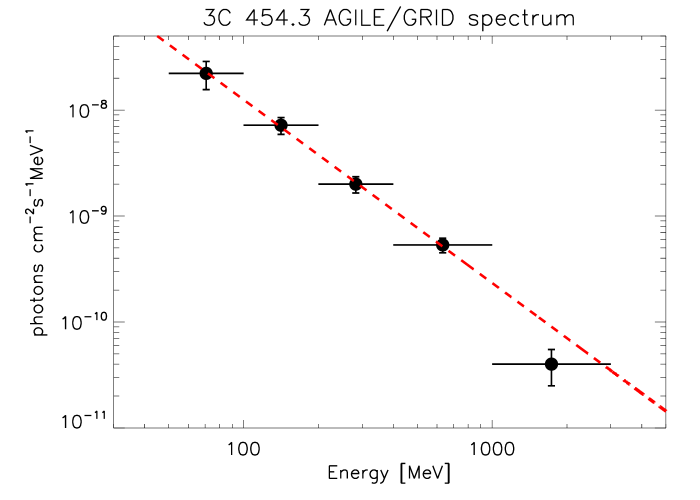
Figure 4 shows the average -ray spectrum derived over the entire observing period. The average spectrum was obtained by computing the -ray flux in five energy bins over the entire observing period: MeV, MeV, MeV, MeV, and MeV. We fit the data by means of a simple power-law model and restricted our fit to the most reliable energy range (100 MeV–1 GeV):
| (1) |
Unfortunately, the source was located substantially off-axis in the Super–AGILE FoV during the whole observation period, resulting in a not particularly constraining upper limit flux, being as high as photons cm-2 s-1 (50 mCrab).
4 INTEGRAL data
4.1 Data Reduction and Analysis
The ESA INTEGRAL -ray Observatory, launched in 2002 October, carries three co-aligned coded mask telescopes. For the purpose of this paper we refer to data from the IBIS instrument (Ubertini et al., 2003), sensitive in the energy range 15 keV–10 MeV and with a FoV of 29 , and in particular to the ISGRI lower energy detector layer.
All the observations are organized into un-interrupted 2000–3600 s long science windows (SCW): light curves and spectra were extracted for each individual SCW. Wide-band spectra (from 17 to 150 keV) of the source were obtained using data from IBIS instrument. All the data were processed using the Off-line Scientific Analysis (OSA) version 7.0 software released by the INTEGRAL Scientific Data Centre. INTEGRAL data were analyzed using FTOOLS and XSPEC11.3.2 in the Heasoft package (v.6.4). We assumed a single power law model to fit the IBIS data.
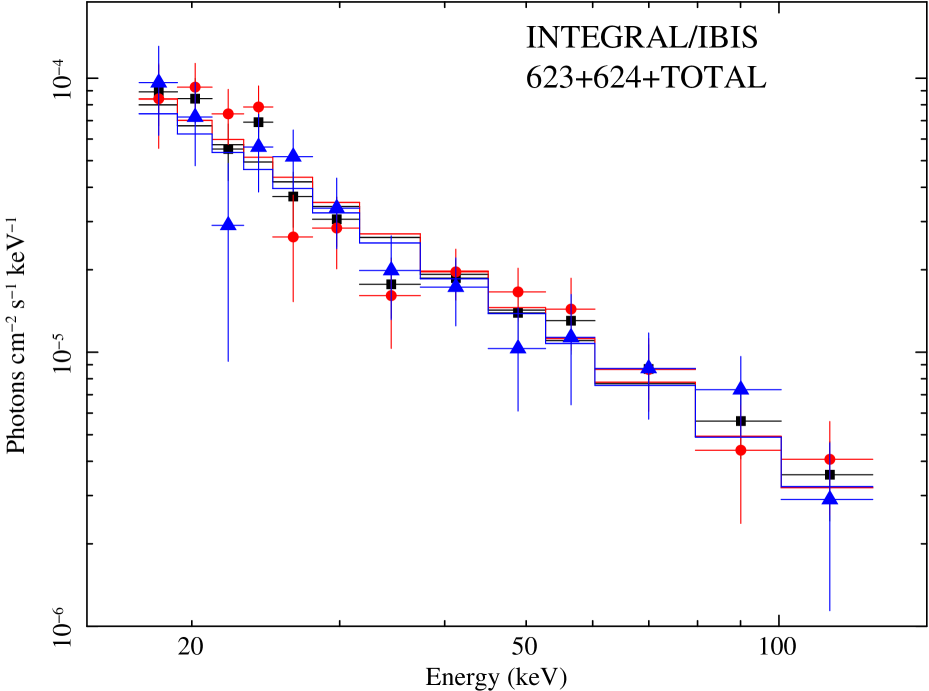
Figure 5 shows the INTEGRAL/IBIS light curve in the energy range 20–50 keV accumulated during the whole observation. The source does not show statistically significant flux variations. Figure 6 shows the INTEGRAL/IBIS spectra for revolution 623 (red circles), revolution 624 (blue triangles) and for the whole observation (black squares).
Table 1 summarizes the INTEGRAL/IBIS spectral fit results.
5 Swift data
5.1 Data Reduction and Analysis
The NASA Swift -ray Burst Mission (Gehrels et al., 2004), launched in November 2004, has three co-aligned instruments: a coded-mask Burst Alert Telescope (BAT; Barthelmy et al., 2005, 15–150 keV), an X-ray Telescope (XRT; Burrows et al., 2005, 0.2–10 keV), and an Ultraviolet/Optical Telescope (UVOT; Roming et al., 2005, 170–600 nm).
Swift data (Obs. ID 00031018) were collected by activating a Swift Cycle-3 Proposal (PI A. W. Chen) and by means of a dedicated ToO triggered by AGILE (PI S. Vercellone). The XRT data were processed with standard procedures (xrtpipeline v0.11.6), adopting the standard filtering and screening criteria, and using FTOOLS in the Heasoft package (v.6.4). The source count rate was low during the whole campaign, thus we only considered photon counting data (PC) and further selected XRT event grades 0–12 (Burrows et al., 2005). Swift/XRT data show an average count rate of counts s-1 and therefore pile-up correction was required. We extracted the source events from an annular source extraction region with an inner radius of 2–3 pixels (estimated case by case by means of the PSF fitting technique) and an outer radius of 30 pixels (1 pixel ). To account for the background, we also extracted events within a circular region centered on a region free from background sources and with radius of 80 pixels. Ancillary response files were generated with xrtmkarf, and account for different extraction regions, vignetting and PSF corrections. We used the spectral redistribution matrices v010 in the Calibration Database maintained by HEASARC. Swift/XRT uncertainties are given at 90% confidence level for one interesting parameter (i.e., ) unless otherwise stated.
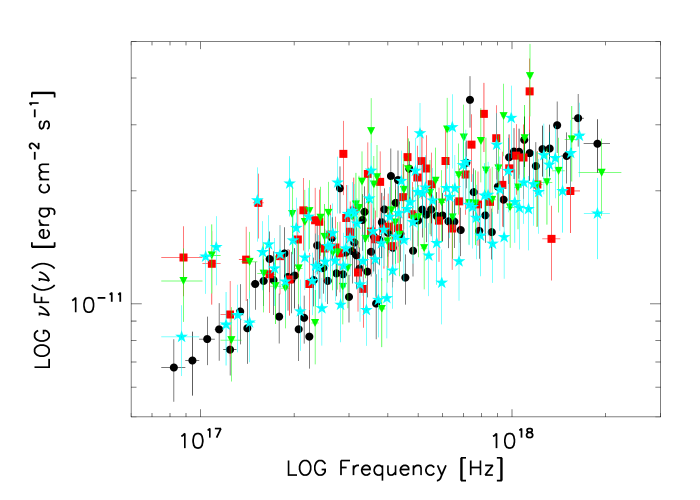
Figure 7 shows the 0.3–10 keV spectra for segment 001 to 006, where we summed segments 003 and 004 in order to have similar statistics as the others: black circles (segm. 001), red squares (segm. 003+004), green upside-down triangles (segm. 005), and cyan stars (segm. 006). Segment 002 was not considered since only 1 s of data were recorded. We first fit Swift/XRT spectra with an absorbed power law model, named model A (wabs*zwabs(powerlaw) in XSPEC 11.3.2). Data were rebinned in order to have at least 20 counts per energy bin. The Galactic absorption was fixed to the value of cm-2 (Kalberla et al., 2005). We considered, in addition to the Galactic absorption coefficient, an extra absorption component, , following the results showed in Ghisellini et al. (2007) and Raiteri et al. (2007). A second spectral fit (model B) was performed considering a simple power law with the absorption component as a free parameter (wabs*(powerlaw)). Table 2 summarizes the most relevant spectral fit parameters.
We note that the component in model A is not well constrained, while a simpler fit (model B) characterized by a single power law model with free absorption coefficient yields values which are consistent within the uncertainties among different observations. We also check the possible presence of a double power law as reported in Raiteri et al. (2008b) as follows. We fixed the to the value derived by Villata et al. (2006), cm-2 (based on Chandra data), and fixed the hard power law index to the one we obtained by fitting the XRT data above 2 keV. In most cases the harder power law component is not required, as its normalization is consistent with zero.
Figure 8 shows the Swift/XRT photon index versus the 0.3–10 keV flux. Numbers beneath each point represent the observing segment.
We analysed Swift/BAT Survey data in order to study the hard X-ray emission of 3C 454.3 and to investigate its evolution as a function of time. We selected two time windows, the first between 2005 April 01 and 2005 September 30 (when intense activity was recorded from the target, see e.g. Giommi et al. 2006), the second between 2007 June 01 and 2007 December 31. We considered all BAT observations with 3C 454.3 in the FoV. After a careful data selection, based on background rate, pointing stability and several other data quality criteria (see Senziani et al. 2007), we ended up with 4824 observations for a net exposure time of ks in 6 months in 2005 and ks in 7 months in 2007.
Here we provide a brief overview of the BAT Survey data analysis procedure, while a detailed description will be addressed in a forthcoming paper (Belfiore et al., in preparation). Starting from Detector Plane Histogram (DPH) files, Detector Plane Images (DPI) in the 20–60 keV and 60–100 keV energy ranges were generated and were cleaned from hot pixels and noisy detectors. Then, with the HEASOFT task batfftimage each DPI was deconvolved to obtain a background- and source-subtracted sky image of the BAT FoV. For each sky image an appropriate effective exposure map (weighted on the coded fraction) was generated, accounting for possible Earth/Moon occultations. Then, such sky images were re-projected and stacked (weighting on effective exposure) to obtain monthly count rate maps, considering a small portion of the field around the target (a region in local tangential projection coordinates, TAN).
The count rates of 3C 454.3 were normalized to the Crab count rates and then converted to flux (ph cm-2 s-1) assuming for the Crab the canonical power law spectrum (photon index and normalization of 10.4 ph cm-2 s-1 keV-1 at 1 keV) and for 3C 454.3 a power law spectrum with , averaging the instrument response over the field of view. The November 2007 net exposure time is ks for a flux in the 20-60 keV energy band of ph cm-2 s-1.
Figure 9 shows the long-term Swift/BAT light curves in the 20–60 keV (bottom panel) and 60–100 keV (upper panel) energy range. The yellow vertical area marks the AGILE November campaign. The Swift/BAT flux is in good agreement with the flux derived from the whole INTEGRAL/IBIS campaign in the same energy range, ph cm-2 s-1. The short-dashed line marks the epoch of the giant optical flare in 2005 (Fuhrmann et al., 2006; Villata et al., 2006), when the hard X-ray flux was about twice higher than in November 2007.
6 Optical data
6.1 WEBT Data Reduction and Analysis
The Whole Earth Blazar Telescope (WEBT) 333http://www.oato.inaf.it/blazar/webt, see e.g. Villata et al. (2004). has been monitoring 3C 454.3 since the exceptional 2004–2005 outburst (Villata et al., 2006, 2007; Raiteri et al., 2007, 2008a, 2008b), covering also the period of the AGILE observation. We refer to Raiteri et al. (2008a) for a detailed presentation and discussion of the radio, mm, near–IR, optical and Swift/UVOT data collected, almost continously, during November 2007.
6.2 REM Data Reduction and Analysis
The photometric Optical and Near Infrared (NIR) observations were carried out with the Rapid Eye Mount (REM, Zerbi et al., 2004), a robotic telescope located at the ESO Cerro La Silla observatory (Chile). The REM telescope has a Ritchey-Chretien configuration with a 60 cm f/2.2 primary and an overall f/8 focal ratio in a fast moving alt-azimuth mount providing two stable Nasmyth focal stations. At one of the two foci the telescope simultaneously feeds, by means of a dichroic, two cameras: REMIR for the NIR (Conconi et al., 2004), and ROSS (Tosti et al., 2004) for the optical. Both the cameras have a field of view of and imaging capabilities with the usual NIR (’, , and ) and Johnson-Cousins , , and filters. All raw optical/NIR frames obtained with REM Telescopes, were corrected for dark, bias and flat field. Instrumental magnitudes were obtained via aperture photometry using GAIA444http://star-www.dur.ac.uk/pdraper/gaia/gaia.html. Calibration of the optical source magnitude was obtained by differential photometry with respect to the comparison stars sequence reported by Fiorucci et al. (1998) and Raiteri et al. (1998). For the NIR calibration we used the comparison sequence reported by González-Pérez et al. (2001). Both REMIR and ROSS instruments were used in order to obtain nearly simultaneous data and to study the spectral behavior 3C 454.3 at different levels of flux.
7 Simultaneous data analysis
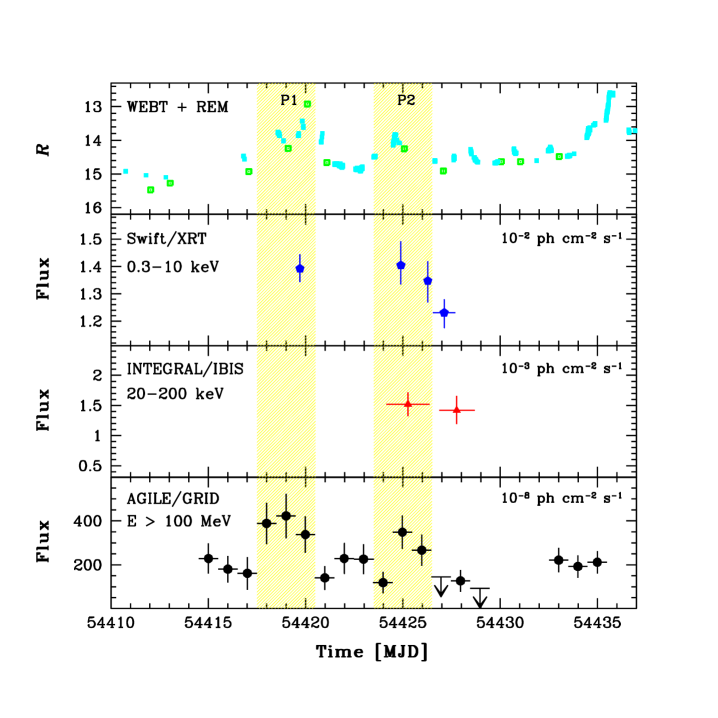
Figure 10 shows the simultaneous light curves acquired during the period 2007 November 6–December 3. Black circles represent AGILE/GRID data (30 MeV–50 GeV); red triangles represent INTEGRAL/IBIS data (20–200 keV); blue pentagons represent Swift/XRT data (0.3–10 keV); cyan–solid and green–open squares represent -band WEBT and REM (Raiteri et al., 2008a) data, respectively. The yellow areas mark the periods P1 and P2 during which we compute the simultaneous spectral energy distributions, and corresponding to higher -ray flux levels. We note that during the period P1 the optical flux shows intense variability, reaching a relative maximum on the last day of the -ray day-by-day sampling. Moreover, an optical flare as intense as the one on MJD54420 occurred at the end of the AGILE observations (MJD54435.5). The three -ray data points show no particular flaring activity, though the daily flux remained quite high, photons cm-2 s-1. A detailed discussion on the correlation between the optical and -ray data during December 2007 will be presented in the forthcoming Paper II (Donnarumma et al. 2008, in preparation).
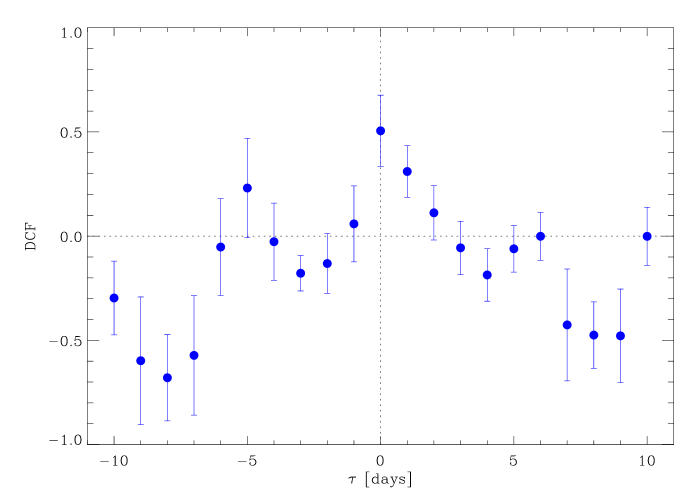
We investigated the expected -optical flux correlation by means of the discrete correlation function (DCF; see Edelson & Krolik, 1988; Hufnagel & Bregman, 1992; Peterson, 2001). The result is shown in Figure 11. The DCF peak occurred at , and its value is . This indicates a moderate correlation, with no significant time delay between the -ray and optical flux variations. A minor peak at days comes from establishing a connection between the optical flare at MJD 54420 and the high flux at MJD 54425.
Figure 12 shows the spectral energy distribution for the period P1, MJD 54417.5–54420.5 (see Figure 10). Filled squares represent the AGILE/GRID data in the energy range 100–1000 MeV; small filled circles represent Swift/XRT data in the energy range 0.3–10 keV (segment 001); open symbols represent radio to UV data taken from Raiteri et al. (2008a), corresponding to MJD 54420, when all the WEBT UBVRI bands were available, as well as Swift/UVOT data.
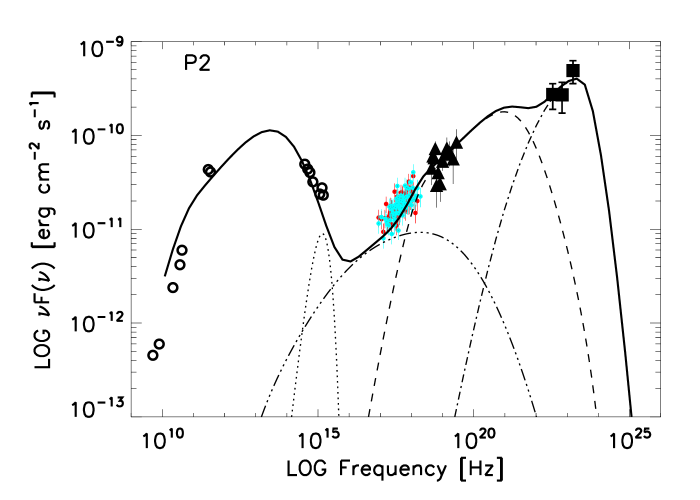
Figure 13 shows the spectral energy distribution for the period P2, MJD 54423.5–54426.5 (see Figure 10). Filled squares represent the AGILE/GRID data in the energy range 100–1000 MeV; filled triangles represent INTEGRAL/IBIS data in the energy range 17–150 keV (orbits 623624); small filled circles represent Swift/XRT data in the energy range 0.3–10 keV (segments 003, 004, and 005); open symbols represent radio to UV data taken from Raiteri et al. (2008a), corresponding to MJD 54425.
A brief discussion of the modeling of both SEDs is presented in the Section 8.
8 Discussion
The long–term -ray activity of 3C 454.3 is one of most interesting discoveries achieved by AGILE during its first 6 months of observations. The source was already detected in high state in July 2007 during a 1-week AGILE ToO triggered by an intense optical flare detected by the WEBT. During that period, the source reached its highest intensity level, with an average -ray flux of photons cm-2 s-1. In November 2007, 3C 454.3 showed prominent and prolonged -ray activity, with flaring episodes on a timescale of a few days and an average -ray flux of photons cm-2 s-1. This renewed activity triggered observations at different frequencies, allowing us to obtain an almost simultaneous SED coverage on 14 decades in energies. We dubbed 3C 454.3 as crazy diamond because of its dramatic variability at high energies revealed during the first half of the AGILE Observing Cycle–1. It has become clear that this source is playing the same role for AGILE as 3C 279 had for EGRET. The 3C 454.3 strong variability has also a clear signature at lower frequencies. As reported in Raiteri et al. (2008a), during the AGILE observation, on MJD 54425 the source showed an extremely variable behavior in the band, with a brightening of 0.33 mag in 2.3 hours. In the same paper, the authors report other episodes of fast variability with flux variations of several tenths of mag in a few hours. Moreover, while in July 2007 3C 454.3 exhibited its most intense optical flare but with a very moderate degree of -ray flux variability on a day-by-day time–scale, during the November 2007 campaign (see Figure 3), we note a significant -ray flux variability on short time–scales with at least two distinct flaring episodes (P1 and P2). It is interesting to note that in the optical band 3C 454.3 also seems to display more rapid flares during the fall–winter 2007 WEBT campaign than those that occurred during the July 2007 monitoring (Raiteri et al. 2008b).
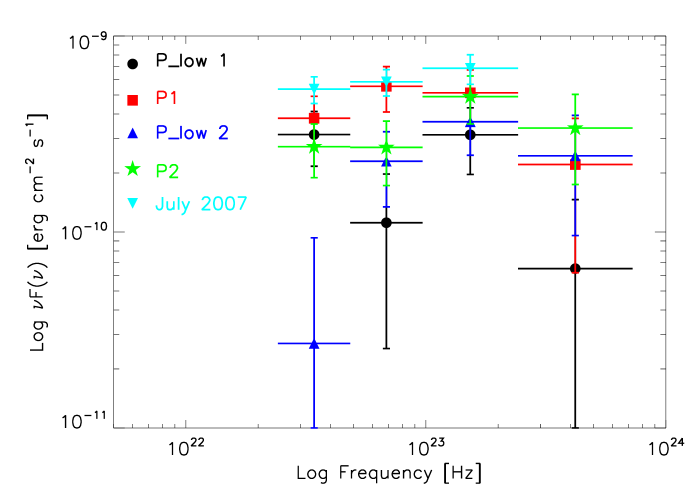
We compared the spectral properties of higher-state periods, P1 and P2, with two lower-state periods, Plow1 and Plow2, chosen of the same duration as P1 and P2 and corresponding to MJD 54414.5–54417.7 and MJD 54420.5–54423.5, respectively. Figure 14 shows the AGILE/GRID spectra for periods P1 (red square), P2 (green star), P1low1 (black circle), P2low2 (blue upside triangle). The July 2007 spectrum is also shown (cyan upside down triangle). Although the statistics accumulated in only 4 days does not allow us to obtain a robust fit of the data, Figure 14 shows no clear spectral differences among different source intensity levels.
The correlation between the flux level and the spectral slope was extensively studied by means of the analysis of the EGRET data. Recently, Nandikotkur et al. (2007) have shown that there is no homogeneous behavior among EGRET blazars. Although they consider long–term spectral dependence on flux rather than short–term as in our case, our findings are in agreement with their results on 3C 454.3. Figure 3 in Nandikotkur et al. (2007) shows no spectral variation despite a flux variation of about a factor of four.
Different emission mechanisms can be invoked to explain the -ray emission and the different spectral states. In the leptonic scenario, the low–frequency peak is interpreted as synchrotron radiation from high–energy electrons in the relativistic jet, while the high–energy peak can be produced by IC on different flavors of seed photons. In the synchrotron self–Compton [SSC] model (Ghisellini et al. 1985, Bloom & Marscher 1996) the seed photons come from the jet itself. Alternatively, the seed photons can be those of the accretion disk [external Compton scattering of direct disk radiation, ECD, Dermer et al. (1992)] or those of the broad–line region (BLR) clouds [external Compton scattering from clouds, ECC, Sikora et al. (1994)]. The target seed photons can also be those produced by the infrared (IR) dust torus surrounding the nucleus [external Compton scattering from IR dust, ERC(IR), Sikora et al. (2002)].
Błażejowski et al. 2000 showed that the ERC(IR) emission peak is at lower frequencies (soft -ray ), more suitable for MeV blazars, while our SEDs show a peak for the EC component in the GeV region of the spectrum. The average photon index during this November 2007 campaign () is harder than the time–averaged one reported in Nandikotkur et al. (2007) () for EGRET. During intense -ray flares, the ECC and ECD processes play a major role and the softness or the hardness of the resulting spectrum is controlled by the dominant component, as illustrated in Hartman et al. (2001) for 3C 279. In the case of 3C 454.3, the ECC component seems to play a major role, as we will show from the SED modeling.
We fit the SEDs for the P1 and P2 gamma-ray flaring episodes by means of a one-zone leptonic model, considering the contributions from SSC and from external seed photons originating both from the accretion disk and from the BLR. The emission along the jet is assumed to be produced in a spherical blob with comoving radius by accelerated electrons characterized by a comoving broken power law energy density distribution of the form,
| (2) |
where is the electron Lorentz factor assumed to vary between , and are the pre– and post–break electron distribution spectral indices, respectively, and is the break energy Lorentz factor. We assume that the blob contains a random average magnetic field and that it moves with a bulk Lorentz Factor at an angle with respect to the line of sight. The relativistic Doppler factor is then , where is the usual blob bulk speed in units of the speed of light.
Our modelling of the 3C 454.3 high-energy emission is based on an Inverse Compton model with two main sources of external target photons: (1) an accretion disk characterized by a blackbody spectrum peaking in the UV with a bolometric luminosity for a IC-scattering blob at a distance from the central part of the disk; (2) a Broad Line Region with a spectrum peaking in the band and assumed to reprocess of the irradiating continuum (Tavecchio & Ghisellini 2008; Raiteri et al. 2007, 2008b).
These two regions contribute to the ECD and the ECC, respectively, and it is interesting to test the relative importance of the two components that can be emitted by the relativistic jet of 3C 454.3 under different conditions. A complete theoretical analysis of the model, and of the interplay among the different parameters is beyond the scope of this paper and it will be presented in a forthcoming paper. We summarize here the main results of our best model characterized by an interesting set of physical parameters.
Table 3 shows the best-fit parameters of our modelling of the flaring state SEDs corresponding to the P1 and P2 phase of Figure 10. Our best fit parameters values are: G, , , and pc where is the distance between the accretion disk and the emitting region. In both Figures 12 and 13, the dotted, dashed, and dot–dashed lines represent the contributions of the accretion disk blackbody, the external Compton on the disk radiation and the external Compton on the broad line region radiation, respectively.
We note that during both the P1 and P2 episodes, the ECD contribution can account for the soft and hard X-ray portion of the spectrum, which show a moderate, if any, time variability. However, we note that the ECD component alone cannot account for the hardness of the -ray spectrum. We therefore argue that in the AGILE energy band a dominant contribution from ECC seems to provide a better fit of the data during the gamma-ray flaring states P1 and P2. Moreover, Table 3 shows that the data of both SEDs can be fit by very similar model parameters. We note, however, that the high energy part of the electron energy distribution appears to be softer during the P2 episode as compared to the electron distribution of the P1 flare. Hartman et al. (2001) find, for 3C 279, a relevant contribution of the SSC component in the X-rays - soft -ray bands. However, their average values for and are much higher (a factor of 5–10) than ours, resulting in an increase of the ratio . Thus, for the Hartman et al. choice of parameters, the SSC contribution becomes relevant at higher frequencies and of the same order of the ECD contribution.
Our results can be compared with those obtained by Jorstad et al. (2005). By means of total and polarized images obtained at the Very Long Baseline Array (VLBA) at 7mm, they were able to compute the global parameters of the source jet, estimating , , , and , where and are the average Lorentz and Doppler factors, respectively, while and are the intrinsic half opening angle of the jet and the angle between the jet axis and the line of sight, respectively. We note, however, that the jet parameters derived so far were obtained by means of data collected in earlier epochs with respect to our observations and refer to average values of different jet components.
The energetics of 3C 454.3 can be computed by estimating the isotropic luminosity in the -ray band, , and comparing it with the Eddington, the bolometric, and the particle injection luminosities. For a given source with redshift , the isotropic emitted luminosity in the energy band is defined as
| (3) |
where, in our case, is the -ray energy band with MeV and GeV, is the -ray energy spectral index, is the energy differential flux, is the flux in the -ray band, and the luminosity distance is given by
| (4) |
where , and
| (5) |
where is the Hubble constant, and are the contribution of the matter and of the cosmological constant, respectively, to the density parameter. Hereafter, we assume km s-1Mpc-1, , and . Using the observed average -ray flux, we obtain erg s-1.
Moreover, from the values quoted in Table 3 and from Equation 2 we can compute the particle injection luminosity, , obtaining :
| (6) |
Assuming for 3C 454.3 a black hole mass M⊙ (Gu et al., 2001) , we obtain an Eddington luminosity of the order of erg s-1 to be compared with the bolometric luminosity erg s-1 reported in Woo & Urry (2002).
We obtain, therefore, that the source energetic is comparable to the value obtained by Tavecchio et al. (2007) for the power of the inner portion of jet, few erg s-1.
9 Conclusions
The AGILE mission is particularly suited to monitor a large number of potential -ray sources. The AGILE pointings during the month of November 2007, despite being centered approximately in the Cygnus region of the Galactic plane, revealed the very prominent -ray activity of the blazar 3C 454.3. The AGILE detection of this blazar prompted a series of important multiwavelength observations. The electromagnetic emission of 3C 454.3 could be determined with unprecedented coverage over 14 orders of magnitude in energy during a period that included a substantial fraction of the months of November and December, 2007. Results of the AGILE data and related multifrequency campaign carried out in December, 2007, will be presented in a forthcoming paper.
We reported in this paper the main results of our AGILE and associated multifrequency campaigns during the month of November, 2007. Our results can be summarized as follows:
-
1.
The -ray emission from 3C 454.3 dominated the whole extragalactic sky as monitored by AGILE during its first year of scientific operations.
-
2.
Our -ray data show remarkable variability on a daily timescale for a Flat Spectrum Radio Quasar.
-
3.
Emission in the optical range appears to be correlated with that at -ray energies above 100 MeV.
-
4.
Variability in the soft and hard X-ray range is less sensitive to the short-timescale variations of the optical flux.
-
5.
The average -ray spectrum during the whole campaign is substantially harder than that reported in previous observations.
-
6.
We determined the SEDs for episodes of relatively high -ray emission.
-
7.
Our results support the idea that the dominant emission mechanism in -ray energy band is the inverse Compton scattering of external photons from the BLR clouds scattering off the relativistic electrons in the jet.
References
- Aller et al. (1997) Aller, M. F. et al. 1997, in American Institute of Physics Conference Series, Vol. 410, Proceedings of the Fourth Compton Symposium, ed. C. D. Dermer, M. S. Strickman, & J. D. Kurfess, 1423
- Barthelmy et al. (2005) Barthelmy, S. D. et al. 2005, Space Science Reviews, 120, 143
- Błażejowski et al. (2000) Błażejowski, M., Sikora, M., Moderski, R., & Madejski, G. M. 2000, ApJ, 545, 107
- Bloom & Marscher (1996) Bloom, S. D., & Marscher, A. P. 1996, ApJ, 461, 657
- Burrows et al. (2005) Burrows, D. N. et al. 2005, Space Science Reviews, 120, 165
- Celotti & Ghisellini (2008) Celotti, A., & Ghisellini, G. 2008, MNRAS, 385, 283
- Chen et al. (2007) Chen, A. et al. 2007, The Astronomer’s Telegram, 1278, 1
- Conconi et al. (2004) Conconi, P. et al. 2004, in Presented at the Society of Photo-Optical Instrumentation Engineers (SPIE) Conference, Vol. 5492, Ground-based Instrumentation for Astronomy. Edited by Alan F. M. Moorwood and Iye Masanori. Proceedings of the SPIE, Volume 5492, pp. 1602-1612 (2004)., ed. A. F. M. Moorwood & M. Iye, 1602–1612
- Dermer et al. (1992) Dermer, C. D., Schlickeiser, R., & Mastichiadis, A. 1992, A&A, 256, L27
- Edelson & Krolik (1988) Edelson, R. A., & Krolik, J. H. 1988, ApJ, 333, 646
- Feroci et al. (2007) Feroci, M. et al. 2007, Nuclear Instruments and Methods in Physics Research A, 581, 728
- Fiorucci et al. (1998) Fiorucci, M., Tosti, G., & Rizzi, N. 1998, PASP, 110, 105
- Fuhrmann et al. (2006) Fuhrmann, L. et al. 2006, A&A, 445, L1
- Gehrels et al. (2004) Gehrels, N. et al. 2004, ApJ, 611, 1005
- Ghisellini et al. (2007) Ghisellini, G., Foschini, L., Tavecchio, F., & Pian, E. 2007, MNRAS, 382, L82
- Ghisellini et al. (1985) Ghisellini, G., Maraschi, L., & Treves, A. 1985, A&A, 146, 204
- Giommi et al. (2006) Giommi, P. et al. 2006, A&A, 456, 911
- Giuliani et al. (2004) Giuliani, A., Chen, A., Mereghetti, S., Pellizzoni, A., Tavani, M., & Vercellone, S. 2004, Mem. SAIt Suppl., 5, 135
- González-Pérez et al. (2001) González-Pérez, J. N., Kidger, M. R., & Martín-Luis, F. 2001, AJ, 122, 2055
- Gu et al. (2001) Gu, M., Cao, X., & Jiang, D. R. 2001, MNRAS, 327, 1111
- Hartman et al. (1999) Hartman, R. C. et al. 1999, ApJS, 123, 79
- Hartman et al. (1993) —. 1993, ApJ, 407, L41
- Hartman et al. (1992) —. 1992, IAU Circ., 5477, 2
- Hartman et al. (2001) —. 2001, ApJ, 553, 683
- Hufnagel & Bregman (1992) Hufnagel, B. R., & Bregman, J. N. 1992, ApJ, 386, 473
- Jorstad et al. (2005) Jorstad, S. G. et al. 2005, AJ, 130, 1418
- Kalberla et al. (2005) Kalberla, P. M. W., Burton, W. B., Hartmann, D., Arnal, E. M., Bajaja, E., Morras, R., & Pöppel, W. G. L. 2005, A&A, 440, 775
- Labanti et al. (2006) Labanti, C. et al. 2006, in Proc. SPIE, 6266, 62663Q
- Mattox et al. (1993) Mattox, J. R. et al. 1993, ApJ, 410, 609
- McLaughlin et al. (1996) McLaughlin, M. A., Mattox, J. R., Cordes, J. M., & Thompson, D. J. 1996, ApJ, 473, 763
- Mücke & Protheroe (2001) Mücke, A., & Protheroe, R. J. 2001, Astroparticle Physics, 15, 121
- Mücke et al. (2003) Mücke, A., Protheroe, R. J., Engel, R., Rachen, J. P., & Stanev, T. 2003, Astroparticle Physics, 18, 593
- Nandikotkur et al. (2007) Nandikotkur, G., Jahoda, K. M., Hartman, R. C., Mukherjee, R., Sreekumar, P., Böttcher, M., Sambruna, R. M., & Swank, J. H. 2007, ApJ, 657, 706
- Perotti et al. (2006) Perotti, F., Fiorini, M., Incorvaia, S., Mattaini, E., & Sant’Ambrogio, E. 2006, Nuclear Instruments and Methods in Physics Research A, 556, 228
- Peterson (2001) Peterson, B. M. 2001, in Advanced Lectures on the Starburst-AGN Connection, ed. I. Aretxaga, D. Kunth, & R. Mújica (Singapore: World Scientific), 3
- Pian et al. (2006) Pian, E. et al. 2006, A&A, 449, L21
- Prest et al. (2003) Prest, M., Barbiellini, G., Bordignon, G., Fedel, G., Liello, F., Longo, F., Pontoni, C., & Vallazza, E. 2003, Nuclear Instruments and Methods in Physics Research A, 501, 280
- Pucella et al. (2007) Pucella, G. et al. 2007, The Astronomer’s Telegram, 1300, 1
- Raiteri et al. (2008a) Raiteri, C. M. et al. 2008a, A&A, 485, L17
- Raiteri et al. (1998) Raiteri, C. M., Villata, M., Lanteri, L., Cavallone, M., & Sobrito, G. 1998, A&AS, 130, 495
- Raiteri et al. (2008b) Raiteri, C. M., Villata, M., Larionov, V. M., Chen, W. P., Kurtanidze, O. M., Gurwell, & et al. 2008b, A&A, submitted
- Raiteri et al. (2007) Raiteri, C. M. et al. 2007, A&A, 473, 819
- Roming et al. (2005) Roming, P. W. A. et al. 2005, Space Science Reviews, 120, 95
- Senziani et al. (2007) Senziani, F., Novara, G., de Luca, A., Caraveo, P. A., Belloni, T., & Bignami, G. F. 2007, A&A, 476, 1297
- Sikora et al. (1994) Sikora, M., Begelman, M. C., & Rees, M. J. 1994, ApJ, 421, 153
- Sikora et al. (2002) Sikora, M., Błażejowski, M., Moderski, R., & Madejski, G. M. 2002, ApJ, 577, 78
- Tavani et al. (2008a) Tavani, M. et al. 2008a, Nuclear Instruments and Methods in Physics Research A, 588, 52
- Tavani et al. (2008b) —. 2008b, A&A, submitted (arXiv:astro-ph/0807.4254v1)
- Tavecchio & Ghisellini (2008) Tavecchio, F., & Ghisellini, G. 2008, MNRAS, 386, 945
- Tavecchio et al. (2007) Tavecchio, F., Maraschi, L., Wolter, A., Cheung, C. C., Sambruna, R. M., & Urry, C. M. 2007, ApJ, 662, 900
- Torres et al. (2001) Torres, D. F., Romero, G. E., Combi, J. A., Benaglia, P., Andernach, H., & Punsly, B. 2001, A&A, 370, 468
- Tosti et al. (2004) Tosti, G. et al. 2004, in Presented at the Society of Photo-Optical Instrumentation Engineers (SPIE) Conference, Vol. 5492, Ground-based Instrumentation for Astronomy. Edited by Alan F. M. Moorwood and Iye Masanori. Proceedings of the SPIE, Volume 5492, pp. 689-700 (2004)., ed. A. F. M. Moorwood & M. Iye, 689–700
- Ubertini et al. (2003) Ubertini, P. et al. 2003, A&A, 411, L131
- Vercellone et al. (2007) Vercellone, S. et al. 2007, The Astronomer’s Telegram, 1160, 1
- Vercellone et al. (2008) —. 2008, ApJ, 676, L13
- Villata et al. (2004) Villata, M. et al. 2004, A&A, 424, 497
- Villata et al. (2007) —. 2007, A&A, 464, L5
- Villata et al. (2006) —. 2006, A&A, 453, 817
- Woo & Urry (2002) Woo, J.-H., & Urry, C. M. 2002, ApJ, 579, 530
- Zerbi et al. (2004) Zerbi, F. M. et al. 2004, in Presented at the Society of Photo-Optical Instrumentation Engineers (SPIE) Conference, Vol. 5492, Ground-based Instrumentation for Astronomy. Edited by Alan F. M. Moorwood and Iye Masanori. Proceedings of the SPIE, Volume 5492, pp. 1590-1601 (2004)., ed. A. F. M. Moorwood & M. Iye, 1590–1601
| Rev. | (d.o.f.) | Flux aafootnotemark: | |
|---|---|---|---|
| 623 | 1.21 (11) | ||
| 624 | 0.54 (11) | ||
| 623624 | 0.89 (11) |
| Obs.aafootnotemark: | (d.o.f.) | (obs.) | (obs.) | ||
|---|---|---|---|---|---|
| (1022 cm2) | photons cm-2 s-1 | photons cm-2 s-1 | |||
| Model A: single power law with Galacticintrinsic absorption | |||||
| 001 | + | ||||
| 003004 | + | ||||
| 005 | + | ||||
| 006 | + | ||||
| Model B: single power law with free absorption | |||||
| 001 | |||||
| 003004 | |||||
| 005 | |||||
| 006 | |||||
| Parameter | SED P1 | SED P2 | Units |
|---|---|---|---|
| 2.1 | 2.2 | ||
| 4.5 | 5.0 | ||
| 10 | 10 | ||
| 500 | 500 | ||
| 14 | 12 | cm-3 | |
| 35 | 35 | 1015 cm | |
| 10 | 8 | G | |
| 14.64 | 14.64 | ||
| 5 | 5 | 1046 erg s-1 | |
| 0.05 | 0.05 | pc | |
| 2.6 | 2.6 | degrees | |
| 8.4 | 8.4 |