Photoluminescence dispersion as a probe of structural inhomogeneity in silica
Abstract
We report time-resolved photoluminescence spectra of point defects in amorphous silicon dioxide (silica), in particular the decay kinetics of the emission signals of extrinsic Oxygen Deficient Centres of the second type from singlet and directly-excited triplet states are measured and used as a probe of structural inhomogeneity. Luminescence activity in sapphire (-Al2O3) is studied as well and used as a model system to compare the optical properties of defects in silica with those of defects embedded in a crystalline matrix. Only for defects in silica, we observe a variation of the decay lifetimes with emission energy and a time dependence of the first moment of the emission bands. These features are analyzed within a theoretical model with explicit hypothesis about the effect introduced by the disorder of vitreous systems. Separate estimations of the homogenous and inhomogeneous contributions to the measured emission linewidth are obtained: it is found that inhomogeneous effects strongly condition both the triplet and singlet luminescence activities of oxygen deficient centres in silica, although the degree of inhomogeneity of the triplet emission turns out to be lower than that of the singlet emission. Inhomogeneous effects appear to be negligible in sapphire.
1 Introduction
Point defects in amorphous silicon dioxide (SiO2) represent a fundamental technological issue due to the wide range of applications of this material in current optical and electronic technologies. Indeed, the formation of defects, typically triggered by exposure to ultraviolet (UV) or ionizing radiation, compromises the performance of SiO2 in optical components, optical fibres, and Metal Oxide Semiconductor transistors [1, 2]. On the other side, comparing the properties of color centres hosted by an amorphous and a crystal matrix is an issue of considerable interest for basic solid state physics, still leaving several unanswered questions especially concerning the interplay between homogeneous and inhomogeneous optical broadening effects [3]. In a crystal each member of an ensemble of identical defects experiences the same local environment and its spectroscopical properties are properties of the single centre. Hence, the optical properties of the set of defects, such as the homogeneous absorption or emission linewidth, determined by the electron-phonon coupling [1, 2], must be considered as homogeneous properties of the defects. The situation is different in a glass where, beside the homogeneous features of the single point defect, different centres are localized in different environments, possibly featuring a continuous spectrum of geometric configurations. This statistical distribution of structural parameters can result in a further broadening of optical bands (inhomogeneous effect). Thus, in an amorphous solid the observed spectroscopic fingerprint of a set of nominally identical point defects, i.e. belonging to the same species, is due to the convolution of both homogeneous and inhomogeneous effects. No general recipe is available to discriminate the extent of the former with respect to the latter and, as a consequence, the prominence of inhomogeneous or homogeneous effects in determining the optical properties of defects in glasses has been a debated question for a long time [1, 2, 4] .
In previous papers, we reported optical measurements on a particular kind of point defect in silica, the so-named Oxygen Deficient Centre of the second type, shortly ODC(II), performed at several temperatures both by time-resolved and stationary luminescence techniques. These studies suggested that the spectroscopic properties of ODCs are significantly conditioned by inhomogeneous effects [5, 6, 7, 8]. Also, ODC(II) have been observed only in the amorphous phase of SiO2, so being an interesting model system to investigate glassy-specific inhomogeneous effects. The ODC(II) exists as an intrinsic defect or in two extrinsic varieties, and its mostly accepted structural model consists in a twofold coordinated atom (=X∙∙)[9, 10, 11], where X can be either a Si, a Ge or a Sn atom, belonging to the same isoelectronic group. In particular, the Ge-ODC(II) defects are responsible of an intense optical activity in Vis-UV range which is currently associated to the variation of refraction index in the fibre Bragg gratings after UV writing [2].
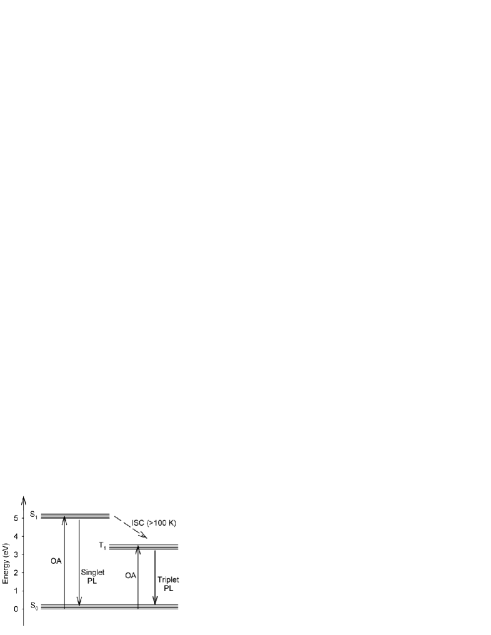
In figure 1 are schematically shown the main optical absorption (OA) and photoluminescence (PL) transition for Ge-ODC(II). A broad nearly-gaussian OA band centred at 5.1 eV, assigned to the transition between the ground electronic singlet state (S0) and the first excited singlet (S1) one, excites a fast (lifetime in the ns range) PL band centred at 4.3 eV, due to the inverse S1S0 transition [11, 12]. Due to partial admixture of S1 and the first excited triplet state (T1), at T100 K, it is possible also to populate the T1 state from S1 by a phonon assisted process named inter-system crossing (ISC). The subsequent radiative decay from T1 towards S0 gives rise to an additional PL emission centred at 3.1 eV. The lifetime of this band is slow (in the range of s) due to the forbidden spin selection rules for this T1S0 transition [12, 13]. It is also possible to populate the T1 state directly from the ground state by exciting with photons of 3.7 eV energy. This process has a very low absorption cross section and bypasses the ISC channel giving rise to the same 3.1 eV phosphorescence band independently from the temperature of the system and with the same lifetime of the SSTS0 process [12].
In a recent paper [14] we introduced a new experimental investigation approach, based on time-resolved luminescence measurements, which was able to yield an estimation of the homogeneous and inhomogeneous linewidth of the fast (ns lifetime) ODC(II) luminescence band due to decay from the state. In this paper we generalize our analysis applying it to the same model defect, i.e. the ODC(II) in silica, measuring also the ”slow” band assigned to the de-excitation from the state. This phosphorescence band is excited directly populating the first triplet electronic state to avoid possible inhomogeneous effects arising from ISC process [6, 15]. Our aim is to find out whether our approach is applicable also to a slow (s lifetime) triplet emission band and if the extent of inhomogeneous effects affecting triplet and singlet emission processes are comparable or not. Finally, in order to compare the results with those obtained in a system where inhomogeneous effects should be absent, we report the same study performed on the PL of point defects in crystalline sapphire. Although the luminescence activity of defects in irradiated or doped sapphire was extensively studied in the past, several aspects about the decay kinetics, defects interconversion processes, band attributions and structural models of the emitting defects are not clear yet [16, 17, 18].
2 Experimental Section
We report measurements performed on a fused silica sample
(commercial name: Infrasil 301, mm sized and
provided by Heraeus Quartzglas [19]). This sample, hereafter named
I301, is manufactured by fusion and quenching of natural quartz, with
typical concentration of impurities 20 ppm in weight. In
particular, as-grown I301 features a 1 ppm concentration of Ge
impurities, due to contamination of the quartz from which the
material was produced. Previous studies demonstrated that a consistent portion of
the Ge impurities are arranged as Ge-ODC(II) defects in the as-grown
material [12, 20]. For comparison with defects
in a crystal we used also an as-grown commercial sapphire sample
(-Al2O3) provided by A.D. Mackay INC (Broadway, New
York) and rod flame polished [21].
Photoluminescence measurements were done in a standard back-scattering geometry, under excitation by a pulsed laser (Vibrant OPOTEK: pulsewidth of 5 ns, repetition rate of 10 Hz) tunable in the UV-Visible range. The luminescence emitted by the samples was dispersed by a spectrograph (SpectraPro 2300i, PI Acton, 300 mm focal length) equipped by three different gratings, and detected by an air-cooled intensified CCD (Charge-Coupled Device PIMAX, PI Acton). The detection system can be electronically gated so as to acquire the emitted signal only in a given temporal window defined by its width () and by its delay from the laser pulse.
The luminescence from the triplet excited state of Ge-ODC(II) in the I301 sample was collected under laser excitation (energy density per pulse of 1.000.02 mJ/cm2) at 330 nm (3.75 eV), corresponding to the S0T1 absorption peak, and using a 300 grooves/mm grating (blaze at 500 nm) with a 4 nm spectral bandwidth. The PL decay was followed by performing different acquisitions with the same integration time =15 s but at different delays , going from 0 to 300 s from the laser pulse.
Analogous measurements on the luminescence arising from the singlet excited state of Ge-ODC(II) was collected under laser excitation (energy density per pulse of 0.300.02 mJ/cm2) at 240 nm (5.17 eV), corresponding to the S0S1 absorption peak, and using the same 300 grooves/mm grating (blaze at 500 nm) with a 3 nm spectral bandwidth. In this
case different spectra were acquired with =1 ns and going from 0 to 60 ns.
The luminescence of the sapphire sample was acquired using
a 230 nm (5.40 eV) excitation wavelength (energy density per pulse of 1.000.02 mJ/cm2), and a 150 grooves/mm
grating (blaze at 300 nm) with a 8 nm spectral bandwidth. The decay was followed varying from 0 to 400 s and with =4 s.
All the spectra were corrected for spectrograph dispersion and for instrumental response. All measurements reported here were performed on samples kept at 25 K in high vacuum ( mbar) within a helium continuous flow cryostat (Optistat CF-V, OXFORD Instruments).
3 Results
We show in figure 2-(a) the time-resolved spectra of the triplet (T1S0) PL activity of Ge-ODC(II) in the I301 silica sample.
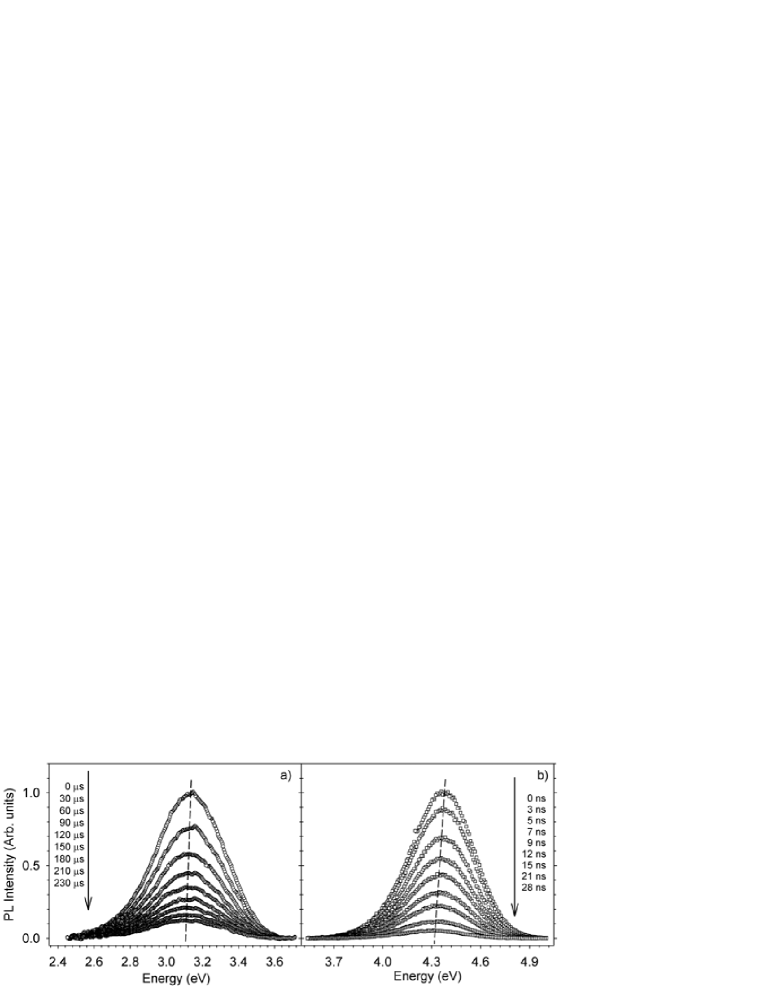
In figure 2-(b) analogous measurements performed on the singlet (S1S0) PL emission of the same defects are shown. The dashed lines drawn in figure 2 follow the emission peaks at different time delay and we observe a non-verticality of their slopes, indicating an experimental detectable red shift of both luminescence bands during the decay.
In figures 3-(a) and 4-(a) we report the signal acquired at t=0 for the two PL activities of the Ge-ODC(II), corresponding to the most intense spectra in figures 2-(a) and 2-(b), respectively. The triplet PL band of Ge-ODC(II), as acquired immediately after the end of the laser pulse, is peaked at 3.1 eV and features a 0.44 eV width (Full Width at Half Maximum, FWHM), while the singlet band features a 4.4 eV peak position and a 0.45 eV FWHM.
Analogous time-resolved measurements were carried out on the PL activity in the sapphire sample with purposes of comparison, and we report in figure 5-(a) the spectrum acquired for =0: the PL band observed in sapphire, as acquired immediately after the end of the laser pulse, is peaked at 2.9 eV and features a 0.61 eV FWHM. The spectroscopic parameters of the signal in figure 5-(a) are consistent with a luminescence signal previously observed in literature, and associated either to the so-called P-centre (an anion-cation vacancy pair featuring a charge transfer transition) as proposed by a few works [22, 23], or to an extrinsic defect as proposed in [24]. However, it is worth noting that the detailed structural model of the centre responsible for the observed luminescence is not relevant here. Indeed, to the purposes of the present work we are going to discuss this signal only as a model of a slow luminescence of a defect in a crystalline oxide and, as we will see, it presents a s lifetime.
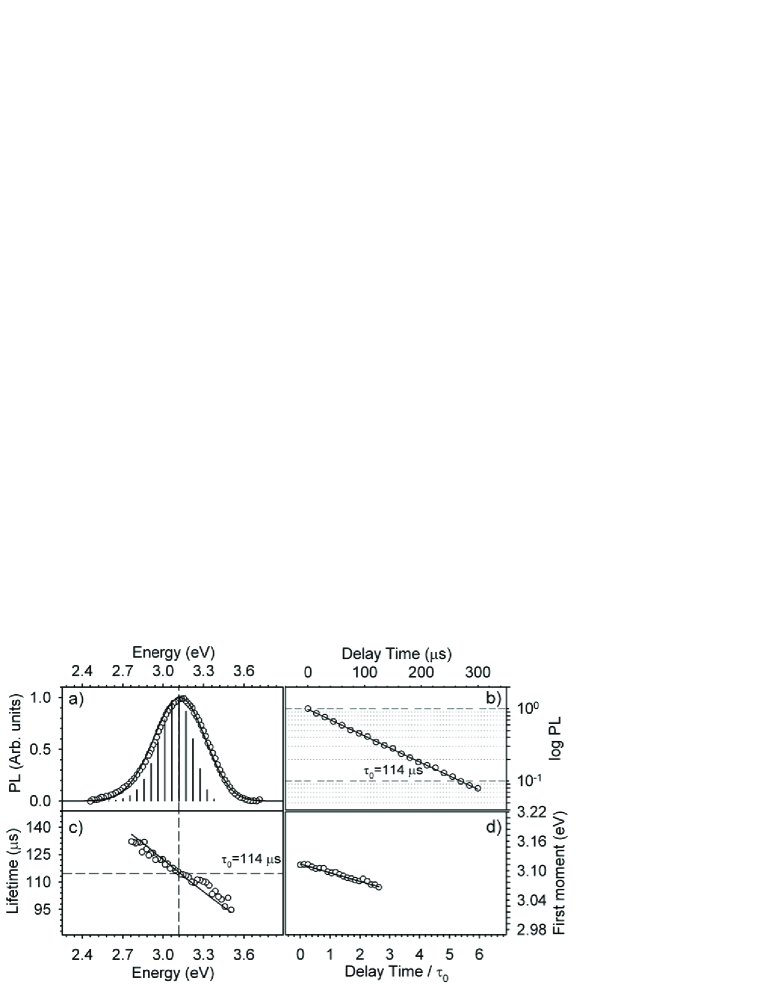
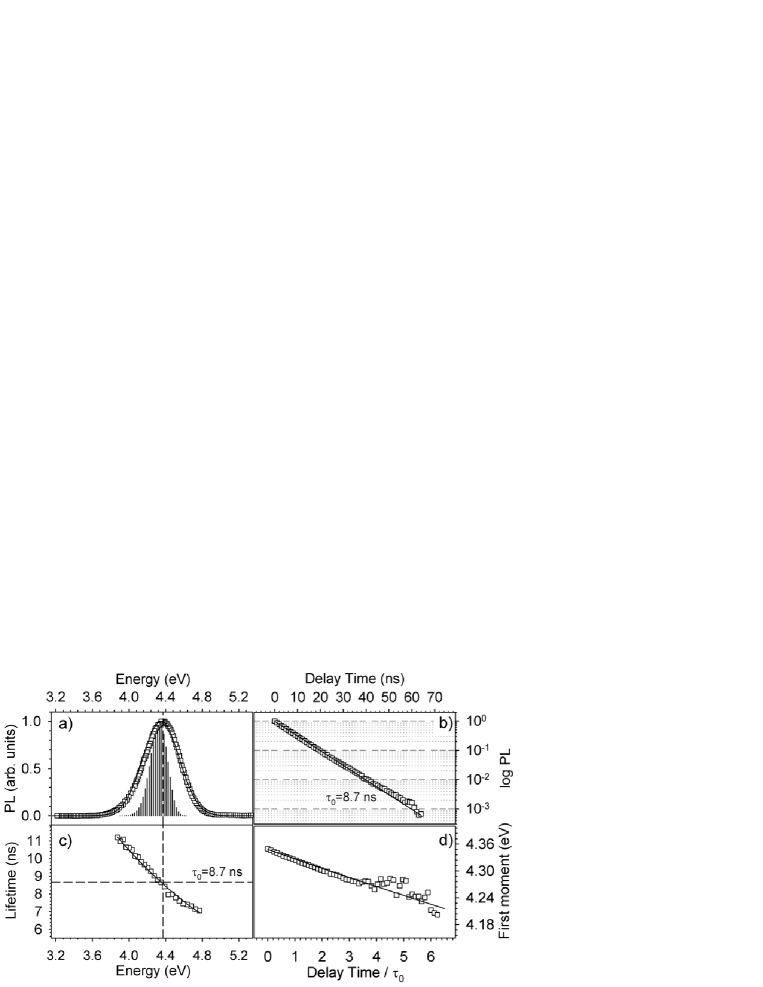
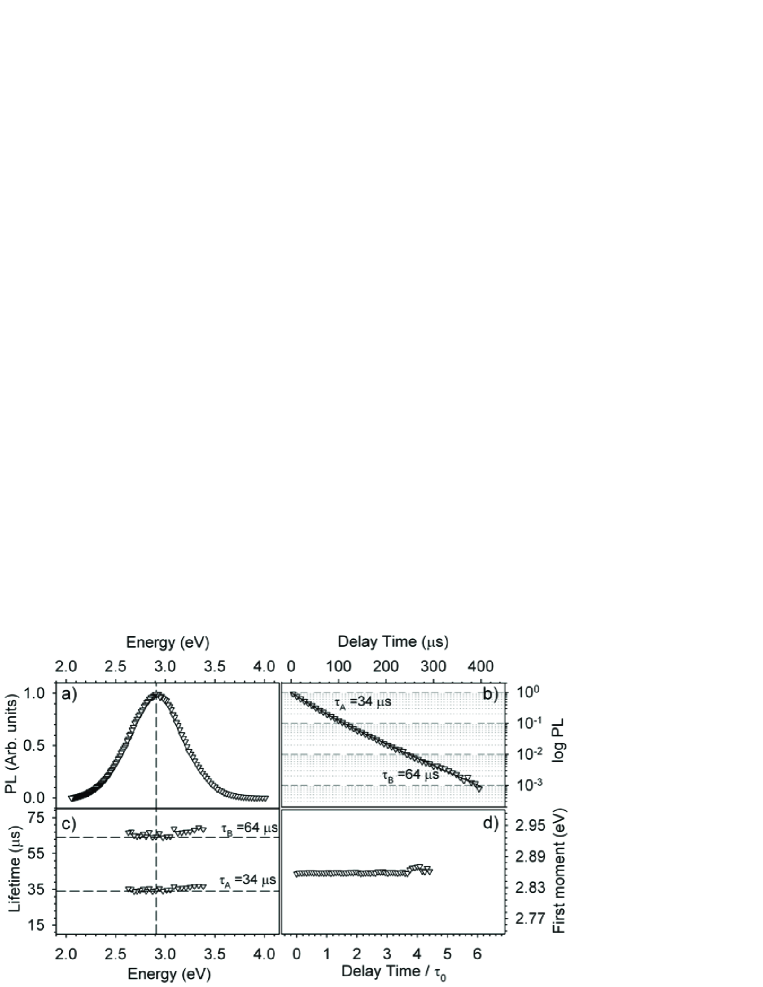
From all time-resolved measurements one can extract the lifetime dispersion curves, namely the dependence of the decay lifetime from emission energy. To this purpose the lifetimes were obtained by a fitting procedure of PL data at a given emission energy, carried out with a single exponential function for both activities of Ge-ODC(II), and with a double exponential function for sapphire PL activity. Representative decays measured at the band peak energies, 3.1 eV, 4.4 eV and 2.8 eV for triplet Ge-ODC(II), singlet Ge-ODC(II) and sapphire PL signals, are reported with relative fitting curves in figures 3-(b), 4-(b), and 5-(b) respectively. The experimental low temperature (25 K) was chosen to ensure purely radiative decays from excited electronic state, especially to prevent the activation of ISC process from the excited singlet ODC(II) state (see figure 1).
The lifetime of the triplet Ge-ODC(II) (figure 3-(c)) varies from 130 to 100 s for emission energies increasing from 2.8 to 3.5 eV, while that of the singlet Ge-ODC(II) (figure 4-(c)) varies from 11 to 7 ns in the 3.84.8 eV range. Finally, in the sapphire sample lifetime dispersion is not observed: indeed, the two lifetimes characterizing the luminescence decay are independent from emission energy: they remain fixed to =34 s and =64 s all over the range of the PL band.111It is worth noting that the double exponential behavior of P-centre luminescence in sapphire is unknown at the best of our knowledge. In [22] the authors found a lifetime of 50 s which is consistent with the mean of the two lifetimes found here. It is beyond the aim of this paper to investigate about the reason behind these decay features.
The observed energy dependence of the luminescence lifetime is expected to cause a progressive red shift of the first moment of the band, due to different temporal evolutions of different parts of the PL band. From measured spectra we have thus calculated the time dependence of the first moment of the luminescence bands: the results are reported in figures 3-(d), 4-(d) and 5-(d) for triplet Ge-ODC(II), singlet Ge-ODC(II) and sapphire activities, respectively. The horizontal axes represent the time delay from the laser pulse in unit of the lifetime : for both Ge-ODC(II) activities is defined as the lifetime of PL signal at the central emission energies, 114 s and 8.7 ns for triplet and singlet decay respectively. For sapphire activity is chosen to be the mean value of the two experimental lifetimes and . We observe that both slow and fast PL activities in silica feature an approximately linear red shift of the band as a function of time, whereas the first moment of the PL activity in sapphire has a constant value consistent with the results found for the lifetimes.
4 Discussion
The comparison between results on the oxygen deficient centres in SiO2 and the defects in sapphire suggests that the distribution of lifetimes measured for different emission energies and the correspondent red-shift of first moment of the band as a function of delay time, are peculiar features of defects embedded in amorphous solids as opposed to defects in crystals, where such effects are not observed. This characteristic behavior of ”amorphous defects” can be conveniently referred to as luminescence dispersion. A similar result had been pointed out in a previous work [14] by comparing the PL properties of the S1S0 transition of Ge-ODC(II) with those of F-type centres in Lithium Fluoride. While featuring comparable fast (ns) lifetimes, the decay properties of these two systems turned out to be very different: a strong luminescence dispersion was found for Ge-ODC(II) (now confirmed by data in figure 4), while the decay lifetime of F-centres in LiF was found to be independent from emission energy and the luminescence peak independent from time [14].
Present results yield a strong generalization of previous findings: indeed, data reported in section 2 demonstrate that the PL dispersion effect occurs both for the fast (ns) singlet and for the slow (s) triplet luminescence of the Ge-ODC(II), so being independent from the temporal range of the decay kinetics as well as from the nature of the transition. Also, dispersion effects are absent in sapphire defects, similarly to what previously observed in LiF [14], and notwithstanding the double-exponential decay kinetics, which may suggest the coexistence of two slightly different varieties of the optically active centre.
On the whole, our results suggest luminescence dispersion to be a general optical property which allows to clearly discriminate the behavior of defects embedded in amorphous solids from crystalline ones. At least, this appears to be true for oxides. Also, it is worth stressing that the lifetime of a PL band of defects in a solid is widely regarded as a strong fingerprint of the defect, which can be used to unambiguously recognize it by time-resolved PL measurements. It is worth noting that, without taking care of lifetime dispersion effects evidenced here, lifetime differences as large as 30% in amorphous systems can wrongly be regarded as signatures of different defects.
These experimental results can be discussed in the framework of a theoretical model [14] based on the standard background for description of point defects’ optical activities in a solid matrix [1, 3], adding the hypothesis of gaussian distribution (centre and half-width ) of the zero phonon energy , that is the energy difference between ground and first excited electronic state both in the ground vibrational sub-level. This hypothesis accounts for the effect of the different environments which can accommodate different members of an ensemble of point defects in an amorphous matrix. The peak PL emission energy can be equivalently used as a statistically distributed parameter instead of the zero phonon energy. Indeed, these two spectroscopic features are linked by the relation where is the half Stokes shift, that is the half difference between the peak of absorption and luminescence bands and which is supposed undistributed as the other homogeneous parameters (the homogeneous half-width and the oscillator strength ). Hence, the gaussian distribution of implies a gaussian distribution of with the same half-width and centred at .
On this basis, one can write a quantitative expression of the PL emitted by the ensemble of color centres in an amorphous solid [14]:
| (1) |
Equation 1 gives the emission signal measured at time at the spectral position , as obtained by convolution of a gaussian distribution of , whose half-width represents the inhomogeneous linewidth of the ensemble of defects, with a homogeneous term (within squared parentheses) representing the PL of a defect emitting at a given value of and with homogeneous half-width : the spectral shape of the homogeneous term is , where the function is a Poissonian with first moment and second moment . Finally, the radiative lifetime is given by the Forster’s equation [14, 25]:
| (2) |
where is the oscillator strength of the defect, and is the refractive index of silica.222In writing 2 we have neglected the ”effective field correction” term, which can be argued to be close to unity in silica within the investigated spectral range. We also neglect the slight energy dependence of the refraction index , which we assume for silica to be 1.5. One can numerically integrate 1 in order to simulate the time-resolved PL spectra, , as a function of the four parameters . From , the decay lifetime and the kinetics M1s() of the first moment can be easily calculated, by using the same procedure applied to the experimental data .
Equation 2 implies that defects with different peak emission positions within the gaussian distribution should decay with different lifetimes. In this sense, it immediately allows to understand data in figures 3-(c) and (d) on a qualitative basis, if we suppose the PL band of ODC(II) as arising from the inhomogeneous overlap of bands peaked at different energies, statistically distributed within the defect population.
The behavior shown in figures 3 and 4 for silica PL activity can be examined in the frame of the above theoretical model. To this aim we have performed numerical integration varying the above mentioned parameters, to obtain a set of three theoretical curves which simultaneously fit the shape of PL bands, the dependence of the decay lifetime as a function of the emission energy and the kinetics of the first moment. This procedure was performed both for the triplet and singlet luminescence signals of Ge-ODC(II). The continuous lines in figures 3 and 4 represent the results of our fitting procedure, while the histograms show the discrete Poissonian homogeneous lineshapes of half width as obtained by our fit procedure. Since the PL dispersion effect found here for Ge-ODC(II) is not evidenced in sapphire luminescence, we argue that in a crystal, beside a few imperfections due to dislocations or strain, the inhomogeneous effects (and thus the related width) are virtually absent. As a consequence the red shift of the first moment of PL band and the dispersion of lifetimes are not possible, consistently with experimental results (see figure 5).
-
f Triplet PL 3.080.05 1408 12516 (3.30.5) 10-5 Singlet PL 4.320.05 17710 9312 0.0730.010 Triplet PL 564 1889 5214 62 Singlet PL 785 20010 236 175
Upper part of table 1 resumes the best parameters obtained by our fitting procedure for the two luminescence transitions of Ge-ODC(II). In the lower part of table 1 we also report the parameter which estimates the degree of inhomogeneity. On one hand, the results on the parameter evidence that inhomogeneous effects strongly affect both the electronic transitions of the ODC(II) defects in silica. On the other side, the value of for triplet emission of Ge-ODC(II) (56%) is smaller than that found for singlet emission (78%). Hence, the width of the inhomogeneous distribution turns out to be greater for the SS0 transition than for the TS0 one. This finding can be qualitatively visualized by comparing figure 3-(c) with figure 4-(c): in fact, the relative lifetime increase observed by moving leftwards by a FWHM on the horizontal axis is lower (20%) for the triplet PL than (33%) for the singlet PL band.
This result leads to an important consideration about the meaning of inhomogeneity: the inhomogeneous width has to be considered as a property of a specific electronic transition occurring at the defect site, rather than a property of the defect. As a matter of fact, the physical property of the defect which lies at the root of inhomogeneity effects is the site-to-site distribution of the structural parameters, such as bond angles and lengths. In this sense, the statistical distribution of should be regarded as a convenient, and synthetic, representation of inhomogeneity effects; the form and width of such a distribution are determined in principle by the detailed dependence of the emission peak from the microscopical structural parameters. Only quantum mechanical calculations can investigate the form of this mapping function, and may allow to understand why it ultimately results in a larger degree of inhomogeneity affecting the S1S0 transition as compared to the T1S0 transition of Ge-ODC(II). Also, more experimental investigations are needed to find out whether this difference between triplet and singlet emissions is a general property of defects in amorphous systems or a peculiar feature of oxygen deficient centres in silica.
Finally, the values of the oscillator strength found here are in excellent agreement with those reported in a review paper about oxygen deficiency centres in silica [12]: 0.03-0.07 for the singlet band of Ge-ODC(II) and 1.2 for the triplet band. From data in the upper part of table 1 we can also calculate the Huang-Rhys factor , the vibrational frequency , the total width (from ) [14]. All these quantities are summarized in the lower part of table 1 and are obtained by using =0.30 eV and 0.38 eV for the half Stokes shift of triplet and singlet PL band, respectively. The values of were estimated experimentally by measuring the half-difference between the spectral positions of the excitation energies and emission peaks. Result on the vibrational frequencies shows that the Ge-ODC(II) couple with very low frequency modes, accordingly with previous experimental and computational results [8, 14, 26, 27].
5 Conclusions
We have studied by time-resolved luminescence the extrinsic (Ge-related) oxygen deficient centres in amorphous silicon dioxide. Both the triplet and the singlet PL of the defect feature a dispersion of decay lifetimes within the emission band and a temporal red shift of their first moments. Comparison with a defect in crystalline sapphire demonstrates that these effects are peculiar of a centre embedded in a disordered solid. Experimental findings are analyzed within a theoretical frame which models the effects induced by glassy disorder on the optical properties of defects in silica to numerical estimate the homogeneous and inhomogeneous half width. We find that the degree of inhomogeneity experienced by the triplet luminescence band is appreciably less than by the singlet one.
References
References
- [1] Defects in SiO2 and Related Dielectrics: Science and Technology 2000 eds Pacchioni G, Skuja L, and Griscom D L (Norwell USA: Kluwer Academic Publishers)
- [2] Silicon-based Materials and Devices 2001 ed Nalwa H S (San Diego USA: Academic Press)
- [3] Stoneham A M Theory of Defects in Solids 1975 vol 1 (Oxford: Clarendon Press)
- [4] Persistent Spectral Hole-Burning: Science and Applications (Topics in current Physics vol 44) 1988 ed Moerner W E, (Berlin heidelberg: Springer-Verlag)
- [5] Leone M, Agnello S, Boscaino R, Cannas M and Gelardi F M 1999 Phys. Rev. B 60 11475
- [6] Cannizzo A, Agnello S, Boscaino R, Cannas M, Gelardi F M, Grandi S and Leone M 2003 J. of Phys. and Chem. of Solids 64 2437
- [7] Cannizzo A and Leone M 2004 Phil. Mag. 84 1651
- [8] Cannizzo A, Leone M, Boscaino R, Paleari A, Chiodini N, Grandi S and Mustarelli P 2006 J. of Non-Crys. Solids 352 2082
- [9] Skuja L N, Streletsky A N and Pakovich A B 1984 Solid State Commun. 50 1069
- [10] Nishikawa H, Shiroyama T, Nakamura R, Ohki Y, Nagasawa K and Hama Y 1992 Phys. Rev. B 45 586
- [11] Skuja L 1994 J. Non-Cryst. Solids 179 51
- [12] Skuja L 1998 J. Non-Cryst. Solids 239 16
- [13] Agnello S, Boscaino R, Cannas M, Gelardi F M and Leone M 2000 Phys. Rev. B 61 1946
- [14] D’Amico M, Messina F, Cannas M, Leone M and Boscaino R 2008 Phys. Rev. B 78 014203
- [15] Agnello S, Boscaino R, Cannas M, Gelardi F M, Leone M and Boizot B 2003 Phys. Rev. B 67 033202
- [16] Chen W, Tang H, Shi C,Deng J, Shi J, Zhou Y, Xia S, Wang Y and Yin S 1995 Appl. Phys. Lett. 67 317
- [17] Caulfield K J, Cooper R and Boas J F 1997 J. Phys: Condens. Matter 9 6457
- [18] Surdo A I, Kortov V S, Pustarov V A and Yakovlev V Y 2005 Phys. Sta. Sol. c 2 527
- [19] Heraeus Quartzglas, Hanau, Germany, catalog POL-0/102/E
- [20] Grandi S, Mustarelli P, Agnello S, Cannas M, and Cannizzo A 2003 J. Sol-Gel Sci. Technol. 26 915
- [21] A D Mackay, Inc 7509 North Broadway PO Box ’G’ Red Hook, New York 12571-0046
- [22] Pujats A V, Springis M J and Valbis J A 1980 Phys. Stat. Sol. a 62 K85
- [23] Springis M, Kulis P, Veispals A and Tale I 1995 Rad. Measurements 24 453
- [24] BD Evans J Appl Phys 70 1991, 3995
- [25] Frster Th 1951 Fluoreszenz Organischer Verbindungen Vandenhoeck und Ruprecht, Gttinen 158
- [26] Galeener F L, Leadbetter A J and Stringfellow M W 1983 Phys. Rev. B 27 1052
- [27] Umari P, Gonze X and Pasquarello A 2003 Phys. Rev. Lett. 90 027401